Month: January 2023

Observation: Removing Water Vapor (Greenhouse Gas) Leads To Warming…Adding It Leads To Cooling

Per scientists, removing a greenhouse gas – water vapor – from the atmosphere results in net additional forcing (warming). Irrigation studies also affirm adding water vapor cools the surface.

Per “mainstream” climate science, Earth’s total greenhouse effect radiative forcing from water vapor, clouds, CO2, and trace greenhouse gases (like methane) amounts to 150 W/m² (Lacis, 2018). About 50% of this 150 W/m² total (75 W/m²) greenhouse effect forcing is derived from water vapor, 25% (37 W/m²) is from clouds.
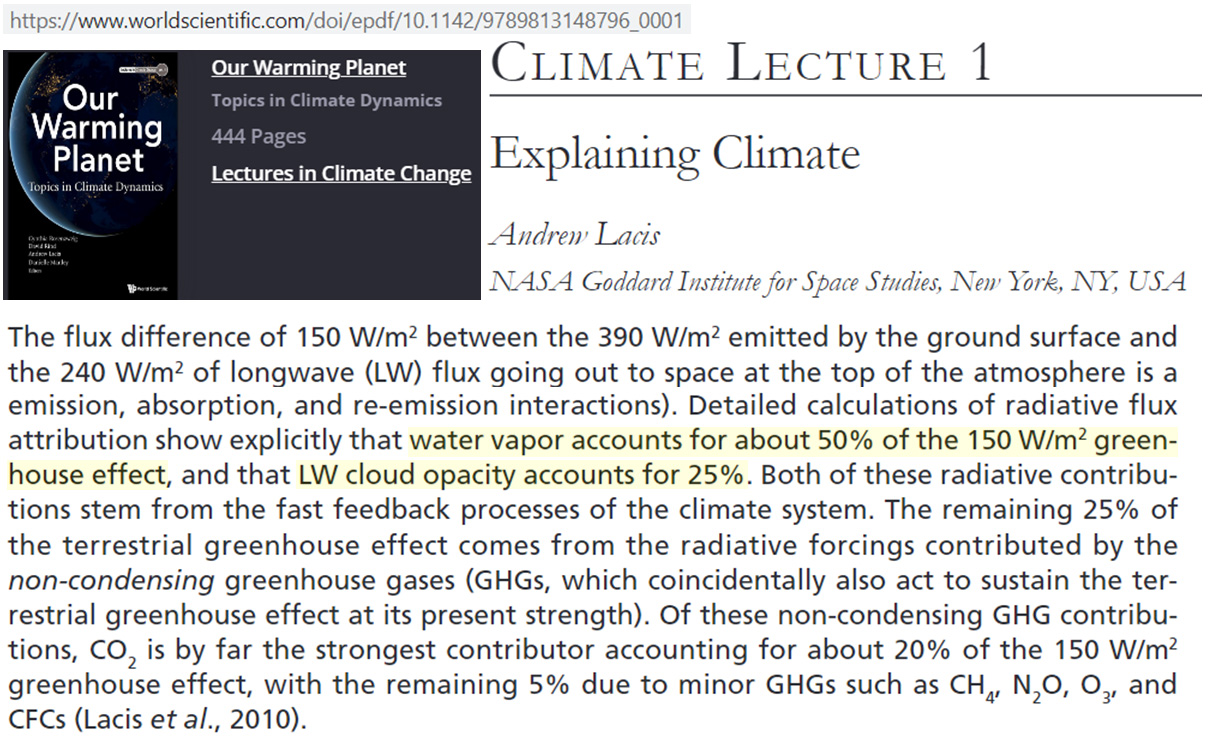
Image Source: Lacis, 2018

But the contradictory “mainstream” science says removing clouds and water vapor from the atmosphere actually has a far greater radiative impact than their influence as greenhouse warming agents.

A cloud-free day at noon results in an extra +251 W/m² of radiative forcing relative to a cloudy day at noon. Removing water vapor , a greenhouse gas, leads to a forcing increase of +131 W/m².
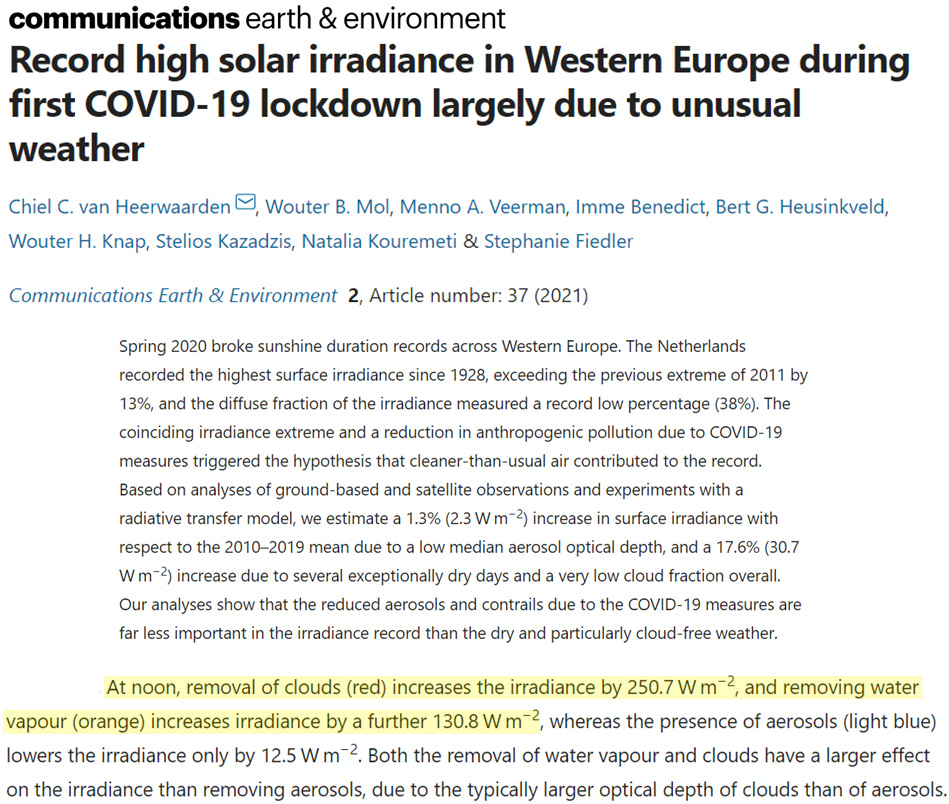
Image Source: van Heerwaarden et al., 2021

Together, that’s +382 W/m² of additional forcing with the absence of these greenhouse effect/greenhouse gas agents, whereas the total greenhouse effect forcing from water vapor and clouds is just +112 W/m² (75 + 37 W/m²).

So the presence of greenhouse gases (water vapor) with clouds combined have a net -270 W/m² cooling effect on Earth’s surface temperatures.

Adding water vapor to surface air leads to cooling

According to a 2018 study by Sherwood and co-authors, the last 100 years of anthropogenic water vapor emissions (mostly from irrigation) have produced a total effective radiative forcing of -0.1 to 0.05 W/m². In other words, adding more greenhouse gases in water vapor form leads to a “near-zero or small cooling effect.”

Sherwood et al. even acknowledge “large increases in anthropogenic water vapor emissions would have negligible warming effects on climate” because “greenhouse-gas warming is outweighed by increases in…humidity-induced low cloud cover.”
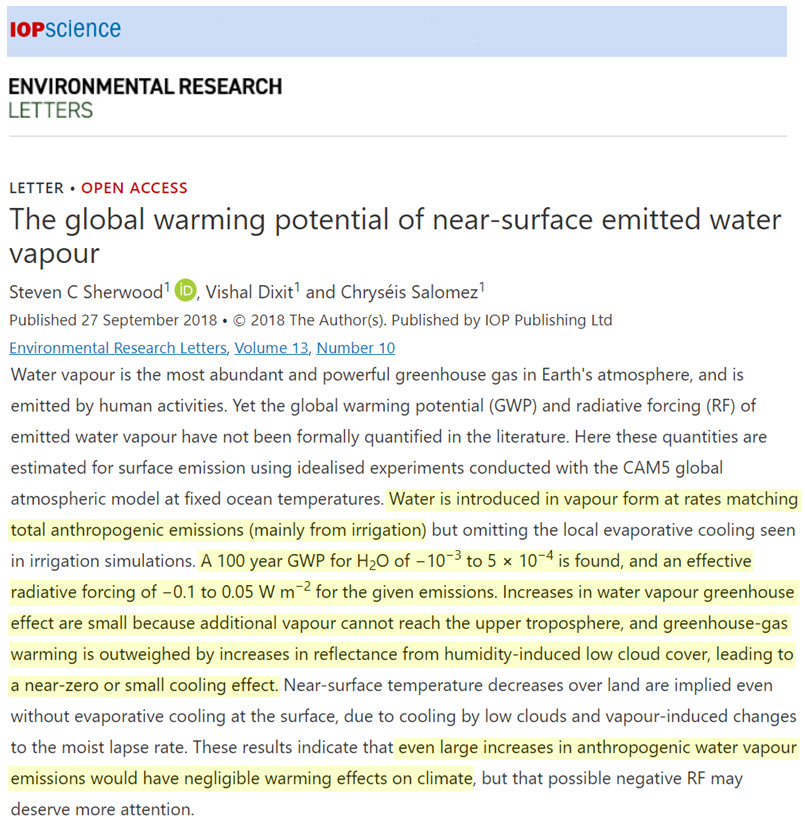
Image Source: Sherwood et al., 2018

New studies have continued to verify that adding the water vapor greenhouse gas to the surface air results in cooling.

For example, Kala et al. (2023) report substantial cooling results from adding this greenhouse gas.

“Our results show that irrigation could potentially reduce the mean seasonal maximum temperature during the Angry summer of 2012/2013 by −1.44°C to −2.13°C over irrigated regions.”

Zhang et al. (2023) also report expanding irrigation across regions of China has resulted in verifiable cooling effects.

“We found the space-and-time method can better represent the cooling effects of long-term irrigation expansion than the space-for-time method, despite that they derived similar cooling trends. The cooling effects were most evident in South Xinjiang, followed by North Xinjiang and Hexi Corridor, and varied in different irrigation expansion sources. Specifically, more intensive cooling occurred in new irrigated areas from unused lands (-0.69 ± 0.02 K) than that from grasslands (-0.47 ± 0.05 K) and forests (-0.28 ± 0.04 K). The cooling effects were dominated by marked daytime cooling compared to negligible nighttime warming.”

Other recent studies also affirm the conclusion that adding water vapor, Earth’s main greenhouse gas, cools the surface air.

In the very same regions of India where irrigation has been most prevalent, significant growing-season cooling has been occurring. Land surface temperatures (LST) in the Indo-Gangetic Plain have cooled by -0.8°C since 1979, and this is “associated with the irrigation expansion” in the region.
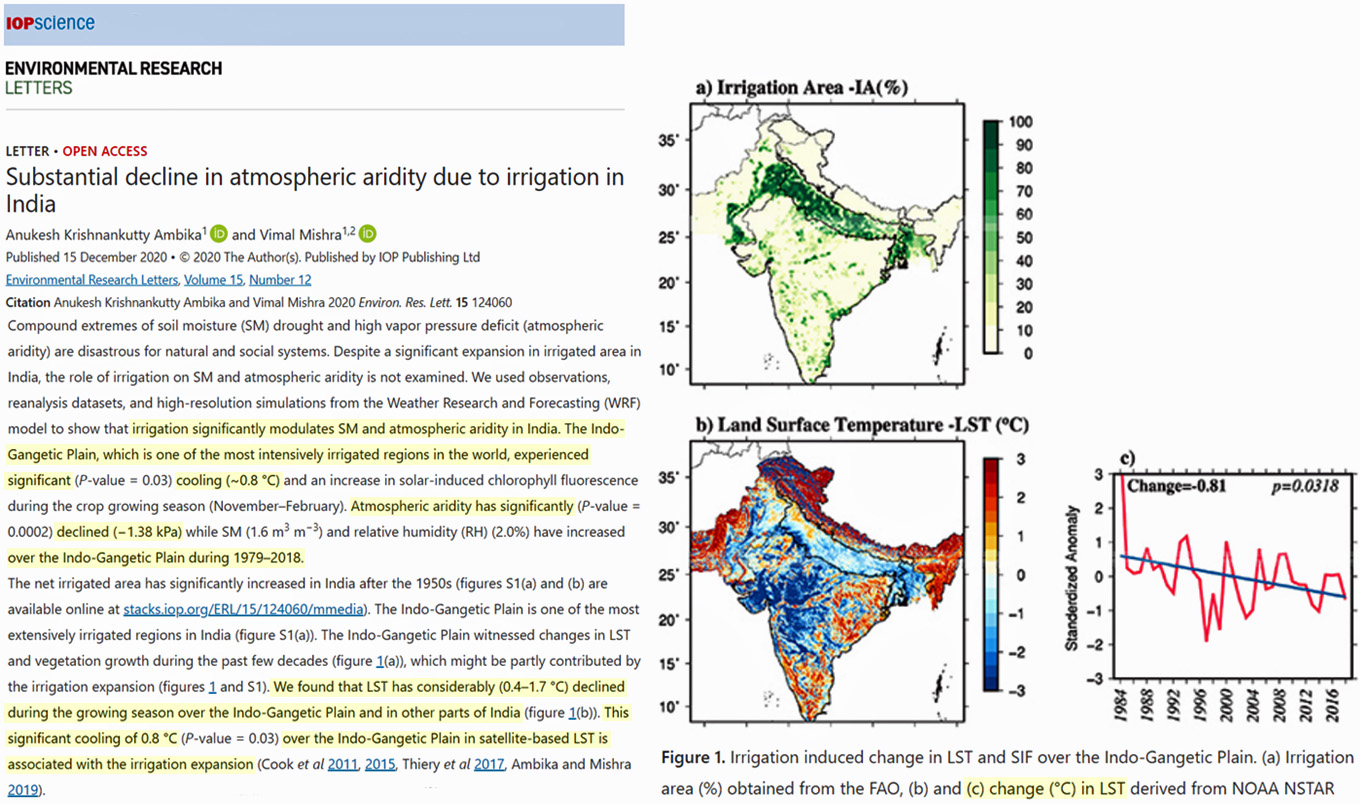
Image Source: Krishnankutty Ambika and Mishra 2021

The same phenomenon has been observed in China. Scientists (Yang et al., 2020) even refer to adding anthropogenic water vapor emissions to the atmosphere as the irrigation cooling effect (ICE), which is “closely linked to the surface energy balance.”

Irrigation “cools daytime LST by 1.15 K, and cools nighttime LST by 0.13 K, on average, across the irrigated areas of China.” During the growing season, pumping Earth’s most powerful greenhouse gas into the atmosphere results in a cooling effect of more than 6 K in irrigated (ICE) regions compared to adjacent locations not subjected to greenhouse gas cooling.

Image Source: Yang et al., 2020
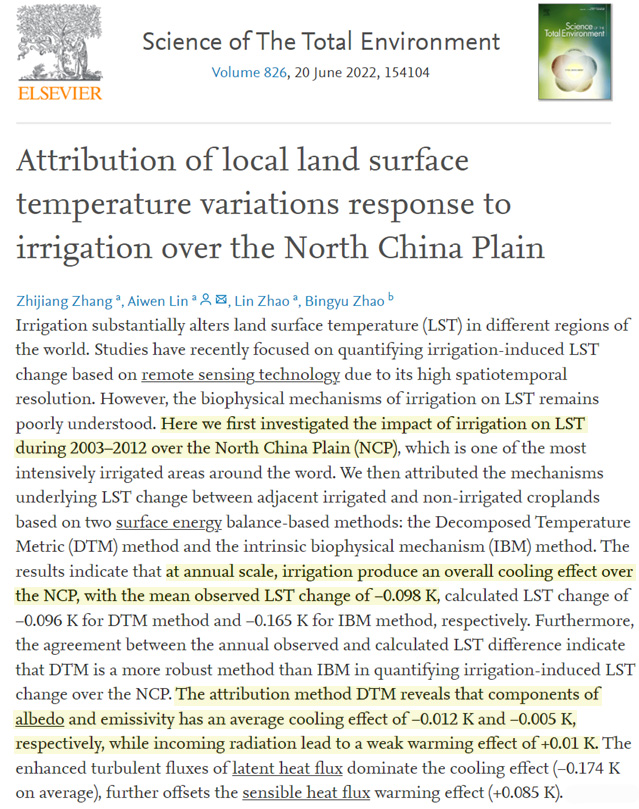
Image Source: Zhang et al., 2022

These observational results would appear to contradict the modeled claims that water vapor is a positive feedback leading to enhanced warming.

via NoTricksZone

https://ift.tt/gU0NbLF

January 30, 2023 at 03:00PM

Just like that: the suspicious solar panel disappears. The Bureau of Met experts at work?

By Jo Nova

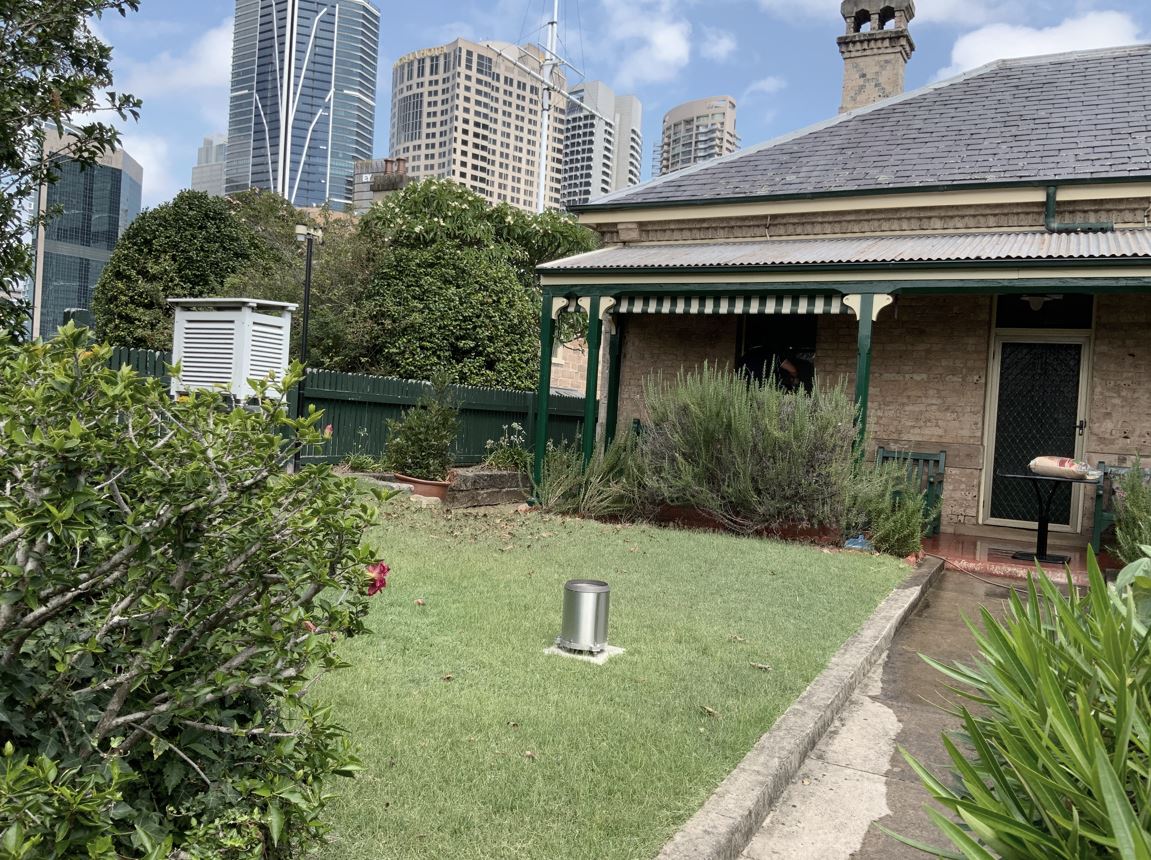
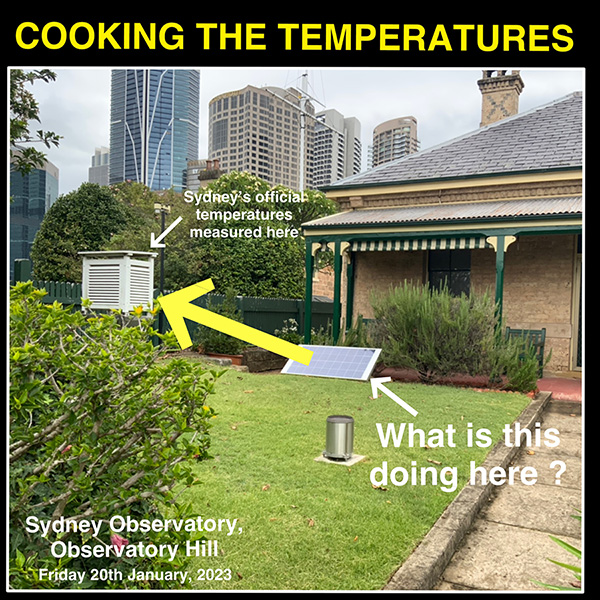
Remember the strange solar panel that appeared a few meters due south of the Sydney Observatory thermometer at the same week as the city ended it’s coldest streak in 140 years? Well Craig Kelly, who took the original photos, went back and now its gone.

Today there is just grass and shrubs to reflect the midday sun towards the back of the thermometer box.

Sydney Observatory, Thermometer, solar panel, Jan 2023.

Photo by Craig Kelly

As Craig Kelly said: “The fact that it’s disappeared shows that it was never installed – someone at the BOM just happened to grab a random solar panel and place it at such an unexplained position…”

So much for expert rigorous science accurate to a tenth of a degree.

Kelly explains that this site is nearly invisible:  “The only way you can see it is by holding a camera above your head – it’s not visible to the eye – even if you were 6’6” and standing on your toes you can’t see over the fence – and the Observatory is closed to the public for some unknown reason.”

Perhaps the BOM just thought no one would notice, and “it’s for a good cause, eh?” We can’t have the punters thinking Sydney was cooler today than in 1883.

As I said:

The solar panel was exactly due south of the Stevenson screen on exactly the right day. If, hypothetically, someone wanted to leave a reflective object pointed at the box at midday, that’d be the place to do it.


Sydney Observatory, Thermometer, solar panel, Jan 2023.

That’s a strange spot to leave a panel… | Photo by Craig Kelly 

There’s only been one day above 30°C since Feb 21st last year in Sydney, and that was a day when the awol solar panel was there, seemingly connected to nothing and leaning on a bush.

Guilty, what? Will the BOM retract the 30.2°C “official temperature” or do secret homogenisation adjustments to figure out what the temperature might have been with thermometers 800 km away?

Solar panels only absorb 22% of the sun’s energy. They can reflect plenty of light, much more than grass would, and it’s possible that extra light heated up the Stevenson screen artificially.

 …even if somehow this solar panel didn’t change the temperature on the day, it tells us everything we need to know about the lackadaisical BOM standards. There is something profoundly dishonest about claiming they do expert science while not maintaining sites, or explaining how large the uncertainties really are, and how meaningless most “hot records” may be.

The site is a terrible site even on a good day. Ken Stewart notes the BOM’s own instructions say there should be a 30m buffer around the thermometer screen.

__________________________

Google Maps of Sydney Observatory

Sydney Observatory Temperatures in Jan 2023  | Long term records of BOM site ID 066214 |  Site metadata and maps   |   Latest Sydney Observatory temperatures (last 72 hours.)

0 out of 10 based on 0 rating

via JoNova

https://ift.tt/UPBf9j8

January 30, 2023 at 01:18PM

Update on Fight Against Ballot Abuse

Jay Valentine further educates the public on purifying elections in his recent American Thinker article Tracking a Fraudulent Ballot in Real Time.  Excerpts in italics with my bolds.

During our year with Mike Lindell, the Fractal team went from never having seen an election roll to running the largest election database ever created, with over 1.7 billion records — for 12 states alone.

With only 165 million or so voters in the United States, why such a large database?  Data travel, data move, data tell a story as they traverse different databases — over time.

Voter Identity

Let’s take an example.

Phineas Phrogg, our made up character, is on a voter roll. Phineas owns a home, has three credit cards, two cars, does limited social media, is a deacon at his church and active in the Lions Club.

Phineas’s data in any single database yield 1 x 1 = 1 level of insight.  A state voter roll, taken on March 15, is a flat surface with little actionable information.

If we take multiple databases where Phineas appears — his credit file, auto history, auto registration, donation info, and perhaps ten other common places Phineas innocently appears, we get a relief map — not a flat surface.

Artificial intelligence predicts a lot of what Phineas is likely to do and likely to buy.  Here Phineas’s information is 1 (Phineas) x number of data sources = 1,000 or 10,000 data points. The A.I. program knows more about Phineas than he may know himself.

This is not high tech. Every major consumer goods company does this work today
— every reader of this article exists in scores of these databases.

Now for the hard stuff.

Voter Behavior

What if we take a snapshot of every one of Phineas’s databases on different dates? Perhaps every month, or every week?  We see Phineas’s actions over time.

We see Phineas’s likes and dislikes in one database — perhaps the car he chooses — change over the time series. We can probably tie some of those new preferences to changes in another data source — perhaps a contribution database.

Phineas started giving money to animal rescue. This change might ripple through some other preferences as well. Maybe he is moving toward being a vegetarian.

The A.I. systems for the consumer goods company will pick this up, too — three years from now. We identify the behavior change almost instantly.

Finding Dirty Data in the Haystack

That, people, is a game-changer.

That is why, for a single state, like Pennsylvania or Georgia, we collected over 350,000,000 (350 million) records from the voter rolls in less than one year. I just wanted you to see all the zeroes.

When our team built the TSA No-Fly List technology and the auto fraud systems for State Farm, GEICO, USAA, and others, their data teams bemoaned the “dirty data” in those databases. They had clear agità from the misspellings, wrong addresses, different ways to show an address, fraudulent entries.

Our team loved dirty data.  This is not a porno thing. Dirty data — inaccuracies, misspellings, multiple ways of entering a street name — are Hansel’s and Gretel’s little stones leading to insight you cannot find anywhere else.

For eBay, when we built their cyber-fraud prevention system — they had already called the Secret Service, the FBI, every neural net company — they were all stymied by — you guessed it — dirty data!

The data magnification lesson is over. Let’s get to voter rolls.

Uncovering Phantoms in the Voter Rolls

If you do not think the government’s election commissions are in on the massive voter fraud inherent in every state’s voter rolls, you can stop reading here — because they are, and we can prove it in state after state. Read some of our reports on www.Omega4America.com.

Anyone can compare voter rolls with NCOA (the National Change of Address database) and find people who moved. Any high school math kid can run statistics against voter rolls and find anomalies growing on trees. Any tech quant, living in his parents’ basement, can run an obscure algorithm showing vote numbering inconsistent with historical patterns.

Come to think of it, in 2021 and 2022, these guys were everywhere — and they didn’t remove fake voters. Time to move on — they failed, and the Republicans failed with them.

We know phantom voters are the seed bed for fake ballots.

The ballots aren’t fake — they are quite real, but called “fake” because they aren’t voted by the name on their envelope.   We know that fake ballots are mailed, at industrial scale, to legitimate voters, fake voters, dead voters, voters who moved.

The Fractal election system is used by voter integrity teams to show, by cross-searching personal property rolls, for instance, that Phineas Phrogg votes and lives at an address that is an Ace Hardware Store. That should be enough to get Phineas off the voter roll.  What if it isn’t? 

The UnDeliverable Ballot Database is not a “bad address” list.

It is real time — almost, depending on the data — using snapshotting technology developed with the Wisconsin voter integrity team. It picks up changes in multiple data sources — constantly!

Here are examples from 2020 and 2022:

Phineas lives at an apartment building with 125 units. The property roll tells us it is a multi-family unit, but Phineas does not have his unit or apartment number in the election roll — so a ballot is going to Phineas, but he won’t get it.

We know this today — two years before 2024.

We can know this for every apartment building in every state, in every county in America, in 90 days. Maybe right now might be a good time to take action to either get Phineas’s apartment number in the voter roll or get him off it.

But if not, we know with certainty that his ballot cannot legally be voted.

A local integrity team may want to hang out when ballots arrive — with the leftist who will certainly be there — to track what happens with that ballot. No voter intimidation here — just want to make sure the leftist kid there to collect Phineas’s ballot…doesn’t!

Fractal cross-searches every voter against every physical address he claims to inhabit
— and kicks out “anomalies.”

In a Midwestern state this month, canvassers who used the RNC data for electioneering months ago — used the Fractal-cleaned lists — said, “In 22 years canvassing, we have never seen such accurate lists. The RNC lists were garbage.”   Because Fractal told them the square footage of every single-family residence, they could determine which were phantom nests with 15 registered adults in an 800-square-foot home.

The Wisconsin team innovated in 2022 with the “root query.”

The Fractal system found 1,250 people living at a single address — a college dorm. The Wisconsin team found that only 300 people can live there at any one time. Good find.  That was not enough for these guys. They had the Fractal team create the “root search” — thus digging into the address one layer deeper. Guess what! Not only were 1,250 people getting ballots at an address where only 300 can live, but 450 of those ballots went to a single dorm room!

What if that room number changes?  The Fractal system picks it up by snapshotting the voter rolls every month. RNC data — well, tough luck!   Thus, the UnDeliverable Ballot database knows where 900 fake ballots are going to be sent — even when they change the address!

Multiply that by every college dorm in America, every apartment building, homeless shelter, church — you get to election-impacting pretty fast!  Think maybe that might be cool info to know?

We are fortunate that our teams used the RNC lists and the Fractal lists in the same state, months apart, with massively different results. Thus, perhaps a tech solution is at hand.

As we work with voter integrity teams to create the UnDeliverable Ballot Database in other states, we look to ingest literally trillions of records — with tons of dirty data — because we can know with certainty where a 2024 ballot is going. But Phineas isn’t going to get it.


via Science Matters

https://ift.tt/uVARhra

January 30, 2023 at 01:07PM

The Safe Climate Of 1931

Climate alarmists imagine the weather was better in the past when atmospheric CO2 levels were lower – but history doesn’t support their superstitions or childish belief systems.

via Real Climate Science

https://ift.tt/kNhurd5

January 30, 2023 at 12:46PM