
With the end of February, nearly all of the Arctic ocean basins are frozen over, so the growth of ice extent slows down, reaching its annual maximum mid-March. According to MASIE February on average adds 500k km2, and this year the growth was 880k km2, erasing a starting deficit and matching the month end average. The few basins that can grow ice this time of year tend to fluctuate and alternate waxing and waning, which appears as a see saw pattern in these images. For example, this year the two Pacific basins combined were slightly above average, but Okhotsk is 33% in surplus, while Bering is 26% in deficit to their last March maximums.
The month of February 2023 was remarkable for a wobbly Polar vortex, which cycles freezing polar air south, replacing it with incursions of warmer air into the Arctic, and then reverses the effect. This results in rising and falling freezing rates. The graph below shows the ice recovery for February 2023, the 17-year average and some recent years.

The graph (cyan) shows February 2023 starting with a 284k km2 deficit to average, several up and downs in the growth rate, until matching average at month end. 2020 also ended average with a steady refreezing rate. SII (Sea Ice Index) tracked well below MASIE this month showing 400k km2 lower extent than MASIE yesterday.
February Ice Growth Despite See Saws in Atlantic and Pacific

As noted above, this time of year the Arctic adds ice on the fringes since the central basins are already frozen over. The animation above shows the Okhotsk (upper left) and Bering (lower left) see saw. Okhotsk grew steadily to reach 133% of its last maximum, while Bering waffled up and down, ending the month ~100k km2 higher and 74% of its max.
On the right, Atlantic side Barents at the top fluctuated and added little ice ending at 56% of its max. On the lower right, Baffin Bay, and Greenland Sea (center right) show another see saw. Greenland Sea waffled adding`80k km2, ending at 96% of max, while Baffin Bay steadily added 300k km2 to reach 90% of maximum.
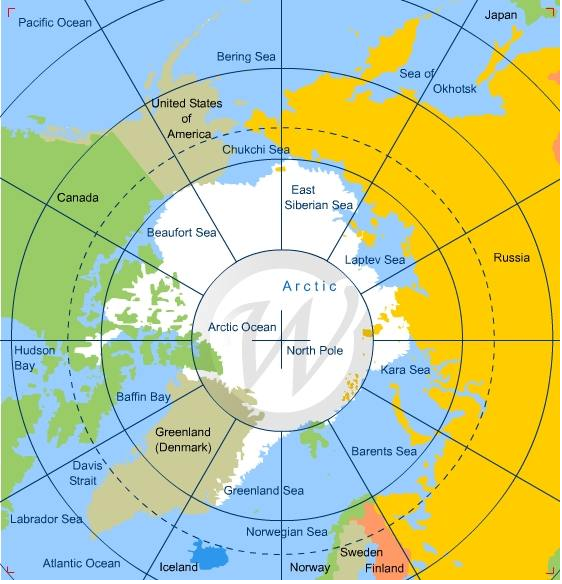
The table below presents ice extents in the Arctic regions for day 31 (Jan. 31) compared to the 17 year average and 2018.
| Region | 2023059 | Day 59 Average | 2023-Ave. | 2018059 | 2023-2018 |
| (0) Northern_Hemisphere | 14878631 | 14899627 | -20996 | 14485052 | 393579 |
| (1) Beaufort_Sea | 1070966 | 1070314 | 652 | 1070445 | 521 |
| (2) Chukchi_Sea | 966006 | 965374 | 632 | 965971 | 35 |
| (3) East_Siberian_Sea | 1087137 | 1087106 | 32 | 1087120 | 18 |
| (4) Laptev_Sea | 897845 | 897836 | 9 | 897845 | 0 |
| (5) Kara_Sea | 884398 | 926234 | -41836 | 922905 | -38507 |
| (6) Barents_Sea | 442032 | 631999 | -189967 | 544938 | -102906 |
| (7) Greenland_Sea | 745952 | 611275 | 134677 | 473064 | 272889 |
| (8) Baffin_Bay_Gulf_of_St._Lawrence | 1624859 | 1519162 | 105697 | 1786606 | -161747 |
| (9) Canadian_Archipelago | 854843 | 853331 | 1511 | 853109 | 1734 |
| (10) Hudson_Bay | 1260903 | 1260417 | 487 | 1260838 | 66 |
| (11) Central_Arctic | 3185508 | 3213856 | -28349 | 3065181 | 120326 |
| (12) Bering_Sea | 627138 | 664021 | -36884 | 336065 | 291073 |
| (13) Baltic_Sea | 81571 | 98009 | -16437 | 123280 | -41709 |
| (14) Sea_of_Okhotsk | 1132332 | 1058413 | 73919 | 1069898 | 62433 |
The table shows the only major deficit to average appears in Barents seas, more than offset by surpluses in Greenland Sea and Baffin Bay. These few peripheral basins are the only remaining regions with additional ice extent to add.
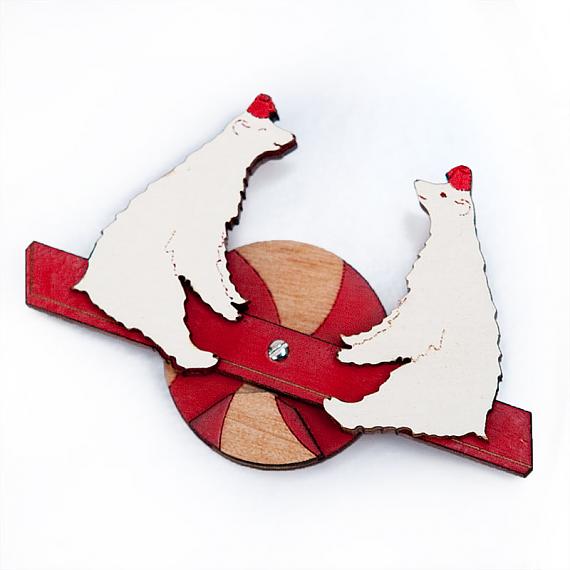
The polar bears have a Valentine Day’s wish for Arctic Ice.

And Arctic Ice loves them back, returning every year so the bears can roam and hunt for seals.

Footnote:
Seesaw accurately describes Arctic ice in another sense: The ice we see now is not the same ice we saw previously. It is better to think of the Arctic as an ice blender than as an ice cap, explained in the post The Great Arctic Ice Exchange.
via Science Matters
March 1, 2023 at 11:29AM
