
In my last post (Part IV) I showed how urbanization (as measured by population density) affects GHCN monthly-average Tmax and Tmin near-surface air temperatures during the warm season in the Northern Hemisphere. We are utilizing a technique that recognizes rural thermometer sites can experience large spurious warming with very small increases in population density, as has been known for over 50 years.
The urban heat island (UHI) effects on Tmin averaged 3.5 times as large as on Tmax, an unsurprising result and qualitatively consistent with previous studies. Also, I showed that the homogenization procedure NOAA uses to adjust the Tmax and Tmin temperatures caused greater UHI effects compared to raw (unadjusted) data, a result I cannot explain.
Again I will emphasize that these UHI warming results are based upon spatial comparisons between neighboring stations, and do not say anything quantitative about how much urbanization effects have spuriously warmed long-term temperature trends over land. That is indeed the goal of our study, but we have not reached that point in the analysis yet.
Here in Part V of my series on UHI I just want to show the difference between U.S. and non-U.S. stations, in this cased for adjusted (homogenized) Tmin data. This is shown in the following two plots, which are the same except the second plot has a logarithmic scale in population density.
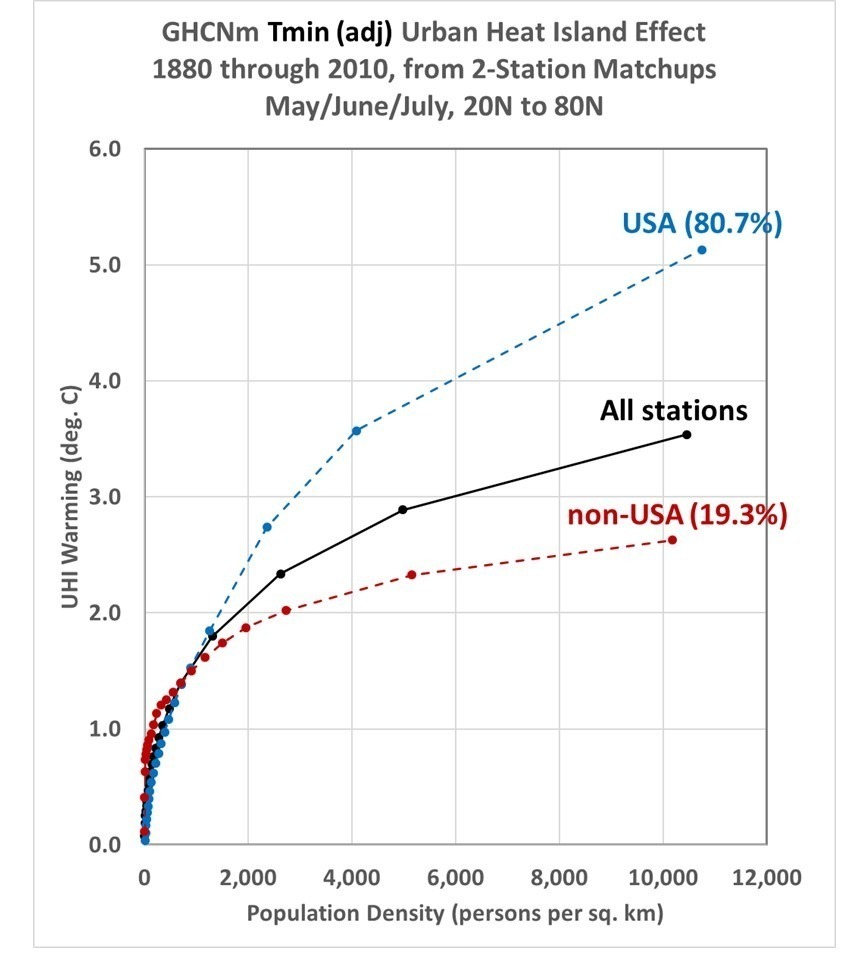
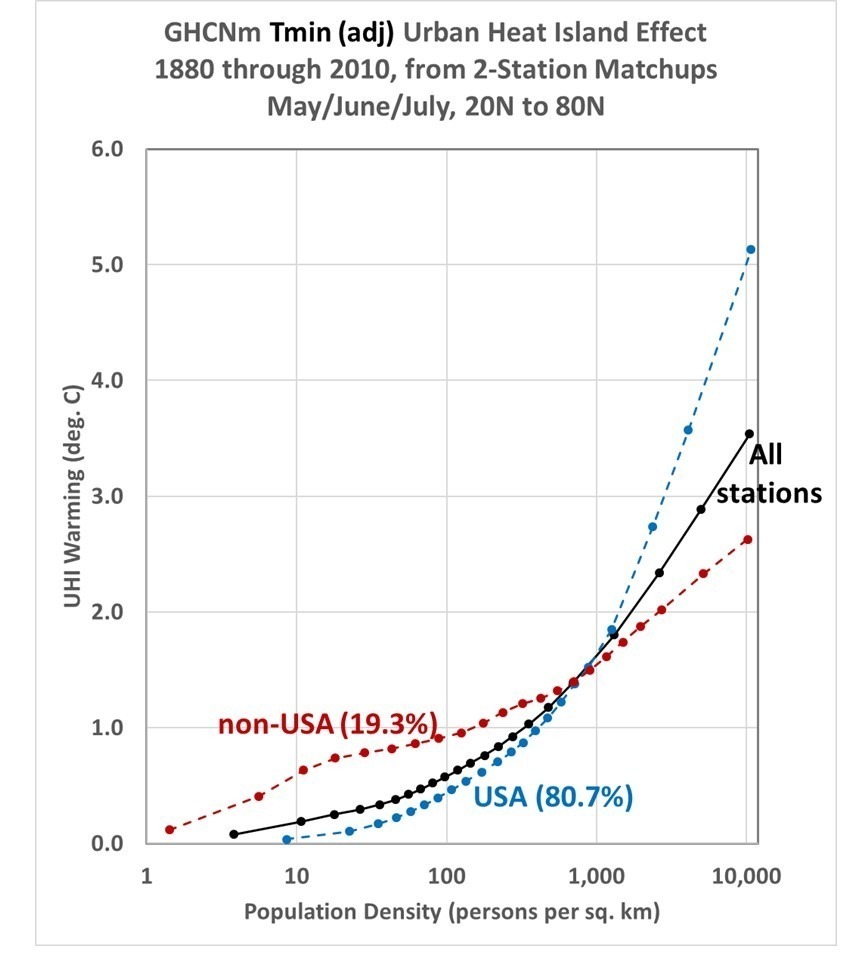
The non-U.S. stations have a more rapid rise in UHI warming at very low population densities than the U.S. stations do, but less rapid warming at high population densities. Possible reasons for this include country differences in thermometer siting and differences in waste heat generation. I’m sure you can think of other possible reasons.
As can be seen most (over 80%) of the GHCN 2-station matchups come from the U.S. Other countries have considerably fewer 2-station matchups, for example Canada (7.8% of the Northern Hemisphere total), Japan (4.7%), Turkey (2.8%), South Korea (1.3%), and China (1.1%). These low totals are not necessarily due to a lack of stations, but to a lack of station pairs within 150 km and 300 m elevation of each other needed for my current method of analysis.
The post Urbanization Effects on GHCN Temperature Trends, Part V: Tmin Warming at U.S. vs. non-U.S. Stations first appeared on Roy Spencer, PhD..
via Roy Spencer, PhD.
May 1, 2023 at 09:05AM
