
In September 2017, I meet with Carl Otto Weiss. He is an Advisor to the European Institute for Climate and Energy and a former President of the German Meteorological Institute, Braunschweig. He was not particularly interested in my work on how the Australian Bureau of Meteorology measures temperatures, he had come to Noosa to meet with me and John Abbot to discuss our research newly published in the journal GeoResJ on the application of artificial intelligence, for evaluating anthropogenic versus natural climate change (GeoResJ, Vol. 14, Pgs 36-46 published in July 2017).
Our GeoResJ paper had been pilloried on Twitter, and we had been defamed by Graham Readfearn in The Guardian. So, it was a relief that contrary to everyone else in mainstream climate science at the time, who wanted our GeoResJ paper retracted/destroyed/burnt, that Otto Weiss lauded it.
He thought it a most wonderful contribution to science showing not only what many suspect, that natural climate cycles drive the more significant changes in temperature over hundreds and thousands of years, but most importantly how the latest advances in artificial intelligence could be used to quantifying these effects.
I knew that Otto Weiss had a particular interest in measurement, after all, he had just attended the Australasian Measurement Conference (MSA2017) in Brisbane with Jane Warne from the Australian Bureau of Meteorology.
I wanted to know what he thought about the Bureau recording Australian temperature as the highest, lowest and last second in every minute rather than taking the average of all the seconds over each minute.
The World Meteorological Organisation recommended that with the transition to more sensitive resistance probes hooked up to data loggers, to maintain some consistency with temperatures historically measured by mercury thermometers that have more inertia, sampling is best averaged over at least one minute.
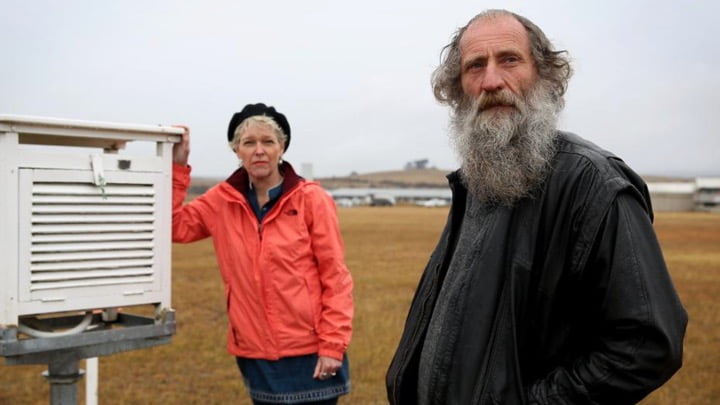
At that time the Bureau had just finished and published its ‘Review of the Bureau of Meteorology’s Automatic Weather Stations’ in direct response to a front-page article by Graham Lloyd in The Australian on August 1, 2017 that showed Lance Pidgeon and I at the Goulburn airport – where the Bureau had admitted it had been limiting how cold temperatures could be recorded for some 15 years.
When Otto Weiss queried whether it really was the case that the Bureau took spot-readings, rather than numerically averaging, I showed him the review and quoted form pages 22 where it explains:
“One-minute maximum air temperature is the maximum valid one-second temperature value in the minute interval.
I also explained that the Bureau takes the lowest one-second spot reading as the minimum, but that until recently the Bureau had sent a limit of minus 10 degrees Celsius on how cold a temperature could actually be recorded.
I explained that the Bureau also records the last one-second temperature value in each minute interval. Otto Weiss explained this was the value that would be most useful, the last second in each minute. He suggested that if the Bureau’s new resistance probes with data loggers had time constants that mimicked mercury thermometers as the Bureau claimed, then it was the last second in each minute that should be recorded and the highest of these could become the maximum temperature for each day. That was his hypothesis.
It was two years later that I tested Otto Weiss’s hypothesis after purchasing batches of daily one-second data for Canberra, Adelaide and Melbourne.
I have co-authored a 27-page report that sets out our method, results and conclusions.
Like the Ayers and Warner paper, this analysis was ready for publication in 2020. Entitled ‘One Minute Surface Air Temperature Observation – Adelaide, Canberra, Melbourne’ it, however, remains unpublished. Unlike Ayers and Warne, I no-longer have any colleagues willing to risk publishing me in a mainstream climate science journal. The last editor who published me had his journal shutdown: GeoResJ was discontinued in 2018.
My co-author cannot be named. We both live in Australia that is purportedly a secular democracy, but he risks losing his day job for assisting me with this analysis given there is no tolerance of dissent in Australia when it comes to issues of science and climate change.
Our unpublished manuscript begins:
Resistance temperature detectors (RTDs) in the Australian Bureau of Meteorology (BoM) automatic weather station (AWS) network provide temperature data at a rate of 1 Hz (sample per second). For every clock minute, three surface air temperature (SAT) observations are recorded:
• T , the last one-second reading (taken at 00 seconds of each minute)
• Tmax, the highest one-second reading over the last 60 seconds
• Tmin, the lowest one-second reading over the last 60 secondsThe BoM, however, only publishes the daily extreme values and associated statistics, e.g. the monthly and annual means. The one-minute data can be requested from the BoM for a given station, typically at a cost and processing delay.
The BoM has published statements indicating that their RTD and historical liquid-in- glass (LiG) measurements are equivalent, and specifically that the response times are similar. Every one-second reading is viewed as a time-averaged value (integrating over the past 40 to 80 seconds), effectively describing the moving-average temperature leading up to the given second, due to design of the RTD. High-frequency temperature fluctuations should therefore not be seen from second to second in the data, and also not from minute to minute (although more fluctuation could be expected at longer time scales).
Evidence that high-frequency fluctuations are indeed present in the measurements is given in this report, questioning the equivalence between RTD and LiG data.1 This can be seen by evaluating the time series consisting of all the last-second observations (a temperature series with constant sample spacing of 60 seconds), and also the difference between the last second and extreme measurements (Tmin and Tmax) for every minute, which indicates the measure of fluctuation possible, as measured with an RTD, within one minute. ENDS.
This is technical speak for let’s compare the last second reading from the resistance probe (RTD) with the highest and lowest reading each minute and the average.
When we did the analysis for Canberra airport – the example I am using in this note – we found that within the one-minute interval the difference between the last second reading and the highest second reading (maximum temperature archived by the Bureau) in any one minute interval was often more than 0.5C, and sometimes as high as 2.1C, as shown in Figure 2.3 chart B and table bottom left.
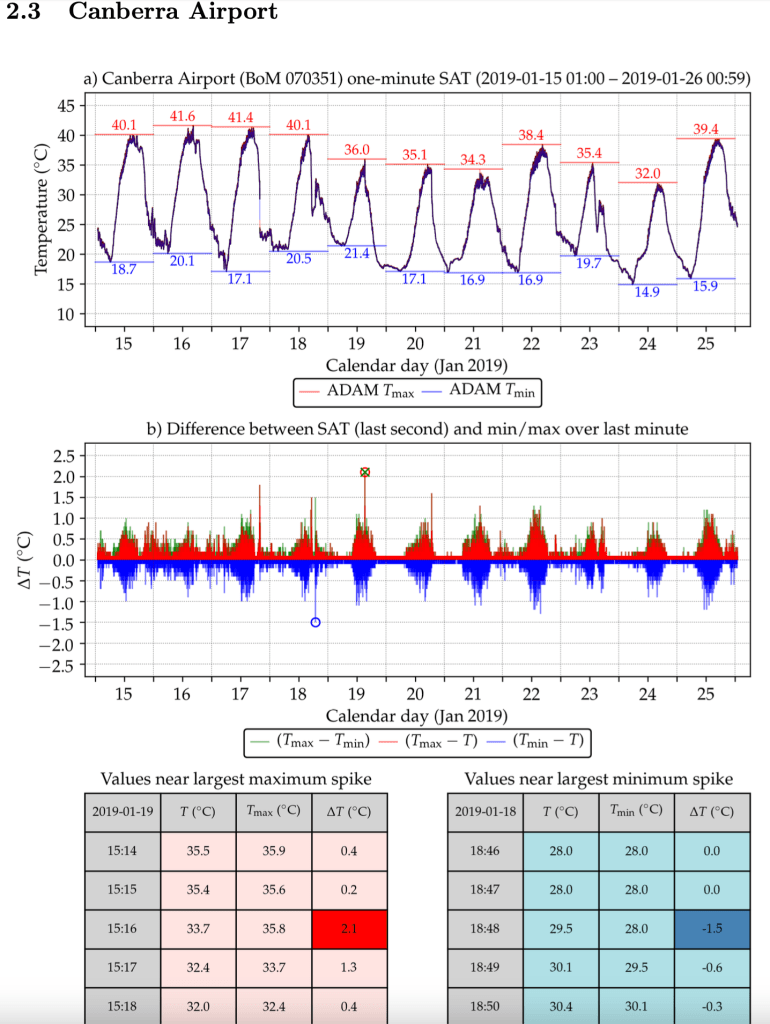
We concluded our analysis of the Canberra, Melbourne and Adelaide one minute data with comment:
The approach of the BoM to measure SAT [surface air temperature] is to record the highest, lowest and last second of every minute, as discussed before. The last-second data with the daily extremes are published and updated every 10 minutes on the “Latest Weather Observations” page for a given AWS [automatic weather station]. The data from the last 72 hours are updated every 30 minutes. The one- minute Tmin and Tmax data are also used to determine the daily ADAM Tmin and Tmax.
The WMO recommends averaging RTD [resistance probe] data over one minute. However, the BoM does not average at all, which is the reason for the spikiness of the data analysed in this report. Another example is shown in Fig. 16, displaying the last-second data observed at Canberra Airport (70351) on 17 Jan 2019.
If the WMO recommendation were followed, the BoM would provide the mean of 60 values — instead of only the single last value — for each minute. This would smooth the time series, similarly to what the averaging process depicted in Fig. 16 would do.
For illustration purposes, the moving average (MA) series over the last 5 samples (or 5 minutes, with only 1 sample per minute) is shown over the spiky last-second data. Al- though this illustration is not perfect (more data is needed to smooth over every minute), it does show that the daily Tmax would likely be lower, as it would be based on an average and not an instantaneous observation. ENDS.
Numerical averaging will drop the daily maximum temperature by almost a full one degree Celsius relative to taking the last second in each minute and by more than one degree when recording the highest one-second in each minute.
It is Bureau policy to record the highest one-second in each minute and the highest of these becomes the maximum temperature for that day for that location.
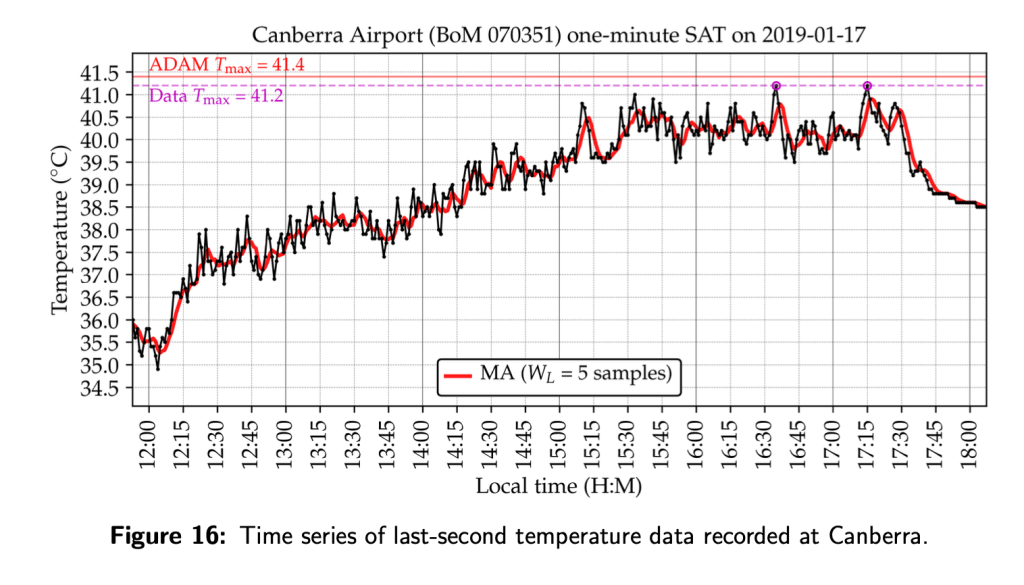
This last chart (Figure 16) from my unpublished report, shows that contrary to the hypothesis of Carl Otto Weiss, which is also a central thesis of the fake paper by Greg Ayers and Jane Warne, recording just the last second of the minute is not equivalent to the numerical average of even just the five last-one second readings. At least this was the situation at Canberra on 17th January 2019.
This is part 6 of ‘Jokers, Off-Topic Reviews and Drinking from the Alcohol Thermometer’. In part 7 I will explain why it is imperative that Greg Warne and Jane Ayers provide the A8 reports for Darwin Airport for April 2018 – that is the parallel data on which their analysis is based. You can read some of my criticism of Warne and Ayer at the popular climate blog WattsUpWithThat.com. I am grateful to Anthony Watts and Charles Rotter for republishing this series.
via Jennifer Marohasy
May 14, 2023 at 09:41PM
