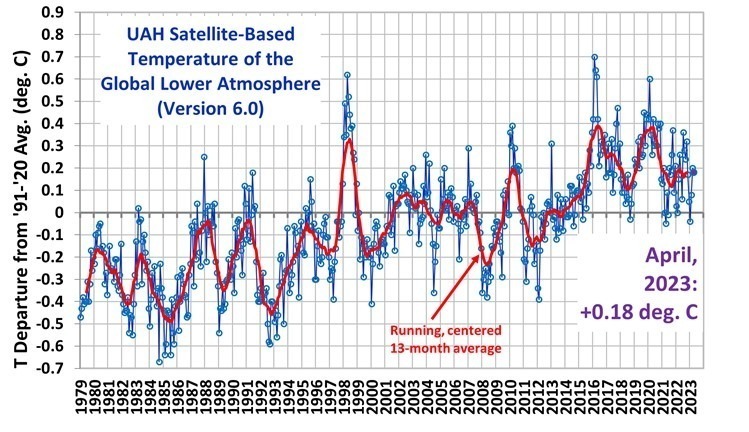
The Version 6 global average lower tropospheric temperature (LT) anomaly for April 2023 was +0.18 deg. C departure from the 1991-2020 mean. This is down slightly from the March 2023 anomaly of +0.20 deg. C.
The linear warming trend since January, 1979 remains at +0.13 C/decade (+0.11 C/decade over the global-averaged oceans, and +0.18 C/decade over global-averaged land).
Various regional LT departures from the 30-year (1991-2020) average for the last 16 months are:
YEAR
MO
GLOBE
NHEM.
SHEM.
TROPIC
USA48
ARCTIC
AUST
2022
Jan
+0.03
+0.06
-0.00
-0.23
-0.13
+0.68
+0.10
2022
Feb
-0.00
+0.01
-0.01
-0.24
-0.04
-0.30
-0.50
2022
Mar
+0.15
+0.27
+0.03
-0.07
+0.22
+0.74
+0.02
2022
Apr
+0.26
+0.35
+0.18
-0.04
-0.26
+0.45
+0.61
2022
May
+0.17
+0.25
+0.10
+0.01
+0.59
+0.23
+0.20
2022
Jun
+0.06
+0.08
+0.05
-0.36
+0.46
+0.33
+0.11
2022
Jul
+0.36
+0.37
+0.35
+0.13
+0.84
+0.55
+0.65
2022
Aug
+0.28
+0.31
+0.24
-0.03
+0.60
+0.50
-0.00
2022
Sep
+0.24
+0.43
+0.06
+0.03
+0.88
+0.69
-0.28
2022
Oct
+0.32
+0.43
+0.21
+0.04
+0.16
+0.93
+0.04
2022
Nov
+0.17
+0.21
+0.13
-0.16
-0.51
+0.51
-0.56
2022
Dec
+0.05
+0.13
-0.03
-0.35
-0.21
+0.80
-0.38
2023
Jan
-0.04
+0.05
-0.14
-0.38
+0.12
-0.12
-0.50
2023
Feb
+0.08
+0.17
0.00
-0.11
+0.68
-0.24
-0.12
2023
Mar
+0.20
+0.23
+0.16
-0.14
-1.44
+0.17
+0.40
2023
Apr
+0.18
+0.11
+0.25
-0.03
-0.38
+0.53
+0.21
The full UAH Global Temperature Report, along with the LT global gridpoint anomaly image for April, 2023 should be available within the next several days here.
The global and regional monthly anomalies for the various atmospheric layers we monitor should be available in the next few days at the following locations:
California, the state of my birth, childhood and my familiar stomping ground throughout my university years – just a year ago claiming itself engulfed by a millennial-scale mega-drought — is now worried about too much water:
Of course, because the topic is weather – which nearly everyone in California thinks equals Climate which equals Climate Change which equals Climate Crisis which equals Climate Catastrophe — this weather phenomenon must be a threat.
The latest version of this new threat is “The Big Melt” – cheerfully promoted and megaphoned by – well, nearly every news outlet in California and is echoed in the national press:
The plentiful rain that fell in California through the last few months have ended California’s long-term drought for now, but has also left the mountains covered in snow, tens of feet deep. In many places, twice the normal amount of snow with twice the normal amount of water equivalent. As that snow melts, the creeks and rivers will flow with far more water than usually seen. Reservoirs, many already being purposefully held at their desired maximum levels for this time of year, will receive more and more water – that water either has to either be retained in the reservoir, or released downstream to already saturated areas. The Oroville Reservoir barely escaped a major disaster when water levels were not lowered early and far enough in the spring of 2017.
The “Big Melt” is based on fears of the possibility of a very warm spring which could cause a rapid melt of the snowpack. This threat is being widely promoted by a Climate Feedback contributor Daniel Swain, a climate scientist at UCLA. [ A Google Search for “Daniel Swain and Big Melt” returns almost a million results. More on Swain here. ]
I am from California, born and raised there. The High Sierras were a huge part of my childhood: camping and hiking, six kids under 16 hiking (my brothers and three cousins and I) from Tuolumne Meadows in Yosemite south down the valleys on the John Muir trail and then up over Mt. Whitney to Lone Pine. [ Using this route ] The Yosemite Valley meadows which are covered with campgrounds and tourists in season are still wild and beautiful. But with the spring come floods and the California press was awash with news that “Most of Yosemite Valley will close starting Friday, April 28, at 10 pm, due to a forecast of flooding.” Flooding in the spring is perfectly normal for Yosemite Valley in the spring. And is fully expected, every single year.
How long has this been happening?
Since forever. But one of the best description of this magnificent natural phenomenon was written by John Muir himself – about the flood of December 1871, and was originally published in the June 1875 issue of The Overland Monthly and substantially revised as Chapter XI, “The River Floods,” in The Mountains of California (1894).
Yosemite Valley and the surrounding Sierras are magnificent and utterly priceless. John Muir was the prime mover in seeing that they were protected as a National Park. Tuolumne Meadows campground is currently closed through 2024/2025 for re-development. It regularly floods and campsites are washed away. Other Yosemite campgrounds, on the flat alpine meadows on each side of the Merced River, flood nearly every spring. Since 2007, the Merced at Pohono Bridge has exceeded flood stage more than a dozen times.
John Muir uses the term “the meadows”, but he is not referring to Tuolumne Meadows (circled in green at the right) but the meadows along the Merced River in Yosemite Valley (circled in yellow), downstream from Glacier Point.
The Yosemite Valley is a natural wonder – if you haven’t seen it, put it on your Bucket List. When my father was in his last years, I took him for one last look, driving from Los Angeles up through the deserts east of the Sierras and then west through into the Sierra at Tuolumne and then on down and through the loop in the Yosemite Valley.
Quit worrying about the weather and “Thanks for reading.”
This research suggests natural climate variation in Antarctica has a much wider range than expected.
– – –
The West Antarctic Ice Sheet is melting rapidly, claims EurekAlert, raising concerns it could cross a tipping point of irreversible retreat in the next few decades if global temperatures rise 1.5 to 2.0 degrees Celsius (2.7 to 3.8 degrees Fahrenheit) above pre-industrial levels.
New research finds that 6,000 years ago, the grounded edge of the ice sheet may have been as far as 250 kilometers (160 miles) inland from its current location, suggesting the ice retreated deep into the continent after the end of the last ice age and re-advanced before modern retreat began.
“In the last few thousand years before we started watching, ice in some parts of Antarctica retreated and re-advanced over a much larger area than we previously appreciated,” said Ryan Venturelli, a paleoglaciologist at Colorado School of Mines and lead author of the new study. “The ongoing retreat of Thwaites Glacier is much faster than we’ve ever seen before, but in the geologic record, we see the ice can recover.”
The study appears in AGU Advances, which publishes high-impact, open-access research and commentary across the Earth and space sciences. It presents the first geologic constraint for the ice sheet’s location and movement since the last ice age.
The grounding line is where a glacier or ice sheet leaves solid ground and begins to float on water as an ice shelf. Today, the Ross Ice Shelf extends hundreds of miles over the ocean from the grounding line of the West Antarctic Ice Sheet. Because ocean water washes up against the leading edge of the ice, the grounding line can be a zone of rapid melting.
“The concern of grounded ice loss is because the loss of ice on land is what contributes to sea level rise,” Venturelli said. “As grounding lines retreat farther inland, the more vulnerable the ice sheet becomes as it exposes thicker and thicker ice to the warming ocean.”
During the Last Glacial Maximum, about 20,000 years ago, the West Antarctic Ice Sheet was so large that it was grounded on the ocean floor, beyond the edge of the continent. Previous observations generally indicate a steady retreat since then, accelerated in the last century by human-caused climate change. [Talkshop comment – unsupported assertion].
. . .
The new evidence of Antarctic ice’s ability to make a comeback was welcome news for Venturelli.
“It can be a bummer sometimes, studying ice loss in Antarctica,” Venturelli said. “Although the re-advance identified in the geologic record happens over thousands of years, I like to think of studying the process of reversibility as a little shred of hope.”
The next big question for Venturelli and her coauthors is assessing what conditions enabled the ice’s re-advance.
One possibility is the rebound after release from the massive weight of the ice sheet lifted the land enough to hold back the ocean and allow the ice to regrow. Another possibility is that slight changes in climate enabled the ice sheet to switch from retreat to advance.
It could have been a combination of these influences.