
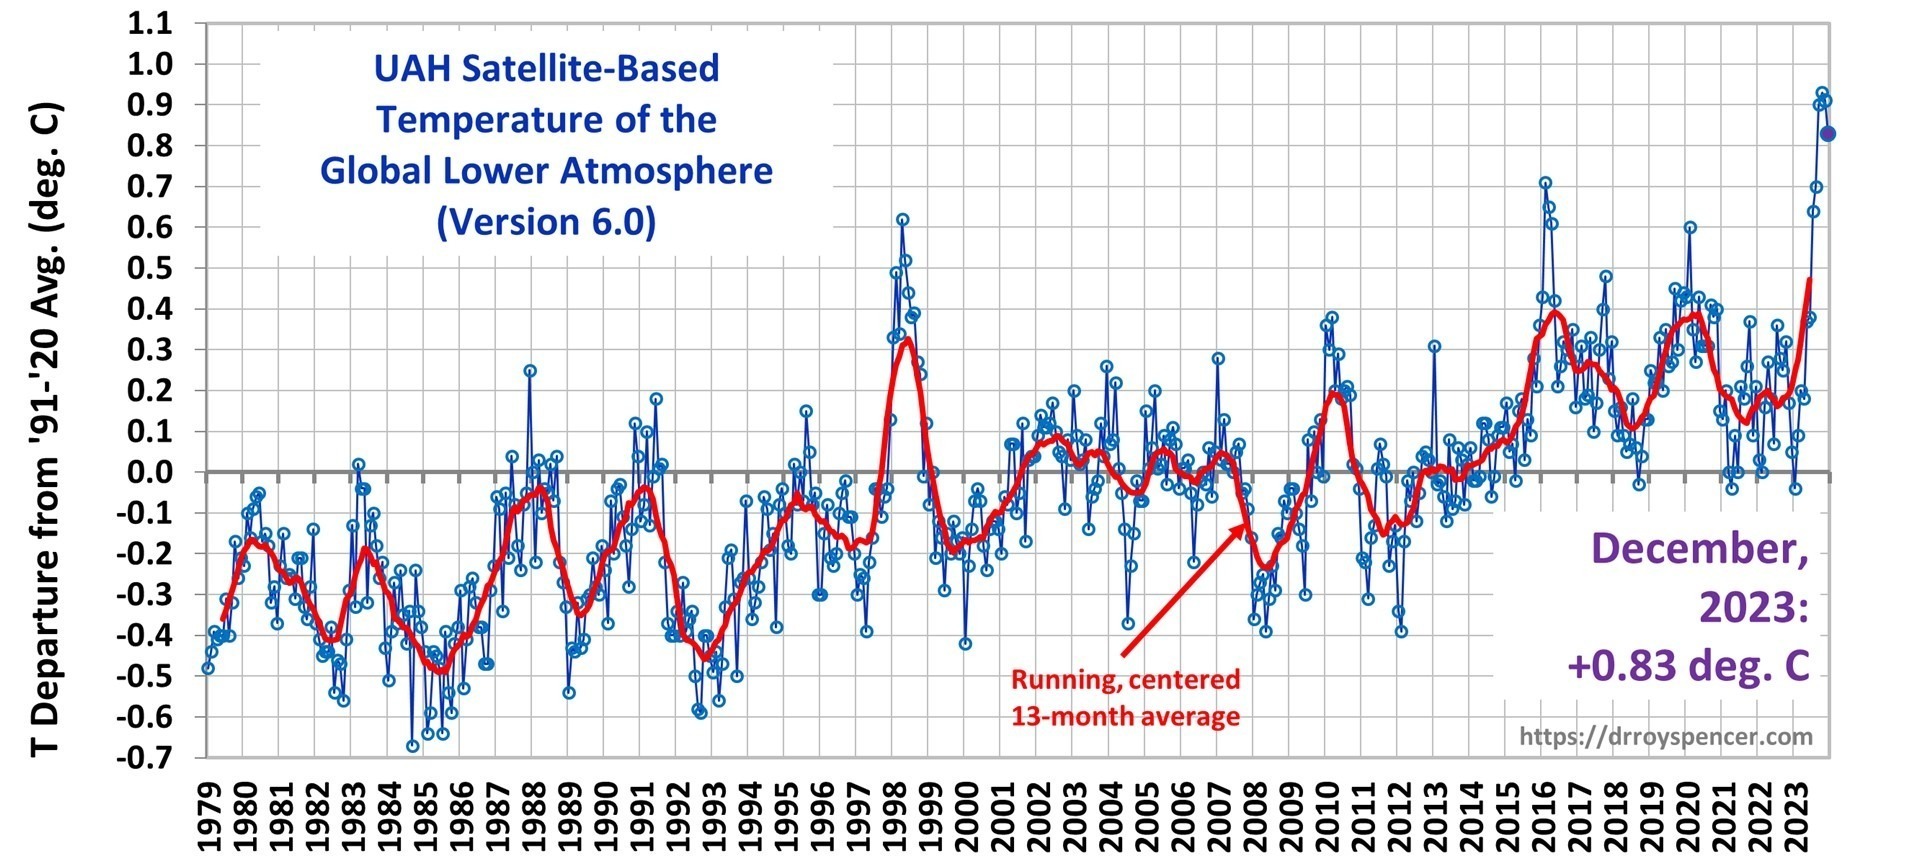
2023 Was the Warmest Year In the 45-Year Satellite Record
The Version 6 global average lower tropospheric temperature (LT) anomaly for December, 2023 was +0.83 deg. C departure from the 1991-2020 mean, down from the November, 2023 anomaly of +0.91 deg. C.
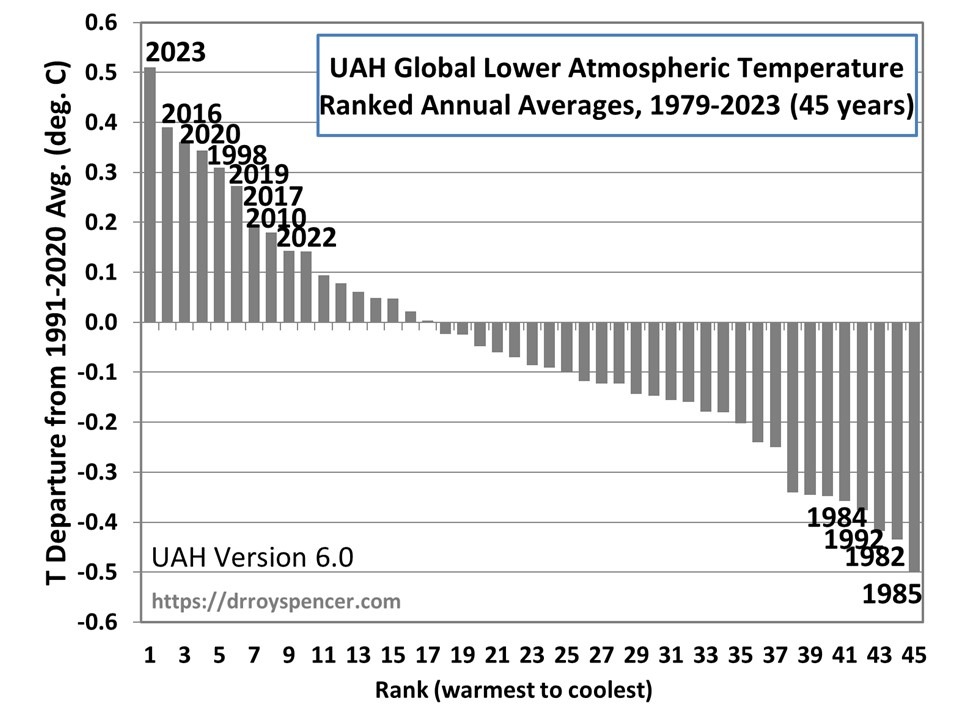
The 2023 annual average global LT anomaly was +0.51 deg. C above the 1991-2020 mean, easily making 2023 the warmest of the 45-year satellite record. The next-warmest year was +0.39 deg. C in 2016. The following plot shows all 45 years ranked from the warmest to coolest.
The linear warming trend since January, 1979 still stands at +0.14 C/decade (+0.12 C/decade over the global-averaged oceans, and +0.19 C/decade over global-averaged land).
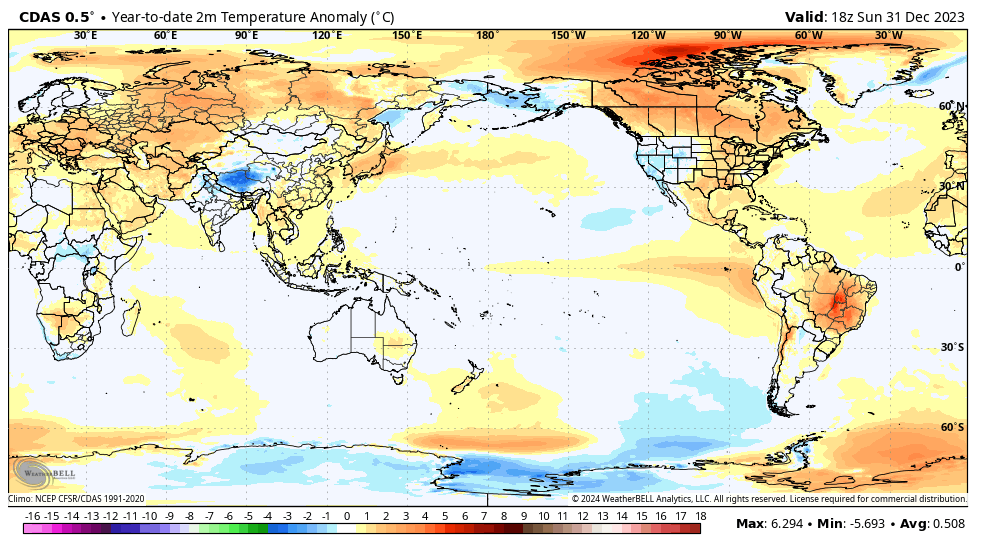
It might be partly coincidence, but the +0.51 deg. C number for 2023 from satellites is the same as the surface air temperature estimate from the NOAA/NCEP/NCAR Climate Data Assimilation System (CDAS). Note that the CDAS estimate is only partly based upon actual surface air temperature observations… it represents a physically consistent model-based estimate using a wide variety of data sources (surface observations, commercial aircraft, weather balloons, satellites, etc.):
Various regional LT departures from the 30-year (1991-2020) average for the last 24 months are:
| YEAR | MO | GLOBE | NHEM. | SHEM. | TROPIC | USA48 | ARCTIC | AUST |
| 2022 | Jan | +0.03 | +0.07 | +0.00 | -0.23 | -0.12 | +0.68 | +0.10 |
| 2022 | Feb | +0.00 | +0.02 | -0.01 | -0.24 | -0.04 | -0.30 | -0.49 |
| 2022 | Mar | +0.16 | +0.28 | +0.03 | -0.07 | +0.23 | +0.74 | +0.03 |
| 2022 | Apr | +0.27 | +0.35 | +0.18 | -0.04 | -0.25 | +0.45 | +0.61 |
| 2022 | May | +0.18 | +0.25 | +0.10 | +0.02 | +0.60 | +0.23 | +0.20 |
| 2022 | Jun | +0.07 | +0.08 | +0.05 | -0.36 | +0.47 | +0.33 | +0.11 |
| 2022 | Jul | +0.36 | +0.37 | +0.35 | +0.13 | +0.85 | +0.56 | +0.65 |
| 2022 | Aug | +0.28 | +0.32 | +0.25 | -0.03 | +0.60 | +0.51 | +0.00 |
| 2022 | Sep | +0.25 | +0.43 | +0.06 | +0.03 | +0.88 | +0.69 | -0.28 |
| 2022 | Oct | +0.32 | +0.44 | +0.21 | +0.05 | +0.17 | +0.94 | +0.05 |
| 2022 | Nov | +0.17 | +0.21 | +0.13 | -0.16 | -0.50 | +0.52 | -0.56 |
| 2022 | Dec | +0.05 | +0.13 | -0.02 | -0.34 | -0.20 | +0.80 | -0.38 |
| 2023 | Jan | -0.04 | +0.05 | -0.13 | -0.38 | +0.12 | -0.12 | -0.50 |
| 2023 | Feb | +0.09 | +0.17 | +0.00 | -0.10 | +0.68 | -0.24 | -0.11 |
| 2023 | Mar | +0.20 | +0.24 | +0.17 | -0.13 | -1.43 | +0.17 | +0.40 |
| 2023 | Apr | +0.18 | +0.11 | +0.26 | -0.03 | -0.37 | +0.53 | +0.21 |
| 2023 | May | +0.37 | +0.30 | +0.44 | +0.40 | +0.57 | +0.66 | -0.09 |
| 2023 | June | +0.38 | +0.47 | +0.29 | +0.55 | -0.35 | +0.45 | +0.07 |
| 2023 | July | +0.64 | +0.73 | +0.56 | +0.88 | +0.53 | +0.91 | +1.44 |
| 2023 | Aug | +0.70 | +0.88 | +0.51 | +0.86 | +0.94 | +1.54 | +1.25 |
| 2023 | Sep | +0.90 | +0.94 | +0.86 | +0.93 | +0.40 | +1.13 | +1.17 |
| 2023 | Oct | +0.93 | +1.02 | +0.83 | +1.00 | +0.99 | +0.92 | +0.63 |
| 2023 | Nov | +0.91 | +1.01 | +0.82 | +1.03 | +0.65 | +1.16 | +0.42 |
| 2023 | Dec | +0.83 | +0.93 | +0.73 | +1.08 | +1.26 | +0.26 | +0.85 |
The full UAH Global Temperature Report, along with the LT global gridpoint anomaly image for December, 2023, and a more detailed analysis by John Christy, should be available within the next several days here.
The monthly anomalies for various regions for the four deep layers we monitor from satellites will be available in the next several days:
Lower Troposphere:
http://vortex.nsstc.uah.edu/data/msu/v6.0/tlt/uahncdc_lt_6.0.txt
Mid-Troposphere:
http://vortex.nsstc.uah.edu/data/msu/v6.0/tmt/uahncdc_mt_6.0.txt
Tropopause:
http://vortex.nsstc.uah.edu/data/msu/v6.0/ttp/uahncdc_tp_6.0.txt
Lower Stratosphere:
http://vortex.nsstc.uah.edu/data/msu/v6.0/tls/uahncdc_ls_6.0.txt
The post UAH Global Temperature Update for December, 2023: +0.83 deg. C first appeared on Roy Spencer, PhD..
via Roy Spencer, PhD.
January 3, 2024 at 08:10AM
