We have seen over the last few days how the media has spotlighted the " betting scandal" in which a few Conservative Party candidates and officials have placed bets on the timing of the election. But at the same time some people have been uncovering a much more worrying scandal, that the UK Met Office have been using low standard weather stations to claim record temperatures in the UK. The difference is that the media has not focused on this scandal at all. They have simply ignored it.
Far be it from me to give advice to the Green Party. From their insistence that ordinary people put up with being poorer and colder to ‘save the planet’ to the alarmingly high number of Israelophobic, 7 October-denying cranks on their candidates list, I’m really not a fan. Still, I’d gently suggest that the golden rule for any Green vying for election is to practise what you preach on climate. If you are standing on a manifesto of national immiseration, you’d better be willing to go without the fossil-fuelled comforts you want to rip away from everyone else.
The Greens co–leader has been caught out as an eco-hypocrite
Not so for Carla Denyer, it seems. The Greens’ co–leader (apparently running a party with one MP is too much work for one person) has been caught out as an eco-hypocrite. Denyer has admitted to ITV, as part of its party-leader interviews series, that she still has a gas boiler. She is ‘in the process of getting quotes for replacing it with an air-source heat pump’, natch, but Rishi Sunak’s snap poll scuppered her plans. ‘I’ve had to put that on pause during the general election as you can imagine, but I, yeah, literally have quotes in my email inbox’, she said.
This would perhaps be more convincing if heat pumps had only come to market this year, or were a relatively minor part of plans for ‘decarbonisation’. In reality, they’ve been at the heart of the discussion, given domestic heating accounts for about 14 per cent of UK emissions and the government has been throwing money at people to install them for years.
Despite this, uptake remains much slower than hoped and the Tories’ plan to ban new gas boilers by 2035 is so unpopular even the Labour party has just pledged to scrap it. No one will ‘be forced to rip out their boiler’, shadow energy secretary Ed Miliband told the Daily Telegraph last week. Given Labour is almost certainly going to win this election, I guess that’s one fewer incentive for Denyer to finally get her act together.
She’s hardly alone in failing to live her life as she expects the rest of us to live ours. ‘Do as I say, not as I do’ has been greens’ unspoken mantra for years. From Prince Harry taking private jets after lecturing others on climate change to Sadiq Khan presiding over Ultra-low emission zones while taking a three-car convoy to walk his dog to Extinction Rebellion co-founder Gail Bradbrook driving a diesel when she’s not flying off to Costa Rica, eco-hypocrisy appears to be a feature – not a bug – of elite environmentalism.
You can’t help but conclude that green austerity is just for the plebs. Even paid-up Greens are bristling at the expense and privations they claim to support. Indeed, forcing people to pay more for poorer outcomes is at the heart of the Net Zero mania. Heat pumps are a great example. They can cost anywhere between £10,000 and £15,000 to install, compared to £2,000 to £4,000 for a new gas boiler; they can cost more to run; and they aren’t particularly effective at heating your home – unless you’ve got even more cash to splash on insulation and other expensive adjustments. No wonder Denyer was putting it off.
This is the fundamental flaw of greenism – the reason it only appeals to a privileged few. It wants to rip up the unwritten contract between government and the governed. Where politicians once pledged to make life that bit easier, cheaper and more convenient for ordinary folk, now they are offering us higher bills, colder homes, fewer foreign holidays and expecting us to be happy about it. Deep down, no one – not even the co-leader of the Greens, it seems – wants to live like that.
We’ve all heard the question. We point out there is no evidence that current climate changes, whether man-made or natural, are dangerous or unusual. Then we are asked, but “What about sea level rise? Isn’t that dangerous?” There are many very good technical arguments why the current rate of sea level rise will not threaten humans, New York City, Miami, or Tuvalu. These are urban legends that spawn from silly IPCC models as explained by Ole Humlum in Chapter 10 of our latest book (Crok & May, 2023). How are these myths dismissed quickly in clear language? This is my best attempt in ~600 words. Let me know how I did.
The current rate of global sea level rise is below the accuracy of our current ability to measure it as discussed in Kip Hansen’s Chapter 5 in Crok & May. Figure 1 shows three respected estimated rates. The sea levels are shown as reported and they have different zero points. The Jevrejeva, et al. estimate in blue is 2 mm/year (± ~0.3), the one below that is the Church and White estimate of 1.7 (± ~0.3) mm/year. These estimates are both from tide gauges, although the Jevrejeva estimate does try and include the satellite data from 1993 to 2009. Due to the overlap of the author’s estimates of uncertainty, the two estimates are statistically equivalent.
Figure 1. Three respected estimates of the rate of sea level rise in mm/year. Sources: (Jevrejeva, Moore, Grinsted, Matthews, & Spada, 2014), (Church & White, 2006), and (Beckley, Callahan, Hancock, Mitchum, & Ray, 2017). Jevrejeva, 2014 only discusses their reconstruction through 2009, so they do not include the sudden rise in 2010 shown in their dataset.
The lower estimate, shown in gray, uses all the NASA satellite data since 1993. It shows a rate of 3.3 mm/year (Beckley, Callahan, Hancock, Mitchum, & Ray, 2017). The satellite record is too short to be meaningful, we need at least 60 more years of data before we can derive a meaningful rate from satellites. The satellite data only covers the upward part of a ~60-year cycle or oscillation that began in 1991.
Global mean sea level has been rising for the past 170 years, but the rate is cyclical. The cycle shows up prominently in Figure 1 from about 1930 to 1991 in the Jevrejeva et al. reconstruction. It is also seen, albeit in a more subdued fashion, in the Church and White reconstruction. Thus, any estimate of the rate of rise based on a reconstruction (satellite or tide gauge or combined) that is shorter than 90-120 years is erroneous. Sea level fell during the Little Ice Age until about 1861 when it began to rise.
All the rates (since 1900) are projected to 2100 in the upper left box and show sea level rises between 5 and 10 inches by 2100. These increases are much less than the average daily tidal range of over one meter. Such a small rise in 76 years is unlikely to be noticed. It should be noted here that sea level is not the same in all oceans as one might expect. In Panama, sea level is 20 cm (~8 inches) higher on the Pacific side of the country than on the Atlantic/Caribbean side, this is about the global sea level rise expected between now and 2100. Even more important, the tidal range on the Pacific side is much larger than on the Caribbean side.
Measuring global mean sea level is made extraordinarily difficult by the changes in mean sea level from ocean to ocean and the related changes in the daily tidal range. Jevrejeva points out that tide gauges are confined to continental and island margins and most of them are in the Northern Hemisphere, the tide gauge records don’t all cover the same time period, and they are attached to land that sometimes rises and falls itself. Jevrejeva points out that it is not easy to combine the various records into a single global sea level curve.
In a like fashion, any estimate of acceleration in the rate with any of this data, or any combination of it, is little more than a guess. Polynomial fits to all these series can show some acceleration, but the fit to the polynomials is statistically no different than a linear fit to the same data.
As many of my regular readers know, I often throw ideas out there for comment. I want to know what the best arguments against my ideas are. Or did I miss a better argument? So positive or negative, give me your best shot. Am I right, or wrong? Is there a better argument than what I’ve offered?
Works Cited
Beckley, B. D., Callahan, P. S., Hancock, D. W., Mitchum, G. T., & Ray, R. D. (2017). On the “cal-mode” correction to TOPEX satellite altimetry and its effect on the global mean sea level time series. Journal of Geophysical Research: Oceans, 122, 8371–8384. doi:10.1002/2017JC013090
Church, J. A., & White, N. J. (2006). A 20th century acceleration in global sea-level rise. Geophys. Res. Lett., 33. doi:10.1029/2005GL024826
Crok, M., & May, A. (2023). The Frozen Climate Views of the IPCC, An Analysis of AR6. Andy May Petrophysicist LLC.
Jevrejeva, Moore, J., Grinsted, A., Matthews, A., & Spada, G. (2014). Trends and acceleration in global and regional sea levels since 1807. Global and Planetary Change, 113, 11-22. doi:10.1016/j.gloplacha.2013.12.004
Modeling the main factors driving climate is riddled with and precluded by observational error. Some scientists now acknowledge this.
Clouds are a main factor – even the “most important factor” – controlling changes in the Earth’s radiation budget, or climate (Sfîcă et al., 2021, Lenaerts et al., 2020).
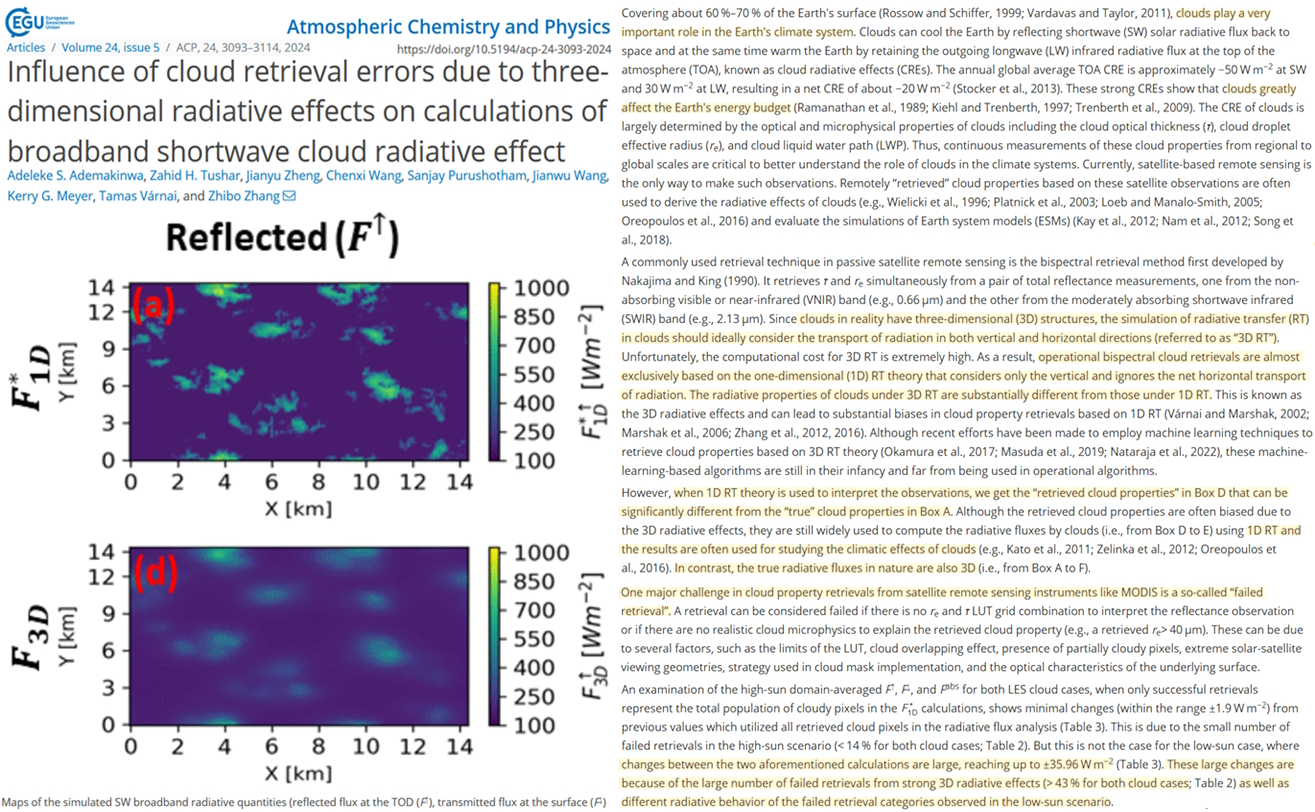
But as scientists acknowledge in a new study (Ademakinwa et al., 2024), substantial errors in calculating cloud effects on climate are inevitable because three-dimensional (3D, vertical and horizontal) cloud affects are reality, and current calculations only consider one-dimensional cloud properties (1D, vertical).
“Failed retrievals” in radiative property simulations of cloud effects occur over 40% of the time. This leads to biases, errors amounting to ±36 W/m².
Considering this error margin of 72 W/m² is 360 times larger than the total forcing from CO2 over the span of 10 years (0.2 W/m²) for an imaginary clear-sky-only (cloudless) Earth (Feldman et al., 2015), it is not possible to detect the real-world effect of CO2 forcing in any radiative transfer calculation.
Summary:
“Since clouds in reality have three-dimensional (3D) structures, the simulation of radiative transfer (RT) in clouds should ideally consider the transport of radiation in both vertical and horizontal directions (referred to as ‘3D RT’).”
However, “operational bispectral cloud retrievals are almost exclusively based on the one-dimensional (1D) RT theory that considers only the vertical and ignores the net horizontal transport of radiation.”
Consequently, “the radiative properties of clouds under 3D RT are substantially different from those under 1D RT.”