Month: June 2024

Acknowledging the Sun at Solstice, and Maybe Even the Wind

I am planning to go scuba diving this weekend across the bay from Yeppoon, to see how the corals are faring at Great Keppel Island – after the very significant coral bleaching this last summer.   I shall be wearing a thicker wetsuit than I was in April, because daily mean temperatures have dropped by about 5C since April and about 10C since January.  (Remember my series of posts from back then, CLICK HERE.)

This chart was created at, and downloaded from, the AIMS (Australian Institute of Marine Science) website, and is copied here with thanks.

Winter days tends to be sunny here, yet still they are relatively cold.   (In Yeppoon, most of the rain falls in summer, and the days tend to be cloudier, yet warmer.)

I write this with a smile because of late many sceptics have been promoting the idea that ‘clouds control the climate’ – as explained in the new movie ‘Climate, the Movie’ produced by Martin Durkin starring John Clauser.   That clouds ‘control’ the climate is as much nonsense as carbon dioxide controls the climate – or that Greta Thunberg is responsible for the IPCC, that was actually the brainchild of Margaret Thatcher.  (For so many of my colleagues to continue to promote this silly movie that begins with Greta Thunberg repeating what she was taught at school, is just plain lazy.)

Clouds are important negative feedback, but they do not create the seasons or even past Ice Ages.  Clouds do not control the climate. (And just because a Nobel Laureate says otherwise does not make it true.  I could cry, but I am choosing to smile.)

It is getting significantly colder here in Yeppoon, where I am across the bay from Great Keppel Island, that is just about on the Tropic of Capricorn.   It is getting cold because the Southern Hemisphere is facing away from the Sun at this time of year, and this inclination way from the Sun has almost reached a maximum – well it will at the end of the week here in Yeppoon, on winter solstice.

A schematic representation of the Earth’s axial tilt, that creates the seasons. Copied from https://ift.tt/iW27Aq0 , with thanks.

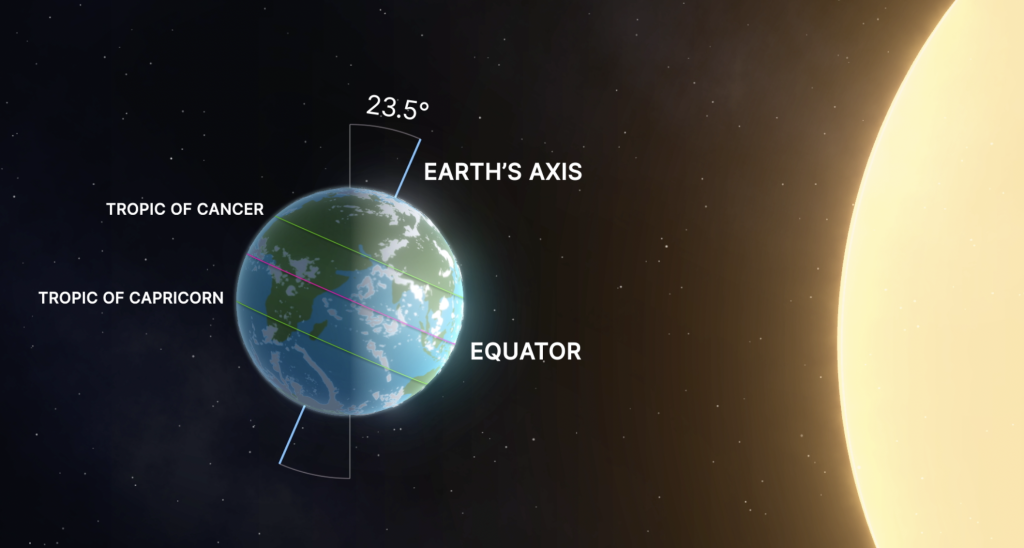
To be sure, the seasons result from the inclination of the Earth’s axis to the plane of its orbit and the corresponding variation in the amount of solar radiation received will depend on latitude and varies over the year.

The Earth’s atmosphere causes this effect of the seasons to lag somewhat, so it is going to get colder here even as we move back towards the Sun next week, after winter solstice.

The great re-distributor of the ever-changing amount of solar radiation received at the surface of the Earth is not the clouds, but rather the wind.  The winds transport heat and moisture and drive the ocean currents and are at once the operating mechanism and the working substance of climate.

******

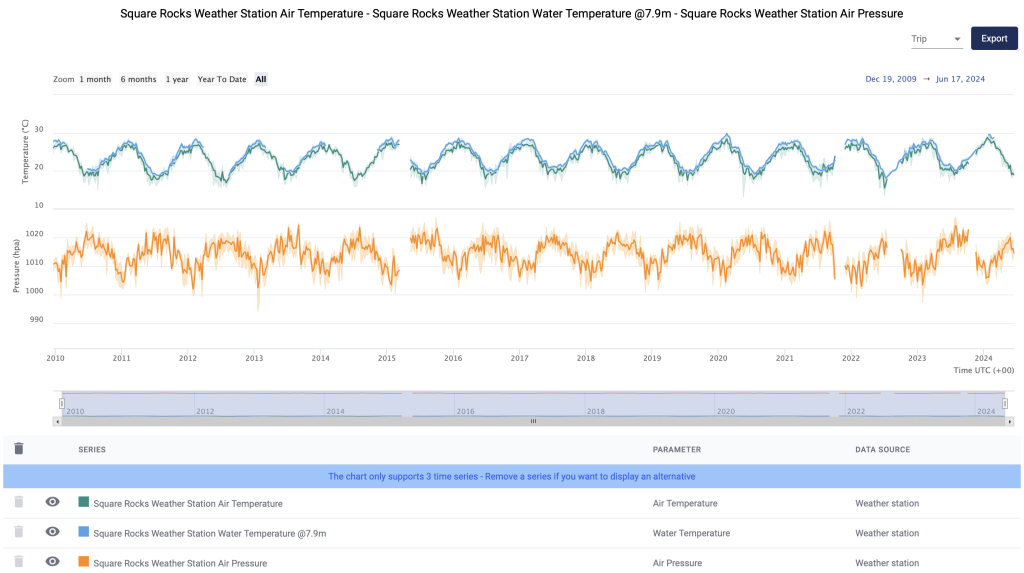
I am planning to write more about the wind, and so I have included atmospheric pressure in the chart (top of this blog post) that shows how the air and water temperatures vary with the seasons and also the wind; the bigger the difference between the pressures, the faster the air will move from the high to the low pressure and the stronger the wind.  This chart was created at, and downloaded from, the AIMS (Australian Institute of Marine Science) website, and is copied here with much thanks.

The feature image shows me in the water at Secret Cove, Great Keppel Island in April.

via Jennifer Marohasy

https://ift.tt/0ykd8Ih

June 17, 2024 at 07:19PM

EV TRANSITION IS SLOWING DOWN

The price decline has been dramatic over the past year. In June 2023, average used EV prices were over 25% higher than used gas car prices, but by May, used EVs were on average 8% lower than the average price for a used gasoline-powered car in U.S. In dollar terms, the gap widened from $265 in February to $2,657 in May, according to an analysis of 2.2 million one to five year-old used cars conducted by iSeeCars. Over the past year, gasoline-powered used vehicle prices have declined between 3-7%, while electric vehicle prices have decreased 30-39%. 

Read it in full here: Not the Transition they expected: People paying thousands more for second hand petrol car rather than equivalent used EV « JoNova (joannenova.com.au)

via climate science

https://ift.tt/1pEdoBa

June 17, 2024 at 05:52PM

NOAA’s Updated 2024 Global Average Temperature Anomaly Trend Continues to Decline Indicating a Weaking El Nino and No “Climate Emergency”

Guest Essay by Larry Hamlin

NOAA has updated its Global Time Series Average Temperature Anomaly data through May 2024 with the results clearly indicating that the year 2023/2024 El Nino event continues to weaken as demonstrated by the data presented and discussed below.

The NOAA data presented below uses a graph display interval of a 30-year period from January 1995 through May 2024 to allow greater visibility of the monthly changes occurring during this most recent climate data interval.

The NOAA Global Land and Ocean average temperature anomaly data is shown below with both graph and table formats.

The NOAA Global Land and Ocean average temperature anomaly through May 2024 has further declined from the November 2023 peak EL Nino value of 1.43 degrees C to 1.18 degrees C (338th out of 353 measured values) with this outcome also being below the April 2024 result of 1.30 degrees C (345th of 353 measured values) indicating this most recent El Nino event continues to weaken.

The NOAA Global Land updated average temperature anomaly data is shown below in both graph and table format.

The Global Land average temperature anomaly through May 2024 has further declined from the prior February 2016 El Nino peak value of 2.53 degrees C (the highest ever measured NOAA Global Land anomaly value) to 1.63 degrees C (316th out of 353 measured values) with this outcome also below the April 2024 result of 1.93 degrees C (336th out of 353 measured values) clearly showing that this most recent El Nino event continues to weaken.

This latest NOAA Global Land average temperature anomaly data continues to confirm that Earth’s 8+ billion people (that reside on land) have experienced declining Global average temperature anomaly outcomes since the February 2016 El Nino peak value (that occurred over 8 years ago) indicating that humanity is not in a climate crisis.

This outcome establishes that climate alarmist hype claiming that the Earth is facing a “climate emergency” is unsupported by NOAA’s Global Land average temperature anomaly measured data as presented above in NOAA’s graph and table data values.

There are many other NOAA Global region average temperature anomaly measured data results that also establish that peak measured Global region average temperature anomaly values occurred years ago.

 NOAA’s updated Northern Hemisphere Land average temperature anomaly measured data is shown below in both graph and table format.      

NOAA’s data for the Northern Hemisphere Land region has a peak average temperature anomaly value that occurred in February 2016 at 3.17 degrees C (during the prior El Nino event) with the latest May 2024 anomaly value measured far below the prior peak value at 1.79 degrees C (293rd highest value of 353 measured values) which is also below the April 2024 measurement value of 2.49 degrees C (344th highest value of 353 measured values).

 NOAA’s updated region measurement data for the average temperature anomaly for Asia is shown below in both graph and table formats.

NOAA’s data shows that the May 2024 average temperature anomaly value of 1.57 degrees C (242nd of 353 measured values) is far below the Asia region peak average temperature anomaly value of 4.11 degrees C measured in February 2020. as well as the April 2024 value of 2.65 degrees C (331st of 353 measured values).

NOAA’s updated average temperature anomaly for the Oceania region measured data is shown below in both graph and table formats.

NOAA’s data shows that the May 2024 average temperature anomaly value of 1.29 degrees C (303rd out of 353 measured values) is well below the Oceania peak average temperature anomaly result of 2.21 degrees C in December 2019.  

NOAA’s updated average temperature anomaly data for the East N. Pacific region measured outcomes are shown below in both graph and table format.

NOAA’s data shows that the May 2024 average temperature anomaly value of 0.80 degrees C (271st out of 353 measured values) is well below the peak East N Pacific average temperature anomaly result of 1.79 degrees C in October 2015.

NOAA’s updated average temperature anomaly data for the Hawaiian region measured outcomes are shown below in both graph and table format.

NOAA’s data shows that the May 2024 average temperature anomaly value of 0.37 degrees C (172nd out of 353 measured values) is well below the Hawaiian region peak average temperature anomaly result of 1.76 degrees C in September 2015.

NOAA’s updated average temperature anomaly data for the Arctic region measured outcomes are shown below in both graph and table format.

NOAA’s data shows that the May 2024 average temperature anomaly value of 1.79 degrees C (224th out of 353 measured values) is well below the Arctic region peak average temperature anomaly result of 5.00 degrees C in January 2016 as well as below the April 2024 value of 2.57 degrees C (287th out of 353 measured values).

 NOAA’s updated average temperature anomaly data for the Antarctic region measured values are shown below in both graph and table format.

NOAA’s data shows that the May 2024 average temperature anomaly value of 0.55 degrees C (265th out of 353 measured values) is well below the Antarctic peak average temperature anomaly result of 2.25 degrees C in August of 1996 nearly 3 decades ago.

Additionally, NOAA’s updated USCRN (a state-of-the-art accurate surface temperature network free of localized heat biases addressed here) Maximum Temperature Anomaly data for the Contiguous U.S. through May 2024 (shown below) demonstrates there is no established upward temperature anomaly trend since at least the year 2005.

Furthermore, the peak May maximum temperature anomaly in the U.S. occurred in May 1934 at 5.66 degrees F versus 1.22 degrees F in May 2024 (highlighted in red) as shown above.

The latest NOAA Global Times Series average temperature anomaly data (updated through May 2024) as well as NOAA’s latest USCRN Contiguous U.S. anomaly data (also updated through May 2024) do not support and in fact contradict climate alarmists flawed claims that the Earth is experiencing a climate emergency.  

via Watts Up With That?

https://ift.tt/F7ezAuh

June 17, 2024 at 04:02PM

Not the Transition they expected: People paying thousands more for second hand petrol car rather than equivalent used EV

EV Electric Vehicle.

By Jo Nova

The cost problem is solved (for all the wrong reasons), but it’s still not enough

Around the world, governments are trying to force people to buy electric vehicles because they are nice people who are worried about polar bears. And since drivers out there all believe in climate change, according to all the pollsters, it shouldn’t be a big ask. (Who wouldn’t want to save the Earth?)

Supposedly, just 10 years from now, they told us, we wouldn’t be able to buy a new combustion engine car at all.  Instead, not only are sales of new EV slowing rapidly, to the point where there is a glut, but as prices fall for used cars customers are not rushing out to pick up the cheaper second hand EVs either.

Look at how fast the turnaround in this market has been in the last year — a 25% price premium– gone:

Kaya Ginsky, CNBC

The difference between the price of a used Tesla Model 3 and BMW 3 Series shows how a “premium” associated with EVs in the initial boom has been erased, according to an analysis from iSeeCars.

The decline has been dramatic over the past year. In June 2023, average used EV prices were over 25% higher than used gas car prices, but by May, used EVs were on average 8% lower than the average price for a used gasoline-powered car in U.S. In dollar terms, the gap widened from $265 in February to $2,657 in May, according to an analysis of 2.2 million one to five year-old used cars conducted by iSeeCars. Over the past year, gasoline-powered used vehicle prices have declined between 3-7%, while electric vehicle prices have decreased 30-39%. 

And all leading indicators are down. Fewer people have plans to buy an EV, and the pool of people who won’t even consider buying one is growing:

A Gallup poll of Americans in April found ownership of EVs increasing by 3% annually, but an equal percentage decline in consumers who indicated serious interest in buying an EV, down from 12% to 9%. Overall, 35% of Americans said they might consider buying an EV in the future, down from 43% last year.

In Germany, the formerly great industrial empire, EV sales are down 30% compared to this time last year, but sales of petrol engines are up 2% and diesel cars are up 3%.

Pierre Gosselin at NoTricksZone tells us the German Federal Motor Transport Authority (KBA) reports a 30.6% fall in registration of new electric cars compared to May a year ago.

CO2 emissions of new German cars also rose 3.3%…indicating the green transition has stalled and is reversing.

Hat-tip: Blackout News

The KBA also adds that 89,498 passenger cars were equipped with a gasoline engine – an increase of 2.1 percent compared to the same month last year.

44,893 new cars were diesel-powered, an increase of 3.2 percent compared to the same month last year.

History books will be written about the crazy political EV bubble.


0 out of 10 based on 0 rating

via JoNova

https://ift.tt/5GqKhD6

June 17, 2024 at 02:16PM