Month: June 2024

Four Corners: Wind Farms are Devastating Community Cohesion in Rural Australia

Claimed threats of violence, abusive phone calls, former friends not speaking anymore, allegations of greed – welcome to the Aussie green energy revolution.

The video is available to view here.

The Four Corners video provides some additional context to a recent WUWT story, with a video interview of the people pictured in the story below.

My biggest objection to the four corners program is the introduction, which falsely claims wind energy is necessary to meet Australia’s Net Zero goals.

This is nonsense. France successfully decarbonised much of their economy using nuclear power, and still still derives just under 70% of their electricity from zero carbon nuclear.

Having said that nuclear energy would likely also be divisive, though the land footprint required to supply all of Australia’s needs with nuclear energy would be a lot smaller than an equivalent renewable installation.

The program poured scorn on claims that offshore wind harms whales. But there is plenty of evidence to suggest the whale killing claim is true.

The program dubiously claims nuclear is “double” the cost of an equivalent renewable energy system, but this claim appears to ignore the unaffordable cost of battery backup.

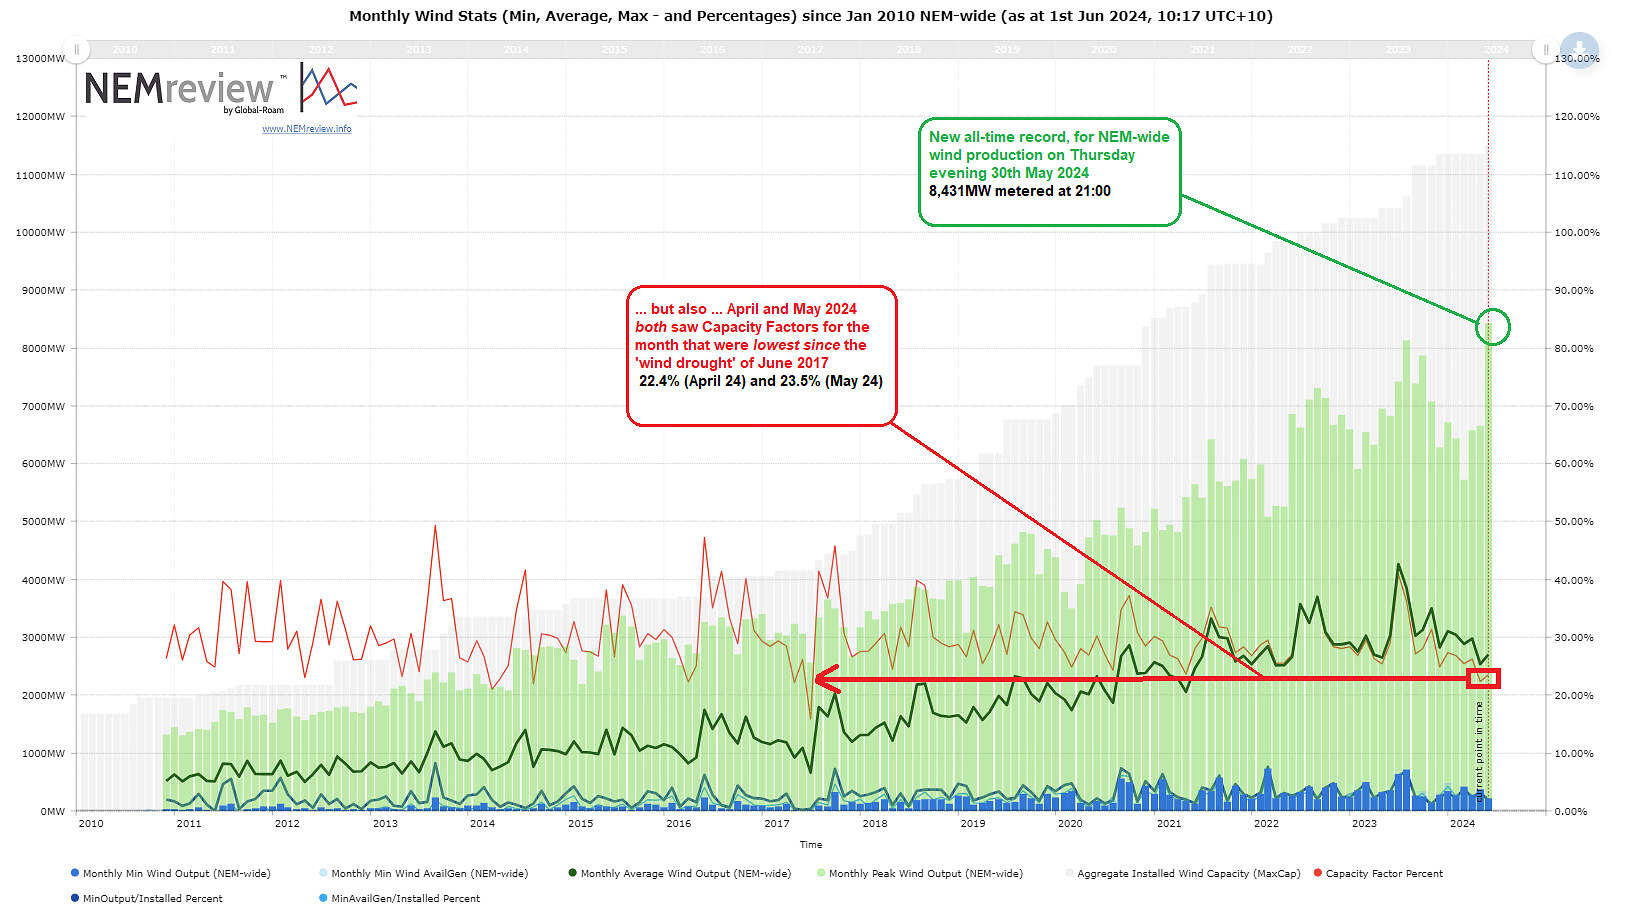
As WUWT has frequently pointed out, wind droughts can affect the entire continent of Australia, so weeks, possibly months of battery backup would be required to smooth out these failures, along with significant overcapacity to charge the batteries during good times.

Lets do a little math.

In 2022, Australia used 273,265 GWh of electricity or (divide by 52 weeks per year) 5255 GWh per week.

Obviously this would vary by season, during very cold weeks people would use a lot more home heating. But let’s keep it simple.

Batteries currently cost around AU $1200 / kWh.

5255 GWh x 1000000 = 5255000000 kWh of electricity.

5255000000 x $1200 per kilowatt hour = $6,306,000,000,000 – $6.3 trillion dollars

Even if you get a bargain basement discount cost for your batteries, say an 80% discount on the household kilowatt cost, that is still a very serious sum of money. There are battery technologies which might bring that cost down significantly, I’ve seen claims of $40 – $80 / kWh for sodium ion batteries. A $40 / kWH battery would reduce that cost from $6.3 trillion to $200 billion. But betting $200 – $400 billion ($40 – $80 / kWh) on a very recent technology commercialisation would be quite a gamble.

Let’s also not forget these batteries also have to be regularly replaced – especially if the batteries are abused, say by draining them heavily during continent wide renewable energy failures.

The alternative to battery backup is fossil fuel backup, but this is a very expensive solution – this requires keeping enough gas turbines or coal plants or whatever on standby to completely replace renewable energy when renewable energy output collapses.

Australia has a gigantic pumped hydro project, the Snowy 2 pumped hydro project, which is supposed to provide a “big battery”, but every time I look at that project the estimated cost has gone up by another billion. Is that Snowy 2 tunnel digger still stuck in the dirt? And there are serious questions about the throughput efficiency of the system, how much electricity will be lost charging and discharging the pumped hydro system.

Oops I forgot something – aren’t we supposed to electrify everything, replace all our gasoline vehicles and gas cookers with electricity? How much would this additional electrification capacity add to my estimated costs?

In my opinion, despite an effort to give air time to both sides of the debate (learn BBC), the apparent biases in this Four Corners episode are disappointing.

I grew up watching Four Corners, a hallmark of Four Corners episodes was a genuine attempt to be objective. WUWT has praised previous Four Corners episodes, such as their excellent recent expose of alleged carbon credit fraud.

The failure of this Four Corners episode “Inside the communities fighting against renewable energy | Four Corners” to mention battery backup costs when comparing renewables to nuclear, the quick dismissal of claimed impacts on whales from offshore wind turbines, no mention of the impact of onshore wind turbines on bird life, and a failure to provide proper estimates of renewable costs which include the cost of battery backup, all this in my opinion falls far beneath the usual standards we Aussies have come to expect from Four Corners.

via Watts Up With That?

https://ift.tt/6aKc7Qf

June 14, 2024 at 04:13PM

On a bad day $20 billion in wind power across Australia can only guarantee as much power as two diesel generators

By Jo Nova

How much back-up do we need for our 11.5 gigawatt wind system? About 11.4 gigawatts.

Wind energy failed on Thursday at what must be close to a record low — with barely 88MW of production from 11,500MW of wind turbines. That’s about 0.7% of total nameplate capacity.

With construction costs running at $2 million for every theoretical megawatt of turbine, that’s $20 billion dollars of machinery sitting out there in the fields and forests of Australia producing about as much as two diesel generators.

We have 84 industrial wind plants across 5 states of Australia, and the green band below was their total contribution to our national electricity needs on Thursday — put your reading glasses on.

Things were even worse in Western Australia, where at the one point that afternoon when I happened to look the state’s total wind generation was minus 11MW. Some wind turbines were drawing a megawatt here and there, perhaps to keep the turbines rolling so they don’t get flat spots on bearings.

It was an attack of another climate-denying high pressure cell on Thursday. There was no place in Australia good for wind generation except (maybe) for our research stations in Antarctica.

Again, this is now a feature of our electricity grid, until the government can stop these high pressure cells or conquer New Zealand and build a bridge.


But sadly, there is no “building” our way out of this. One thousand more wind-plants won’t keep many lights on, and $100 billion dollars of interconnectors will not connect us to wind power if there is a high pressure cell 5,000 kilometers wide, which there is every two or three weeks.

Wind power went from producing 7.2GW in the early hours of Wednesday to 0.09GW by lunchtime Thursday.  It was sheer luck it bottomed out at lunchtime on a sunny day when solar panels were at their peak. Seven gigawatts of power disappeared in just 36 hours. If we lost 7 gigawatts of coal plants in a week, we’d never hear the end of it.

It’s the minimums that matter

Paul McArdle at WattClarity has all the grid data, and provides an amazing graph of the system-wide peaks and troughs of our wind generators over the last 13 years which he has updated recently to highlight how bad the months of April and May were for wind production in Australia. Click to enlarge this graph to really appreciate the devastating message. While the total wind farm “capacity” has grown massively (the grey columns on the graph), the minimum lowest guaranteed production has not shifted much at all. This is the generation we can rely on, the minimum monthly points are marked in dark green at the bottom.

Ten years ago the lowest monthly minimum was practically zero (reaching just 3.7MW one day in July 2014). But since then we’ve built 8,000 MW of extra wind power, at an effective cost of $16 billion, and only bought ourselves effectively two diesel generators worth of reliable electricity?

Lowest monthly wind power performance and capacity in Australia

Source: WattClarity

If someone asks how much wind can we rely on, the answer is “about one percent”.

h/t Apoxonbothyourhouses

0 out of 10 based on 0 rating

via JoNova

https://ift.tt/k19zIwK

June 14, 2024 at 04:05PM

Wind Power Variability in the UK

About two and a half years ago, I penned, or typed, “Randomly blows the wind.” In that story I reporting on a paper by Drew et al predicting the power frequency of a future wind farm fleet, based on historical data for the UK’s wind field. The results were not promising for a country planning to put all its chips on renewables. So much for models.

Then, six weeks or so ago, Paul Homewood reported on a dataset summarising the last five years’ worth of wind generation. He was kind enough to send me a copy: I was interested in whether, over the five years from 2019 to 2023, variability in supply had changed.

Several factors impinge on this question. For example, the widening distribution of wind farms (it is said) will contribute to stabilising outputs, since far-flung sites will be experiencing somewhat different weather. Meanwhile, acting in the other direction, greater capacity overall means that measures of dispersion like standard deviation will go up, with no change to the fundamentals. In other words, the same swing as a percentage of output results in a greater swing in absolute output.

The paper I reported on back then talked about several properties of the wind fleet, namely:

  1. Power frequency distribution, as mentioned
  2. Power ramps, both up and down
  3. Lulls and their duration.

So, with access to some actual output data, what do we find?

Power frequency distribution

In my note of 2021, I remarked that the power frequency distribution of the modelled future wind fleet strongly resembled a random uniform distribution, where no output has a higher chance of occurring than any other. This was a slight exaggeration, but the curve was very flat (see figure below). It was not, by any stretch, a normal curve, say centered around 35% capacity. Instead, it was horrifying, bad enough to instantly disqualify the idea of relying on wind power.

Adulterated figure from Drew et al 2015. Go to “Randomly Blows the Wind” for link.

So, what about the real-world data? We now have five years of real power frequency output. Here’s how the years 2019-2023 looked for wind-generated leccy in the UK (x scale is capacity factor):

This set of histograms show that the situation is bad, and (to judge by the way the distribution seems to be getting squashed) seems to be worsening. On the plus side it looks as if higher capacities are more frequent in later years. And indeed, the maximum output of the wind fleet goes up by year (remembering that the offshore capacity of higher nominal turbines with higher theoretical efficiencies also goes up each year). But while the maximum output inexorably rises, the mean does not.

Year Max output, proportion Min output, proportion Mean output, proportion
2019 0.703 0.0155 0.279
2020 0.708 0.0135 0.317
2021 0.724 0.0130 0.276
2022 0.763 0.0135 0.322
2023 0.767 0.0087 0.316

Swings

What about ramps, or the swinginess of wind? This is a vital question, because a sudden lull creates the necessity of a rapid grid response (as does a sudden ramp up in output). The next figure shows the frequency of power changes (MW) for each year. The mode is 0, as you might expect (the next half hour’s output is similar to the current half hour’s). However, swings of 500 MW within half an hour are not at all uncommon in all years. There is a suggestion that the histograms get flatter and wider year by year, showing an increase in swinginess. Note that this is not unexpected, because the same swing as a proportion results in a greater swing in absolute power output as the overall nominal power goes up year on year. It does though counter the idea that more dispersed wind farms might lead to greater stability.

The histograms are clipped – the actual min and max swings within 30 minutes are “off the chart.”

Year Max downswing in 30 mins (MW) Max upswing in 30 mins (MW)
2019 -1929 +2193
2020 -1285 +1533
2021 -2999 +1969
2022 -1462 +1702
2023 -2289 +2451

The biggest swing in the series was in 2021, when c. 3 GW went AWOL between one half hour and the next.

Lulls

For this part of the analysis, I must thank my son Dan, who wrote and executed the code to calculate the frequency and duration of lulls in the data set. The next figure is a histogram of lull durations across the full five years. Here, as in the paper I reported on in 2021, the definition of a lull is <10% capacity. As you can see, there are a large number of short lulls, plus a few of long duration. A lull of 250 half hours is 125 hours is c. 5 days. There were two lulls of this length over the five years.

Those lulls are going to prove deadly for a government hoping to power the UK with (ugh) “clean” energy. I described a battery storage system in Assault and Batteries which retails at £75 million and stores 196 MWh. The back of my envelope says that to store and supply 10% of the existing wind nominal output for five days would take nearly 1,600 of those giant batteries, and the cost of building them would be north of £100 billion. And remember that the figure above shows output below 10% for 5 days: that 10% you’ve put in storage only gets you up to less than 20% output. And when you need the power… how much are those batteries going to charge you for it, knowing that any price is better than a blackout?

Conclusion

The variability shown in this dataset should kill off any pretense that wind power can achieve anything for the UK other than long-term decline. Not all electricity is equal. The electricity that comes when you want it, where you want it, trumps the kind that comes and goes as it pleases.

via Climate Scepticism

https://ift.tt/kL2IZgN

June 14, 2024 at 02:06PM

New Zealand Dumps Plan To Tax Cow Burps, Farts


A change of government has brought a bit of sense back to net zero obsession and overreach, but the general idea is still alive.
– – –
New Zealand is scrapping a scheme to price gas emissions from livestock — squelching a so-called burp-and-fart tax initiated under the previous left-wing government led by now departed authoritarian Prime Minister Jacinda Ardern, says Climate Change Dispatch.

New legislation will be introduced to parliament this month by the ruling conservative coalition to remove the agriculture sector from a new emissions pricing plan, thus responding to farmer pressure that the plan would make their business unprofitable.

“The government is committed to meeting our climate change obligations without shutting down Kiwi farms,” said Agriculture Minister Todd McClay.

“It doesn’t make sense to send jobs and production overseas, while less carbon-efficient countries produce the food the world needs.”

The New Zealand economy is driven by agriculture with around 10 million cattle and 25 million sheep roaming the nation’s pastures.

Full article here.
– – –
Image: NZ cow sculpture [credit: Prosperosity @ Wikipedia]

via Tallbloke’s Talkshop

https://ift.tt/P4O2c67

June 14, 2024 at 01:32PM