
Net zero, according to the figures from the IPCC will cost the world a quadrillion dollars (that’s a one followed by twelve zeros) and cool it by almost 0.3 degrees Celsius. Read about it here:
via climate science
June 13, 2024 at 05:31PM
Net zero, according to the figures from the IPCC will cost the world a quadrillion dollars (that’s a one followed by twelve zeros) and cool it by almost 0.3 degrees Celsius. Read about it here:
via climate science
June 13, 2024 at 05:31PM
It has long been understood that atmospheric pressure is one of the primary determinants of a planet’s temperature, with higher pressure (for example, Venus at 92 bar) yielding warmer climates due the increase in heat capacity with mass (Chemke et al., 2016, Chemke et al., 2017), and lower pressures (Mars at 0.006 bar, Earth at 1.0 bar) yielding cooler climates (Goldblatt et al., 2009, Sorokhtin et al., 2007).
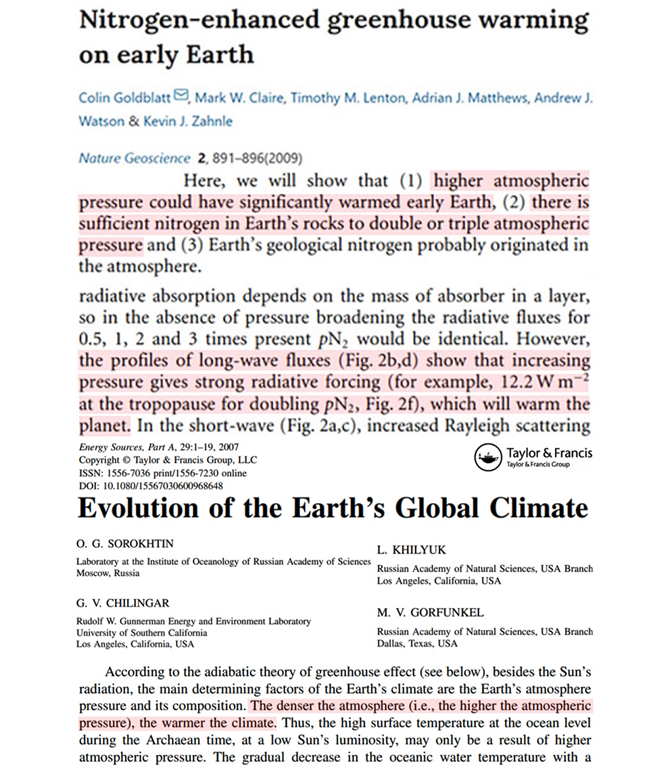
What we know about the requisite physics for the aerodynamics of flight (e.g., how heavy is too heavy for lift-off) serves as a robust proxy for atmospheric pressure variations of the ancient past.
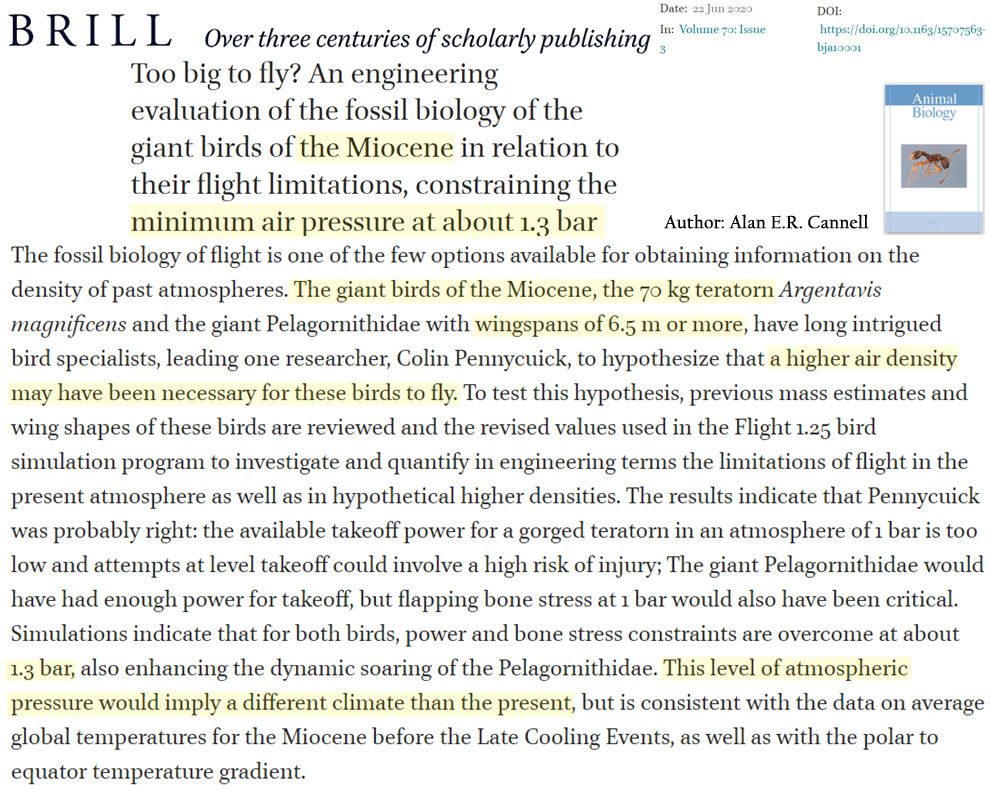
For instance, the “giant birds of the Miocene,” with wingspans of “6.5 m or more,” could not take flight with today’s air densities (Cannell, 2020). Knowing what we know about flight physics, a minimum air pressure of 1.3 bar “would have been necessary for these birds to fly.”
Using known size and flight physics for large-winged predators, scientists have concluded the Late Permian and Middle to Late Jurrassic may have had atmospheric pressures of over 2 bar (Cannell and Nel, 2023). This could explain the polar warmth allowing for an Antarctic rainforest near the South Pole ~90 million years ago (Klages et al., 2020).
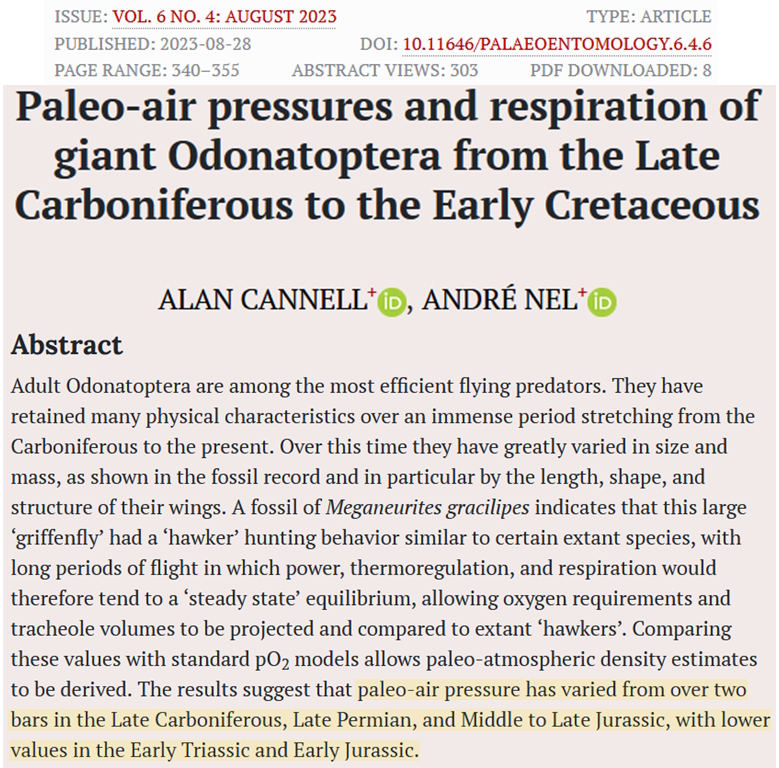
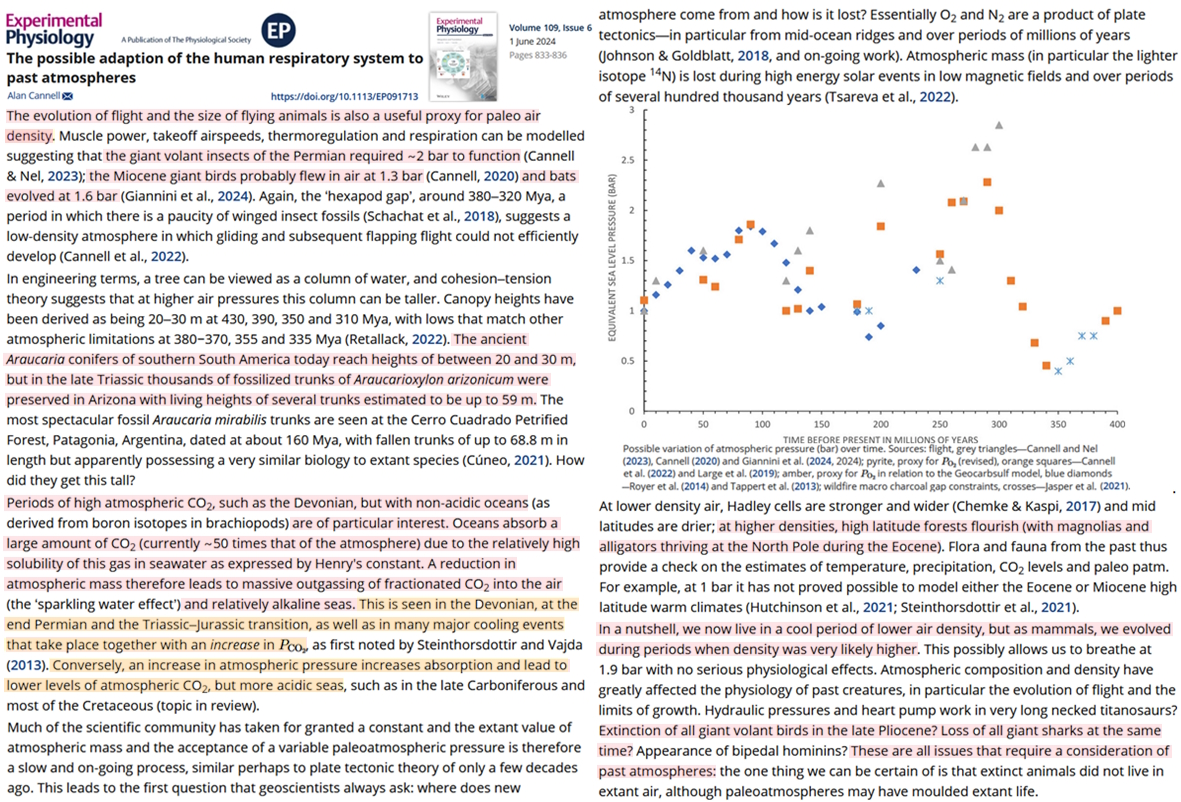
Image Source: Cannell and Nel, 2023
A new study provides a visual for just how much pressure may have varied in the past, ranging from 0.5 bar ~350 Ma to ~2.5 bar 300 Ma, and then almost 2.0 bar ~100 Ma, or during the time of the dinosaurs. (See the chart provided.)
As mentioned, one salient effect of atmospheric pressure variations is the size of animal and plant species, with higher pressures and greater warmth yielding 60-70 m tall trees, giant wing-extended (volant) insects and birds, alligators and magnolias thriving at the North Pole during the Eocene (~50 Ma), etc.
An interesting section of the paper suggests that not only does a planet’s atmospheric pressure determine the global temperature and the size of its creatures, it also may determine atmospheric CO2 levels and how alkaline or acidic the oceans get.
As noted in another recent paper, global temperatures and atmospheric CO2 are significantly negatively correlated (r = -0.76) over the last 210 million years (Davis, 2023). Likewise, high CO2 levels are associated with cooling periods like the End Permian extinction event, but not with ocean acidification periods. This strongly suggests atmospheric CO2 levels are not the determinant of the oceans’ pH balance nor global temperature – as we are led to believe.
“Periods of high atmospheric CO2, such as the Devonian, but with non-acidic oceans…are of particular interest. Oceans absorb a large amount of CO2 (currently ~50 times that of the atmosphere) due to the relatively high solubility of this gas in seawater, as expressed by Henry’s constant. A reduction in atmospheric mass therefore leads to massive outgassing of fractionated CO2 into the air and relatively alkaline seas. This is seen in the Devonian, at the end Permian and the Triassic-Jurassic transition, as well as in many major cooling events that take place together with an increase in CO2. Conversely, an increase in atmospheric pressure increases absorption and leads to lower levels of atmospheric CO2, but more acidic seas.”
via NoTricksZone
June 13, 2024 at 05:17PM
By Javier Vinós
Part I in this series on the Sun and climate described how we know that the Sun has been responsible for some of the major climate changes that have occurred over the past 11,000 years. In Part II, we considered a range of changes that the Sun is causing in the climate today, including changes in the planet’s rotation and in the polar vortex that are changing the frequency of cold winters.
None of the evidence for the Sun’s effect on climate we reviewed is included in the IPCC reports. The role of the IPCC is to assess the risk of human-induced climate change, not to find the causes of climate change, which since its inception has been assumed to be due to our emissions.
Nevertheless, some scientists continue to try to explain the Sun’s effect on climate and have developed three different explanations. These three theories are not mutually exclusive. The fact that one is true does not mean that the others are false.
The first theory is based on the direct effect on climate of changes in solar radiation. Because the effect is proportional to the cause, we say it is linear.
This theory has been defended by Dr. Soon, Prof. Scafetta and 35 other scientists in a recent paper.[i] To explain the Sun’s effect on climate, these scientists make their own temperature reconstruction, based on rural stations to avoid the urban heat effect, and their own reconstruction of solar activity over the last two centuries. Figure 1 left shows their reconstruction compared to the one accepted by the IPCC on the right. The differences between the two would explain a much larger effect of the Sun on climate than that accepted by the IPCC.
Figure 1. Left graph shows in black a temperature reconstruction using only rural stations from four regions in NOAA’s GHCN dataset, and in orange a high variability solar series. Right graph shows in black a temperature reconstruction with urban and rural stations and in orange an IPCC’s AR6 recommended solar series (from Soon et al. 2023).
In the second theory, it is cosmic rays that change the climate, and the Sun’s magnetic field regulates the number of cosmic rays that reach the Earth. It is therefore an indirect effect, but also a linear one, since the change in cosmic rays would be proportional to the activity of the Sun.
This theory, proposed by Dr. Svensmark, is based on the fact that cosmic rays create ions in the atmosphere that act as cloud seeds.[ii] Part of the theory has been confirmed by experiments in a particle accelerator, but it is not yet known whether the effect is significant enough. One problem is that cosmic rays have increased while satellites show a decrease in the low cloud layer, which may actually contribute to the observed warming.
Figure 2. Percentage cloud cover anomaly (black) from EUMETSAT CM SAF dataset. Cosmic ray data (red) from the Oulu neutron monitor database.
The third theory is the one I have proposed.[iii] In it, the Sun acts indirectly on the climate, and its effect is non-linear because other factors are involved. Non-linear means that the effect is not proportional to the cause. This explains why there is no direct correlation between the Sun and surface temperatures, although the Sun’s effect is important. What is this process, capable of changing the climate in a natural way, that scientists have not properly accounted for? It is heat transport.
Figure 3. Three main types of solar theories based on the direct or indirect effect of different components of solar variability. Less developed hypotheses based on solar particles and solar wind have also been proposed.
What is heat transport?
Most of the Sun’s energy reaches the Earth in the tropics, creating a zone of excess energy that receives more energy than it emits, shown in red in Figure 4. Outside the tropics, there are two energy deficit zones, which receive less energy than they emit and whose size depends on the seasons. They are shown in blue in Figure 4, which presents the situation during winter in the Northern Hemisphere. These imbalances should result in continuous warming in the red zone and continuous cooling in the blue zones. That this does not happen is due to the transport of heat, which also transports moisture and clouds, and is very important for the climate. The climate of any region depends on insolation and the transport of heat and moisture.

Figure 4. Actual graphic of the mean top of the atmosphere net radiation by latitude for December-February, showing positive values in red and negative values in blue, placed in a cartoon showing the Earth’s tilt with respect to the Sun. The direction of heat and moisture transport is shown with purple arrows.
Heat transport is a particularly difficult climate process to study and some scientists who research it believe current theories do not satisfactorily describe it.[iv] The seasonal variation in heat transport is very important. Because of the tilt of the planet’s axis, much more heat is transported in the winter than in the summer.
In the first chapter of the 6th Assessment Report, the IPCC provides a clear explanation of climate change, defining its causes as follows: “The natural and anthropogenic factors responsible for climate change are known today as radiative ‘drivers’ or ‘forcers’. The net change in the energy budget at the top of the atmosphere, resulting from a change in one or more such drivers, is termed ‘radiative forcing’.” According to the IPCC, heat transport is not considered a radiative forcing and, therefore, not a cause of global climate change. Its effects only contribute to internal or regional variability. This perspective is reflected in the limited attention given to heat transport in the IPCC reports. In the massive 2,391-page 6th Assessment Report, heat transport is only briefly mentioned in a 5-page subsection on ocean heat content.[v] In this subsection, we learn that climate change is due to heat addition, while changes in ocean circulation cause heat redistribution.
To the IPCC, variations in heat transport have not contributed to recent climate change because they only redistribute heat within the climate system, while recent climate change is due to heat being added to the system. Therefore, heat transport cannot cause global climate change, only regional changes.
Figure 5. The first objection to changes in heat transport being a cause of climate change is incorrect because the greenhouse effect is very uneven, so emissivity is altered by poleward heat transport.
Is this true? Actually, it is not. It is rarely mentioned, but 75% of the Earth’s greenhouse effect is due to water vapor and water clouds.[vi] And their distribution by latitude is extremely uneven. The tropical atmosphere contains a lot of water, and the polar atmosphere in winter contains almost none. Therefore, the greenhouse effect in the polar regions is extremely small, and the transport of heat from the tropics to the Arctic changes the emissions. This means that the total is not constant, so heat transport has the ability to change the global climate through changes in water vapor and cloud distributions.
In the 1960s, Jacob Bjerknes stated that if the top of the atmosphere fluxes and oceanic heat storage remained relatively stable, the total heat transported through the climate system would also remain constant. This implies that changes in atmospheric or oceanic transport should be compensated by changes of the same magnitude and opposite sign in the other one. This Bjerknes compensation has not been empirically demonstrated but is present in all models despite its physical basis being unknown.[vii] If the compensation is true it should result in transport being constant and, thus, not a cause for climate change.
Figure 6. The second objection to changes in heat transport being a cause of climate change is incorrect because heat transport to the Arctic does not show the expected compensation.
But again, reality is different. Heat transport can increase in the atmosphere and also in the ocean, changing the amount of energy transported. In fact, this is logical because an important part of ocean transport is in surface currents driven by wind, which is also responsible for heat transport through the atmosphere. If the wind increases, the transport in both compartments should increase.
Figure 7. Upper graph, tropospheric winter latent energy transport across 70°N by planetary scale waves (Rydsaa et al., 2021). Lower graph ocean heat transport to the Arctic and Nordic Seas in Terawatts (Tsubouchi et al. 2021).
This is also supported by data from two studies of Arctic heat transport in recent decades.[viii] Both atmospheric and oceanic heat transport increased in the early 21st century. In the Arctic, winter temperatures have risen sharply. Obviously, that heat has to be transported there, because the Sun does not shine in the Arctic in winter, so no heat is generated. And the increase in temperature has greatly increased the emission of infrared radiation into space. Remember that the greenhouse effect is very weak in the Arctic at this time of year, and heat is not retained. Because of the warming of the Arctic caused by increased transport, the planet is losing more energy than it was losing before.

Figure 8. Upper graph, Arctic winter temperature anomaly. Data from Danish Meteorological Institute. Lower graph, 5-year November-April average outgoing longwave radiation anomaly at 70-90°N top of the atmosphere from NOAA data (black) and solar activity (sunspots, red) with a decadal Gaussian smoothing (thick line).
So, what has caused this warming of the Arctic in the 21st century? CO₂ has been rising sharply since the 1950s and its effects on radiation are instantaneous, they do not take 50 years. There’s also talk of it being a consequence of the warming that’s been going on since the mid-1970s, but why should it take two decades for the heat to reach the Arctic? We have the Sun. Arctic warming and increased outgoing radiation coincide in time with the decline in solar activity that began in the mid-1990s with solar cycle 23, which, as we have seen, was accompanied by a weakening of the polar vortex.
How do we know that the change in solar activity caused the change in transport and the warming of the Arctic? Because it has been doing so for thousands of years. A study by leading scientists looked at the relationship between solar activity and Greenland’s temperature and found that over the past 4,000 years, solar activity has been inversely correlated with Greenland’s temperature.[ix] When solar activity decreased, Greenland warmed, as it is doing now. It also says that there have been periods in those 4,000 years when Greenland was warmer than it is now, which is inconsistent with being caused by our emissions.
The signal from the Sun is received in the stratospheric ozone layer, which absorbs much of the ultraviolet radiation. This is a very sensitive receiver because UV radiation changes 30 times more than total radiation (3%). But in addition, the increase in UV radiation creates more ozone, which also increases by 3%. With more ozone and more UV radiation, the ozone layer experiences a temperature increase of 1°C with solar activity, which is much more than at the surface.
The ozone response to changes in solar activity modifies the temperature and pressure gradients, and this causes the speed of the zonal winds in the stratosphere to change, as we saw earlier. When the activity is high, the gradients become larger and this causes the wind speed to increase, and when the activity is low, the gradients become smaller and the wind speed decreases. In the troposphere, atmospheric waves called planetary waves are generated, and when the wind is weak, they reach the stratosphere and hit the polar vortex, weakening it. But when the wind is strong, they do not manage to enter the stratosphere and the vortex remains strong. Changes in the vortex are transmitted to the troposphere, altering atmospheric circulation and heat transport.
Figure 9. Cartoon showing the mechanism by which solar activity regulates planetary wave activity in the stratosphere and the polar vortex strength and, through it, winter atmospheric circulation and heat transport toward the Arctic.
Planetary waves are atmospheric waves of the Rossby type. The largest storms on the planet fit into their undulations and have a huge impact on meteorology. They are responsible for some of the most extreme atmospheric phenomena, such as the heat waves in Europe in 2003 and in Russia in 2010, and the floods in Pakistan in 2010, in China in 2012, and in Europe in 2013. The amount of energy they move is staggering. Planetary waves are the largest of all, and under certain conditions can reach the stratosphere, hitting the polar vortex and weakening it.
Fifty years ago, a scientist suggested that if the Sun had an effect on climate, planetary waves were a possible candidate for the mechanism.[x] But no one investigated this possibility, and the paper was forgotten.
A 2011 study finally proved him right, showing that planetary waves in the Northern Hemisphere respond to the solar cycle.[xi] Figure 10 shows the sunspot cycle in red and the amplitude of the planetary waves in black. We observe large oscillations from one year to another because the mechanism is not exclusive to the Sun and there are other causes that affect it. This is the difficulty of studying non-linear phenomena. But the effect of the solar cycle is clear, because the highest amplitudes occur in periods of low solar activity.
Figure 10. Planetary wave amplitude index based on the averaged amplitude of wavenumbers 1–3 averaged over 55–75°N in 70–20 hPa (black, from Powell & Xu, 2011). Annual sunspot index (red, from SILSO). Purple circles indicate high wave amplitude years that coincide with low solar activity.
The effect this has on the polar vortex was discussed in Part II and is shown in Figure 11. More active solar cycles, with fewer planetary waves, have faster zonal winds and stronger vortices, while during less active solar cycles the increase in planetary waves weakens the vortex.
Figure 11. Monthly sunspot number (red), cumulative anomaly of zonal wind speed at 54.4°N, 10 hPa (blue, Lu et al. 2008), and the mean vortex geopotential height anomaly at 20 hPa (purple, NCEP, Christiansen 2010).
We have already mentioned the effect this has on the frequency of cold winters in the Northern Hemisphere, but how does this mechanism explain the change in global climate?
My theory is that when solar activity is high, the zonal winds are strengthened, preventing the planetary waves from entering the stratosphere and allowing the vortex to remain strong throughout the winter. By acting as a wall, the vortex reduces heat transport to the Arctic in winter, and this causes temperatures to drop, reducing the infrared emissions to space that allow heat to escape from the Earth. All of these steps have been verified by scientists. The result is that by reducing emissions, the planet conserves more energy, which can cause it to get warmer. This is the situation that occurred from the mid-1970s to the late 1990s, when the planet experienced strong warming under high solar activity.
Figure 12. Climate-changing mechanism through changes in heat transport as a result of high solar activity.
When solar activity is low, the zonal winds subside, allowing planetary waves to enter the stratosphere and hit the vortex, weakening it. As the wall weakens, heat transport to the Arctic increases, causing it to warm. This warming increases emissions to space, causing the planet to conserve less energy. The result is that the planet either warms more slowly or cools, depending on other factors. Because this mechanism regulates the amount of heat that enters the Arctic in winter, I have named my theory “The Winter Gatekeeper”.
Figure 13. Climate-changing mechanism through changes in heat transport as a result of low solar activity.
It is important to note that this is not a solar theory, although it does explain the Sun’s effect on climate. Variations in heat transport are a general cause of climate change. Perhaps the most important one. Any factor that persistently changes the amount of heat transported becomes a cause of climate change, and this includes plate tectonics and orbital variations. This theory has the ability to explain the ice age of the last 34 million years, and the growth and shrinkage of the ice sheets in glaciations and interglacials.[xii] The explanations it provides fit the evidence better than the CO₂ changes.
The solar mechanism I propose has the following features:
This theory explains many of the problems that the Sun’s effect on climate has always had:
Figure 14. The solar part of the Winter Gatekeeper theory provides an explanation for several questions and solar-climate related phenomena, some of them not properly explained before.
The Sun has a lot to say about future climate, but we are not listening. Long-term changes in solar activity are cyclical, and what adds to warming now will subtract from it in the future. This theory does not deny that changes in CO₂ affect climate, and indeed it is based on differences in emissions due to changes in the greenhouse effect, just not in time, but in space, with latitude. But it is undeniable that if the Sun has played a relevant role in the warming of the 20th century, it reduces the role our emissions have played.
This article can also be watched in a 19-minute video with English and French subtitles.
References
[i] Soon, W., et al., 2023. The detection and attribution of northern hemisphere land surface warming (1850–2018) in terms of human and natural factors: Challenges of inadequate data. Climate, 11 (9), p.179.
[ii] Svensmark, H., 1998. Influence of cosmic rays on Earth’s climate. Physical Review Letters, 81 (22), p.5027.
[iii] Vinós, J., 2022. Climate of the Past, Present and Future. A scientific debate. Critical Science Press. Madrid.
[iv] Barry, L., et al., 2002. Poleward heat transport by the atmospheric heat engine. Nature, 415 (6873), pp.774-777.
[v] Fox-Kemper, B., et al., 2021. Climate Change 2021: The Physical Science Basis. 6th AR IPCC. Ch. 9 Ocean, Cryosphere and Sea Level Change. pp.1228–1233.
[vi] Schmidt, G.A., et al., 2010. Attribution of the present‐day total greenhouse effect. Journal of Geophysical Research: Atmospheres, 115 (D20).
[vii] Outten, S., et al., 2018. Bjerknes compensation in the CMIP5 climate models. Journal of Climate, 31 (21), pp.8745-8760.
[viii] Rydsaa, J.H., et al., 2021. Changes in atmospheric latent energy transport into the Arctic: Planetary versus synoptic scales. Quarterly Journal of the Royal Meteorological Society, 147 (737), pp.2281-2292. Tsubouchi, T., et al., 2021. Increased ocean heat transport into the Nordic Seas and Arctic Ocean over the period 1993–2016. Nature Climate Change, 11 (1), pp.21-26.
[ix] Kobashi, T., et al., 2015. Modern solar maximum forced late twentieth century Greenland cooling. Geophysical Research Letters, 42 (14), pp.5992-5999.
[x] Hines, C.O., 1974. A possible mechanism for the production of sun-weather correlations. Journal of the Atmospheric Sciences, 31 (2), pp.589-591.
[xi] Powell Jr, A.M. and Xu, J., 2011. Possible solar forcing of interannual and decadal stratospheric planetary wave variability in the Northern Hemisphere: An observational study. Journal of Atmospheric and Solar-Terrestrial Physics, 73 (7-8), pp.825-838.
[xii] Vinós, J. 2023. Solving the Climate Puzzle. The Sun’s surprising role. Critical Science Press. Madrid.
via Watts Up With That?
June 13, 2024 at 04:10PM
Oh dear, here I go again, with another shot across the bows of the BBC. However, I can’t deny that I am continually irritated by a supposedly impartial and trusted news organisation continually pushing a partial narrative. BBC Verify will be rolled out unfailingly to criticise and fact-check narratives of which the BBC disapproves, but there is no danger of any critical faculties being engaged when it comes to stories that bolster the narrative. And so it proves with today’s headline that got me hot under the collar: “Liquid air energy storage plant to create 700 jobs”. What’s wrong with that, if it’s true, I hear you say?
The problem is that it’s at best only partially true. Read the article and you find this: “Mr Butland said the jobs created would include construction, supply chain and staff.” Thus, in my contention, the headline is misleading, since it carries with it the implication that the jobs are new permanent jobs, whereas the detail makes it clear this isn’t the case, since some of the jobs are temporary. What the BBC doesn’t make clear, even within the body of the article, is how many of the 700 jobs referred to in the title really are being created (i.e. are new jobs with a degree of permanence). It seems nobody at the BBC is interested in reading beyond the press release, for we receive no further enlightenment. And make no mistake – this is a story generated by a press release. In the last 24 hours slight variations of the story can be found at numerous websites online, and the original can be found at Highview Power’s own website. Interestingly, perhaps, Highview’s own article is significantly more candid and informative than the BBC’s, making it clear that the 700 jobs referred to are all in the construction phase: “Construction will begin on the site immediately, with the facility operational in early 2026, supporting over 700 jobs in construction and the supply chain.”
OK, so the BBC’s headline isn’t particularly accurate. What of it? It’s not so spectacularly misleading as to justify Crabby of Cumbria being so upset about it. Perhaps not, but as part of an ongoing series of misinformation on the part of the BBC, I believe it deserves calling out. Maybe I would have let it go if the rest of the article met high journalistic standards, but I don’t believe it does. What does it say?
Well, the meat of the article, despite stating that at least some of the jobs “created” are construction and supply jobs, goes on to repeat the false claim in the headline. Internal consistency is entirely lacking. Compare the BBC’s version (“The facility at Carrington near Manchester, designed by Highview Power, will create more than 700 jobs in the north-west of England, the firm said”) with what Highview actually said (my emphasis): “supporting over 700 jobs in construction and the supply chain”. In reality there is a big difference between those two statements. Is it a deliberate error on the part of the BBC, bigging-up the jobs-creating capacity of net zero, or is it simply sloppy work on the part of a journalist and editor? Either way, it is distinctly unimpressive.
The BBC says “The facility has been described as the UK’s first commercial scale liquid air energy storage plant, and could have the capacity to power 480,000 homes.” It doesn’t tell us who so described it, but Highview’s website claims instead “Once complete, it will have a storage capacity of 300 MWh and an output power of 50 MWs per hour for six hours.”
The unattributed claim gleefully quoted by the BBC (“the capacity to power 480,000 homes”) and Highview’s own claim (“a storage capacity of 300 MWh and an output power of 50 MWs per hour for six hours”) don’t sit together very comfortably. According to Statista mean domestic electricity consumption per household in England amounts to 3,400.4 KWh per annum (or 3.4004 MWh per annum). 480,000 homes would, on average, therefore use (480,000 x 3.4004) 1,632,000 MWh per annum or 4,471 MWh in a day. Dividing by 24, 480,000 homes would use around 186 MWh of electricity in an average hour. Obviously usage would be less overnight, more at peak times (usually winter evenings). However, what this suggests is that, assuming Highview’s facility was fully “charged”, then it might be able to supply 480,000 homes with electricity at average rates of demand for a little over an hour and a half (just over a quarter of the six hours referred to by Highview). Of course if, as a result of net zero, the average home is forced to rely much more on electricity than it currently does (e.g. by using electricity rather than gas for cooking and heating, and being forced to drive electric vehicles, which need to be charged up, often overnight) then that average consumption could increase substantially. In that scenario, this plant, assuming it meets expectations in full, would probably be able to supply 480,000 homes for well under an hour on average. Thus, the BBC’s use of that statistic, without any form of deeper analysis, is essentially meaningless, and potentially misleading. Still, it sounds good, which I assume is why they inserted it.
An analysis of the technology and its feasibility would have been welcome, but none is provided. All we get is this:
Energy compressed into air, liquified and then cryogenically frozen can be held at the plant for several weeks, which is longer than battery storage.
Also a claim that at large-scale it is cost-effective. An exploration of the costs might have been helpful, given that claim. None is forthcoming. However, two minutes on the internet turned up a 2023 study which offers a techno-economic analysis of a liquid air energy storage system combined with calcium carbide production and waste heat recovery. How that compares to the proposed energy storage plant at Carrington I don’t know. I do know that I would like some idea of how its costs compare to those cited in the study, namely a “levelized cost of storage [that] ranges from 382 USD/MWh to 888 USD/MWh”.
Thus, by the end of the BBC article, we don’t learn how many permanent jobs will be created, nor do we know how much it costs to store the surplus energy generated by renewables and released at times of energy shortfalls created by the intermittency of those renewables. We do know that the current funding “to get the project off the ground” (in the words of the BBC report) is £300M, of which some was provided by the UK Infrastructure Bank. The BBC doesn’t tell us how much the taxpayer has forked out in this way, but in fact it’s £165M. By the way, £300M divided between 480,000 homes equates to £625 per household as an initial investment to enable them to keep the lights on for an hour and a half. Or, if it’s 120,000 households keeping the lights on for six hours, then its £2,500 per household. Multiply that over 27 million or so households, and you’re looking at £67.5 Billion (which may not be too unrealistic an estimate given what follows).
The Highview website tells us quite a lot that the BBC omits. The large-scale (four larger scale 2.5 GWh facilities) that apparently will make this technology cost-effective will cost an anticipated £3 billion. But that’s not all:
Highview Power’s infrastructure programme will make a major contribution to the UK economy, requiring in excess of £9 billion investment in energy storage infrastructure over the next 10 years…
Your investment is my cost, especially when combined with this rather alarming (and very telling) sentence:
By capturing and storing excess renewable energy, which is now the cheapest form of electricity [sic], storage can help keep energy costs from spiralling…[my emphasis].
And this:
This storage will help reduce curtailment costs – which is significant as Britain spent £800m in 2023 to turn off wind farms.
We also learn that “several departments of the British Government… have tirelessly supported us since 2011…”. I wonder at what cost to the taxpayer, whether in direct funding or simply in the costs of civil servants who might have been usefully employed doing something else?
Perhaps the most telling quote in the Highview piece is from Chris O’Shea, Group Chief Executive of Centrica (one of the investors):
…with a changing energy mix, and more intermittency from renewables, we have to explore new, innovative ways to store energy so our customers have electricity available when the wind doesn’t blow and the sun doesn’t shine. Low carbon storage is an essential part of the solution when looking at how we manage peaks in demand...through partnerships like this we can manage the challenges net zero might present while providing cleaner, greener power to customers.…
Intermittency, challenges, costs (always described as investments). Apparently it’s all to be celebrated.
None of this detail makes it into the BBC report, though it does manage to end with a cheery send-off from Andy Burnham:
Mayor of Greater Manchester Andy Burnham welcomed the plans and said the storage facility would be a “huge boost for the region” in terms of jobs, investment and renewable energy.
Perhaps I’m being harsh. I wouldn’t like to be a BBC journalist or a BBC editor – they’re too much in the firing line from grumpy curmudgeons like me. I don’t have any problems at all with them selecting this topic to form the basis of a website article – on the contrary, it’s an interesting part of the vitally important topic of UK energy. That topic, however, is one where information about costs, energy security, possible alternative ways of proceeding, and so on, are all of vital importance. I do feel they should have been explored. Instead I fear they have been ignored with a view to providing a positive spin around, and cheer-leading for, yet another expensive part of the Net Zero project.
Footnote – the picture I used is another one generated by AI.
via Climate Scepticism
June 13, 2024 at 02:33PM
