Month: August 2024

Cry Me a Glacier

A couple of weeks ago, I was sent a link to a story on ITV.com.

‘It made me cry’: Viral photos of Swiss glacier taken 15 years apart show impact of climate change

It was somewhat surprising to see that a melting glacier had the power to wring tears from someone’s eyes. Landscapes around the world have been trashed on epic and far more emotionally-wrenching scales [insert your own examples here]. At least once a glacier recedes, it leaves behind a landscape that is still wonderful to behold.

I found myself wondering whether the recession of this particular glacier needed to be put in the proper context. And so here we are.

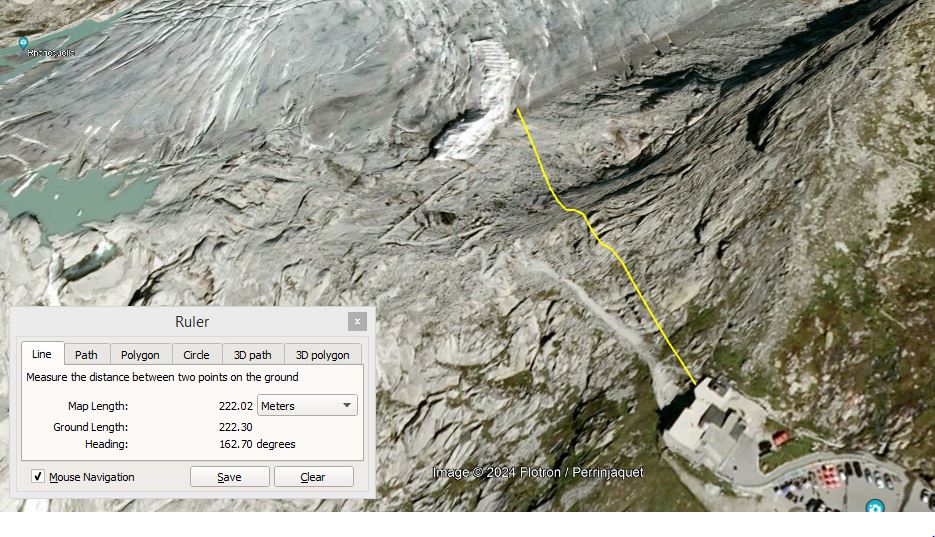
The glacier in question is the Rhonegletscher, or Rhone glacier if you like. Luckily for the seeker after context, there is plenty of history recorded for this particular river of ice. From the evidence of the photographs, the glacier has receded. To find out how much, we need to know the vantage point. I place it at the entrance to the ice grotto (now defunct) just outside the hairpin where the Hotel Belvédère sits. [I could be a little off.] [According to the text at the link, the hotel closed permanently in 2016, “one of the first Swiss victims of climate change.”]

Unfortunately, the most recent Google Earth image is from 2009. Fortunately, that year is also the date of the first photograph of the pair. The glacier’s tongue looks to be about 200 m from the viewpoint, and the glacial lake has hardly begun.

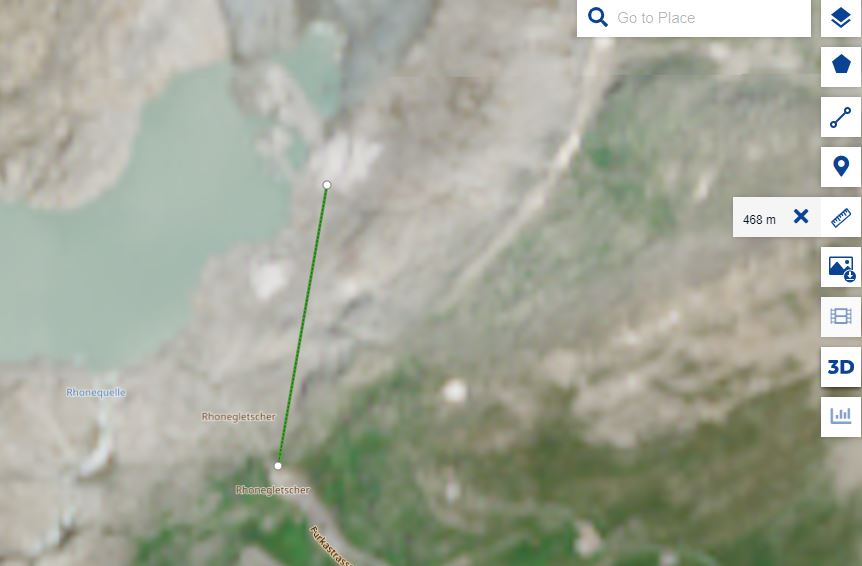
For 2024, I had to resort to the EU’s Copernicus website to get a measurement. Don’t adjust your set! The resolution is now only 20 m, so things are a little foggy. But there’s enough detail to see that the glacier has gone back quite a way, perhaps 300 m. In 15 years, that makes about 20 m per year. The tarn is now quite sizeable.

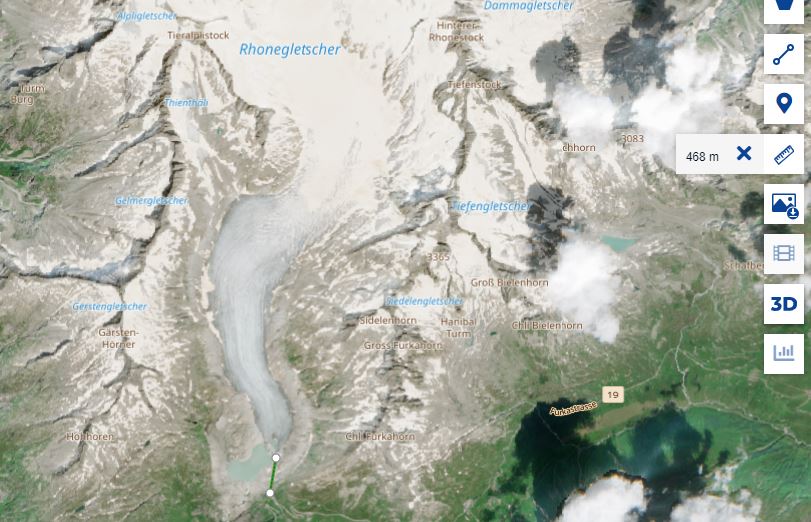
As you can see from this snip, there is a large chunk of the Rhonegletscher left. (Same scale bar at the bottom.)

Now for the context.

There is good data on the Rhonegletscher since the late 1880s, and plenty of intermittent observations prior to that. And naturally, there is further context pre-dating the direct record.

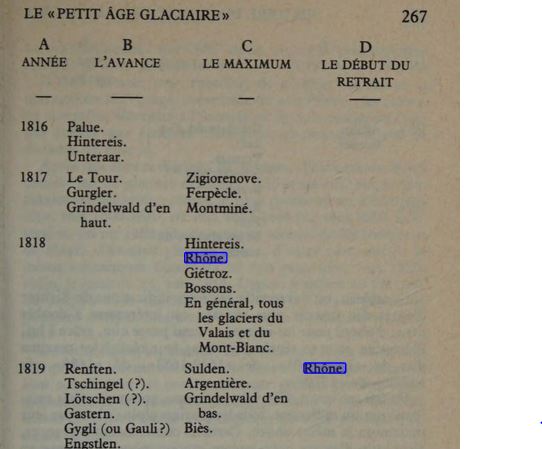
According to Le Roy Madurie [you can read his excellent book on climate since the year 1000 on Archive.org], the Rhonegletscher reached a recent maximum in 1818, & began to recede after that.

Wiki provides this landscape by Müller in about 1880. In the background, you can see the road leading over the Furka Pass (the Hotel Belvédère, and the modern photographs’ location is at about the third zigzag – the hotel’s construction and the landscape are close to contemporaneous). The location of Müller’s work is a place called Gletsch, which back when consisted of a chapel and the Hotel du Glacier du Rhone.

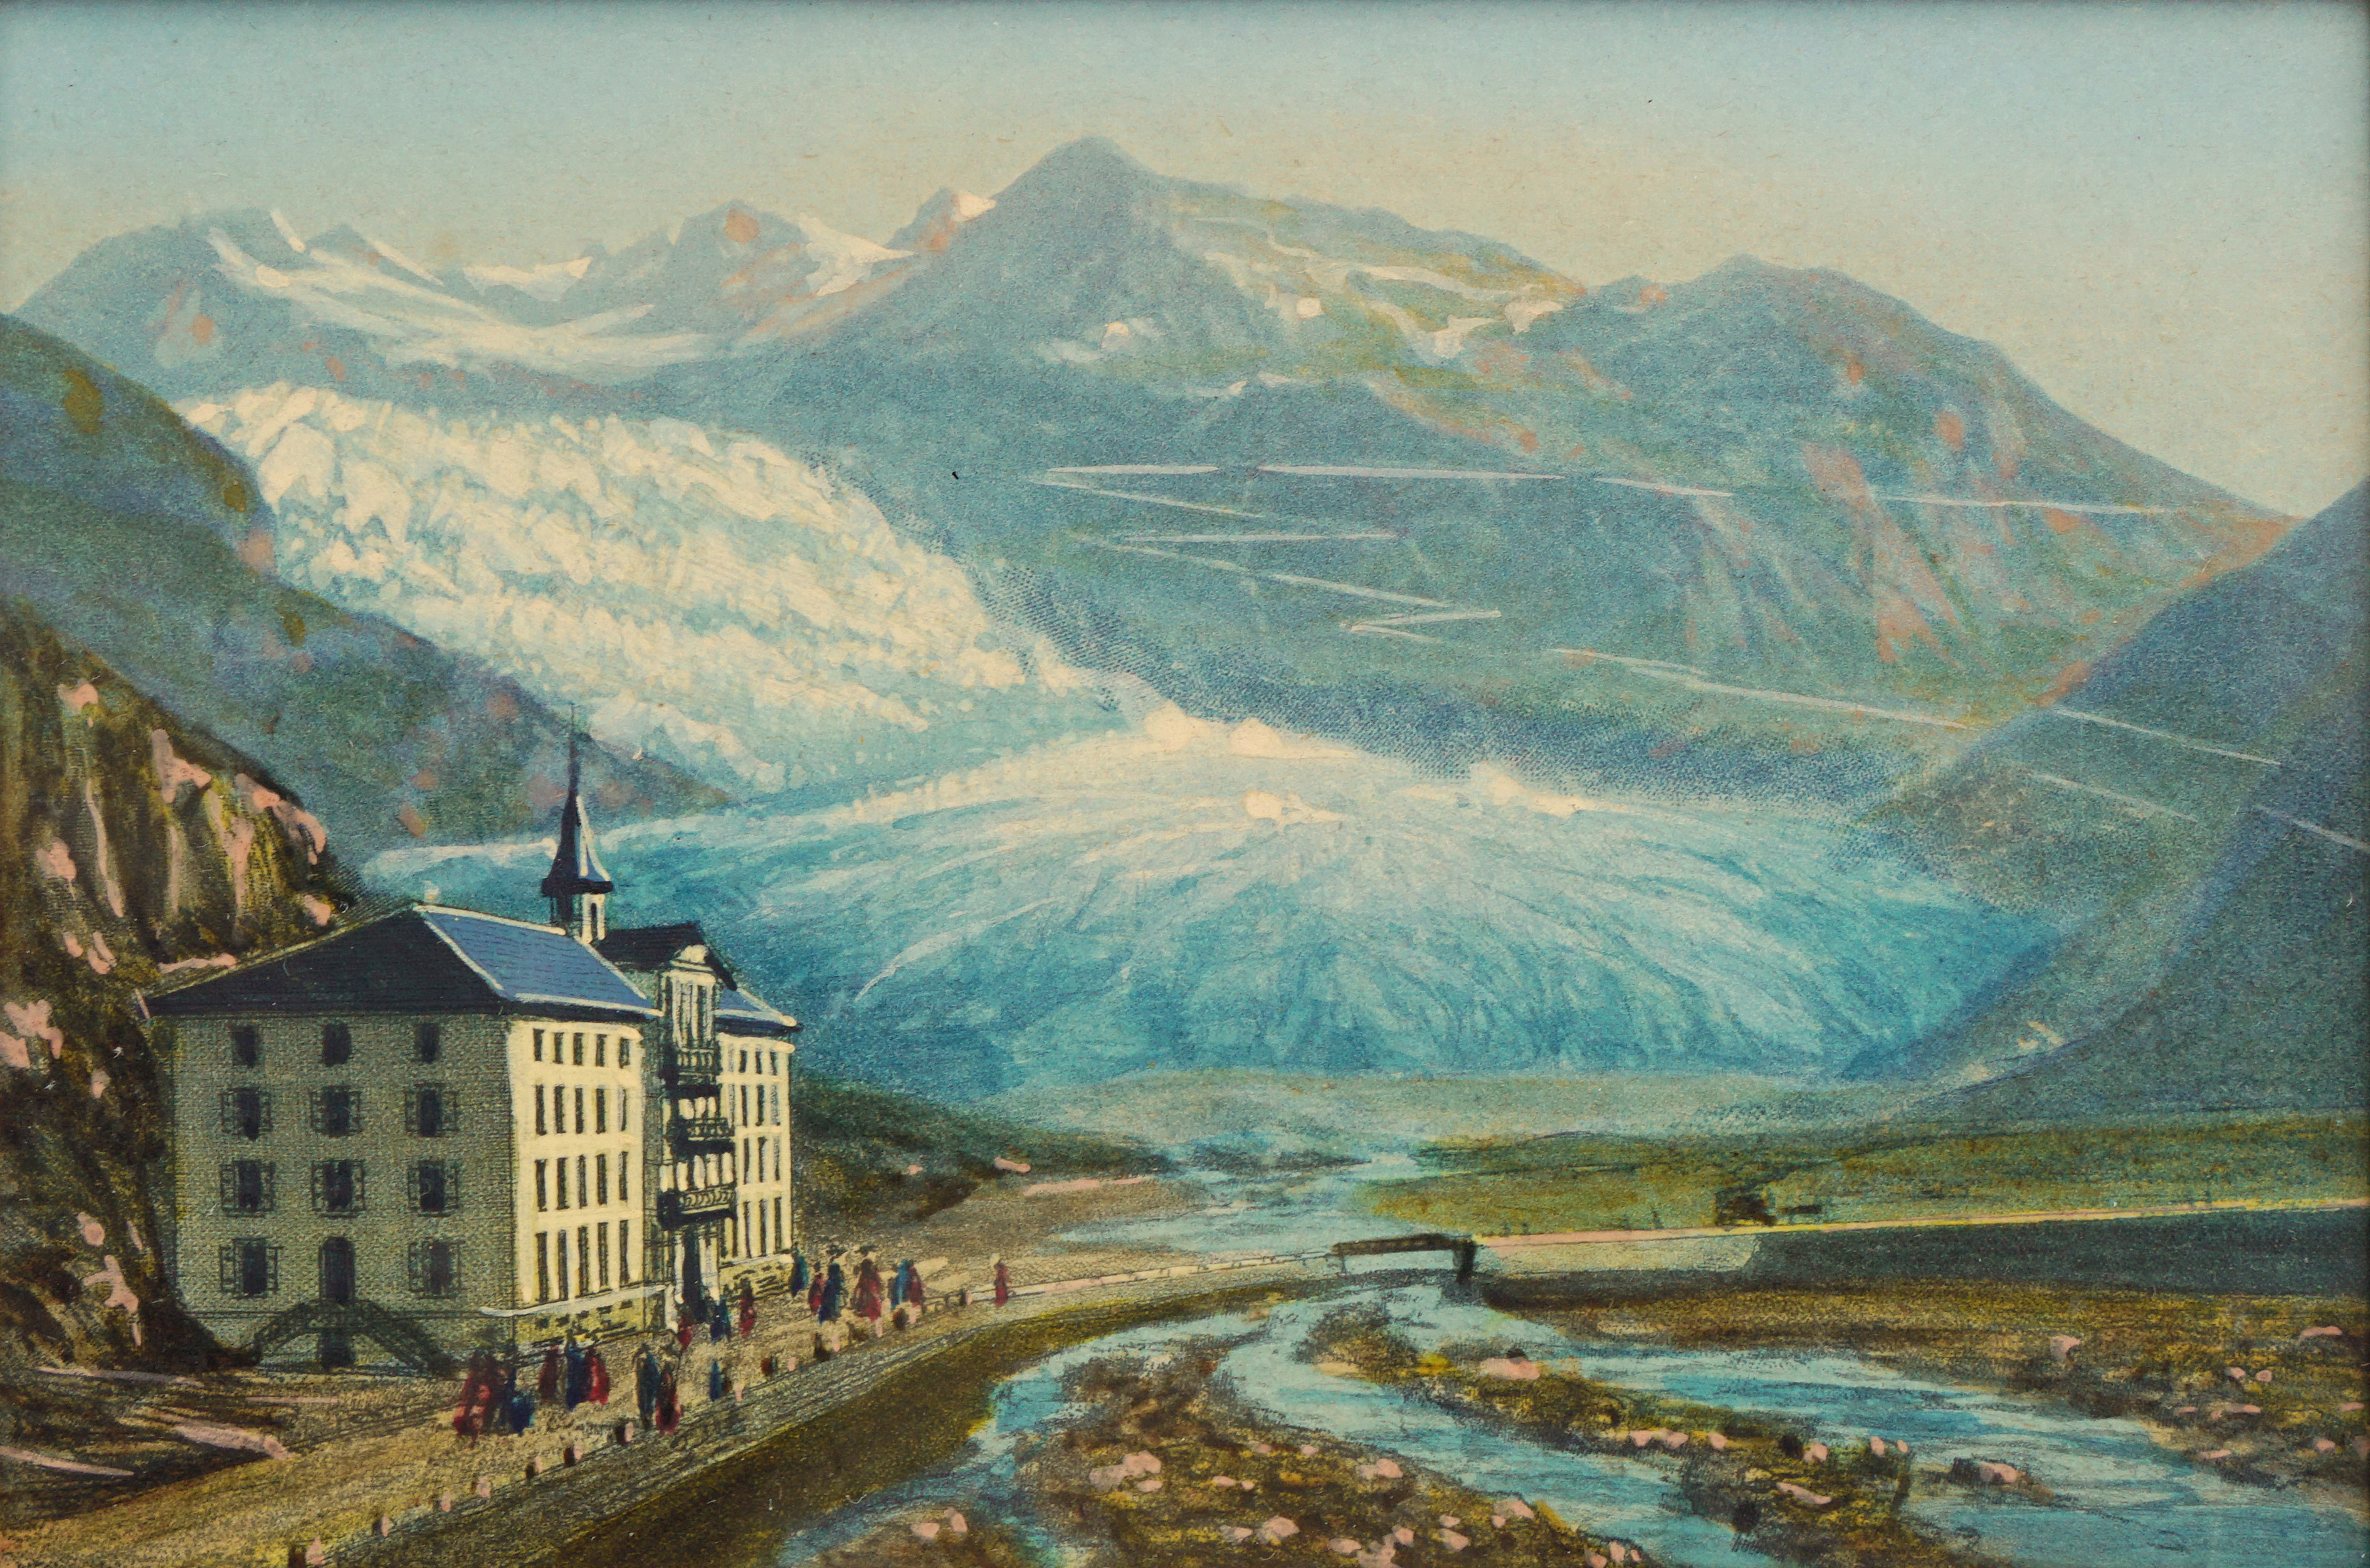
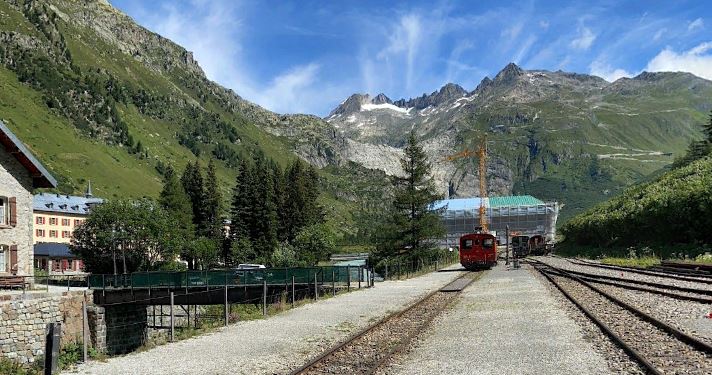
Several helpful souls have uploaded panoramas from modern Gletsch onto Google Earth. From this one by Laurin Eberhard you can still see the hotel, but it no longer has rooms with a view of the glacier. The tongue of the glacier and the tarn is behind the rock sill.

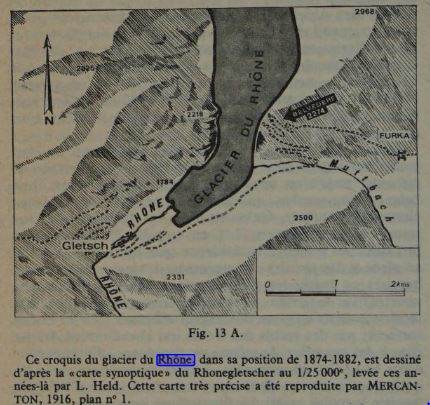
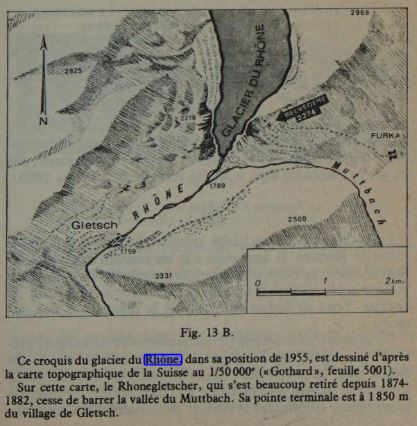
Le Roy Madurie also helpfully provides old maps showing the front of the glacier – the first from about the same time as Müller’s painting, and the second from 1955. By the second map, the glacier’s tongue has rolled back almost to the level of the Hotel Belvédère, as marked.

So far, the context we have is of not 15 years of recession, but two centuries.

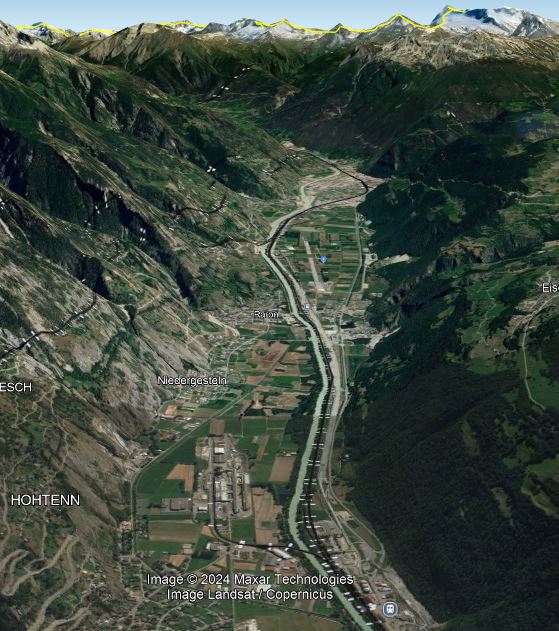
Next, if we zoom out, away from Gletsch and the Hotel Belvédère, we can see the rather impressive Upper Rhone valley in its entirety [Google Earth again]. Students of geography will recognise the landscape. The valley is >100 km long, descending westwards away from the glacier before turning right & opening out into Lake Geneva.

It should not need spelling out, but the settlements and farms that fill the bottom of this rather marvellous U-shaped valley depend for their existence on glacial retreat. Woe betide them if the ice began to advance.

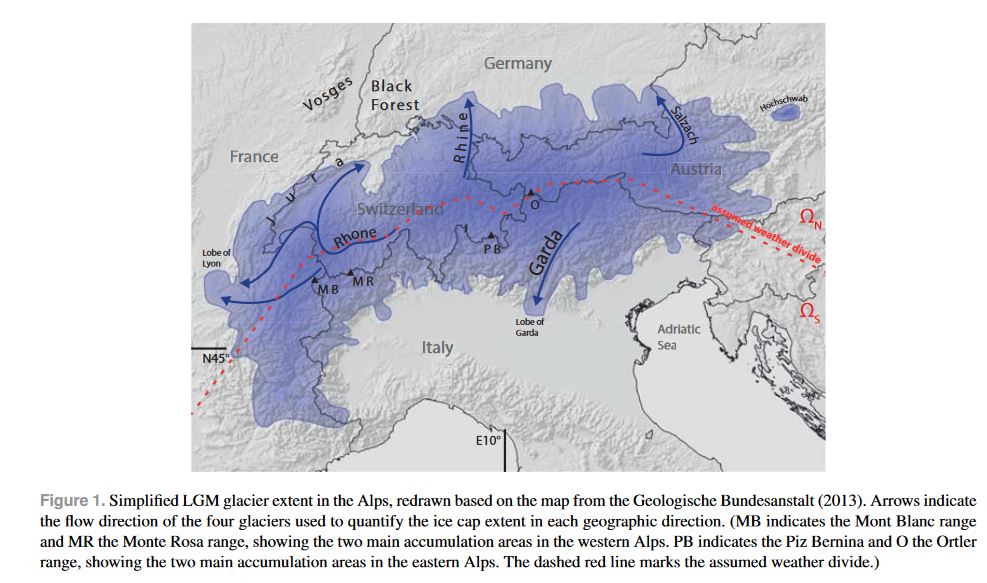
Zooming back still further, and deeper into time, we reach the scale of thousands of years and hundreds of kilometres. 20,000 years ago, the entire Alps was a single vast block of ice. Of course the Upper Rhone valley is filled, and Lake Geneva, Montreux and Geneva itself (where the little isthmus of Switzerland pokes into France under the J of Jura) are under the ice. Smoke on the Water? Not so much. (Figure from Becker et al, 2016.)

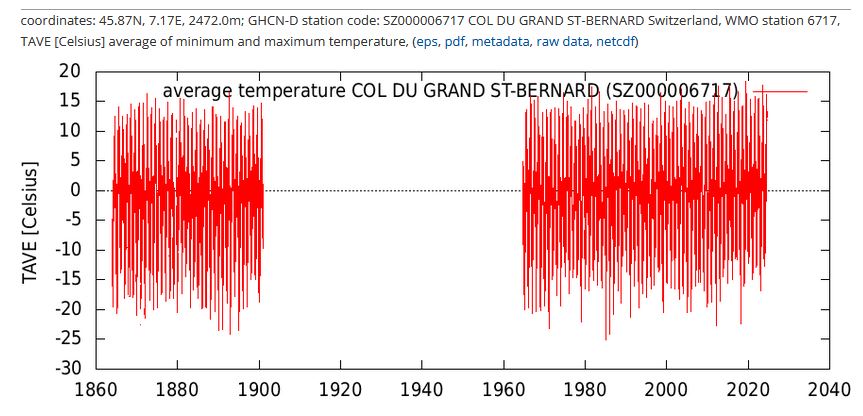
What has caused the recession of the Rhonegletscher? The beginning of its retreat in 1820 could not have been due to a surfeit of SUVs. And yes, temperatures have risen in the last 40 years, but not necessarily everywhere – the below image from KNMI shows the temperature record for the Col du Grand St-Bernard, at the other end of the Rhone valley and to its south, and at about the same elevation as Hotel Belvédère.

Then what? The old glaciologist’s answer is precipitation. The glacier is a conveyor belt loaded with ice at one end, and ablated and melted as it goes before dwindling to nothing. Naturally, storm tracks from the Atlantic vary in their average latitude, determining how much snow falls where. But I cannot help but wonder whether downslope land-use changes have a role to play in reducing the available precipitation: speculation, and something to investigate another day.

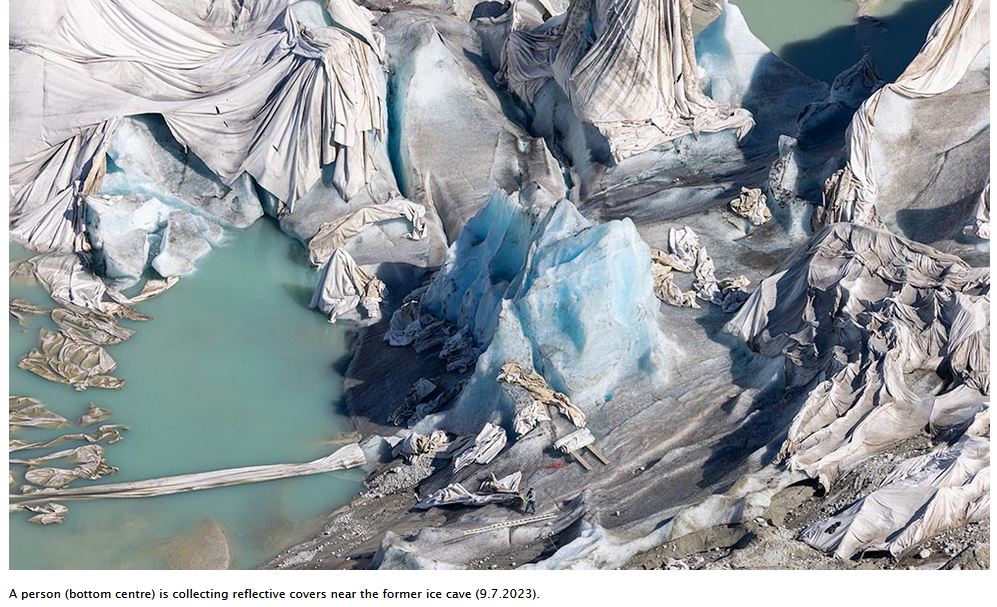
Finally on this topic, I present a futile attempt to wrap the Rhonegletscher in blankets to keep it cold. File under “trashing the planet to save it.” No doubt the proprietor of the ice grotto was upset that the ice receded and ruined their tourist attraction. But in general, few people lose out when the ice retreats.

The owners of the Hotel du Glacier du Rhone may be cheerful should the glacier once again peek over into their part of the valley. But we should be careful what we wish for.

Changes on human timescales can be dramatic, but they are dwarfed by what has gone on before we appeared on the landscape, and what will go on once we have departed it. Our perspective may be that Nature is static, or ought to be. But it never is. Change is the norm, and if the ice isn’t going…

…it’s coming.

via Climate Scepticism

https://ift.tt/5CKbOXg

August 28, 2024 at 03:42PM

The “Unaffordable” Winter Fuel Allowance

By Paul Homewood


 Image

via NOT A LOT OF PEOPLE KNOW THAT

https://ift.tt/BjHnaLq

August 28, 2024 at 12:50PM

Why Is Cheap Wind Power So Expensive?

Guest Post by Willis Eschenbach (@weschenbach on eX-Twitter)

Back on March 29, 2021, the Biden White House took on the following goals:

Hmmm, sez I, seems a mite ambitious. Current US grid-connected offshore wind is a mere 0.17 gigawatts … so we’d need to do ~ 175 times as much as we’ve done to date and do it in a short six years.

So I divided it out. There are 65 months until 2030. Thirty gigawatts is thirty thousand megawatts, less the 174 megawatts in place, that’s 29,826 megawatts more total generating capacity needed.

29,826 megawatts divided by 65 months means we’d have to add offshore wind generation to the tune of 465 additional megawatts of generation capacity per month. Every month. Starting now.

Get real. That’s not remotely possible. The biggest US offshore windfarm just came on line, 132 GW capacity. To reach the White House goal, every month we’d need to build three new windfarms of that size. No way that can happen. It’s just numbers picked out of the air to gain popular support.

Next, I researched the length of time it takes to get an offshore wind farm online. Here’s what ChatGPT sez:

The time from the proposal of an offshore wind farm to its grid connection typically ranges from 7 to 10 years. This timeline can be broken down into several phases:

Pre-development and Planning (1-2 years): This phase involves site identification, feasibility studies, and initial environmental assessments.

Permitting and Approvals (3-5 years): Securing the necessary permits and approvals is often the most time-consuming part of the process. This includes detailed environmental impact assessments, consultations with stakeholders, and obtaining state and federal permits.

Construction (2-3 years): Once all approvals are secured, construction of the wind farm, including the installation of turbines and subsea cables, takes place. This phase also includes the grid connection process.

Commissioning and Testing (several months): After construction, the turbines are tested, and the wind farm is gradually brought online.

Seems unreasonable but likely factual. So what that means is that unless a project is well underway right now, it won’t be online until after 2030.

Under the Biden Administration, there have been nine offshore wind projects approved. These propose building a total of 13 gigawatts of offshore wind capacity. However, only two of these projects are actually under construction or completed —Vineyard Wind, located off the coast of Massachusetts, and South Fork Wind, located near the coasts of Rhode Island and New York.

South Fork Wind just came online. This gives us a chance to look at some actual cost figures. It’s the biggest wind farm to date, a 132-megawatt addition to offshore wind. It cost $637 million.

(Note that to reach the 30 GW goal, we’d need no less than 225 wind farms of this size … but I digress)

However, Federal subsidies added $191 million to that, plus another couple of hundred million or so from Bureau of Ocean Energy Management (BOEM), the National Oceanic and Atmospheric Administration (NOAA), and the New York State Energy Research and Development Authority (NYSERDA).

Stop and consider. Some private company is building a six-hundred-million-dollar white elephant in the middle of the ocean, and it’s getting paid four hundred million of taxpayer money to do so.

So … what does the New York consumer get for all of this more than generous support?

The consumer gets wind power costing FOUR TIMES AS MUCH as the current cost of power in New York.

Stop and consider. Even when the developer gets two-thirds of the cost paid by the taxpayer, offshore wind power is still four times as expensive.

And of course, that doesn’t even touch the cost of maintaining backup power for the times when there’s no wind … the cartoonist Josh sees that clearly.

Here’s more about the real-world cost of offshore wind power in New York.

What’s next?

Well, I’m sure that what’s next is the Harris/Walz campaign will declare that they are 100% behind expensive, intermittent, unreliable wind power, and will claim that if elected, they’ll do what they already said they’d do when Ms. Harris was last elected, which was to screw the consumer and the taxpayer with the huge subsidies, tax breaks, and electricity costs of offshore wind.

Oh, yeah. They claim that the 30 GW of offshore wind will “avoid 78 million metric tonnes of CO2 emissions”. Tens of millions of tonnes, sounds impressive, right?

But IF the IPCC is correct, and that’s a big if, this will reduce the temperature in the year 2050 by …

… wait for it …

… 0.0016°C. Which is almost three-thousandths of one degree F.

Can we please pass a law saying people proposing any laws or regulations in the name of “climate change” be required to tell us (and show their math) how much actual temperature difference that will make by 2050?

Go ahead. Ask the folks in New York, “Are you willing to pay four times the going rate for electricity for the rest of your life to MAYBE cool the globe by three-thousandths of one degree Fahrenheit a quarter century from now?”

Regards to all,

w.

As Always: I ask that when you comment you quote the exact words you’re discussing. Avoids endless foolishness.

The Math. TRIGGER WARNING!! I did say “show the math” didn’t I … but this is just arithmetic. Take heart.

Anything after a hashmark “#” on a line is a comment. A line starting with “>” is an instruction to the computer. A line starting with “[1]” is the result of the calculation.

> (gtco2 = 78e6 * 20 / 1e9) # "gtco2" is total gigatonnes CO2 avoided, 2030-2050

[1] 1.56 # gigatonnes

> (deltappmv = gtco2 * 12 / 44 / 2.13) # convert GT C02 to GT carbon, then to ppmv (2.13 GTonnes C = 1 ppmv)

[1] 0.20 # ppmv difference in 2050 due to wind farm

> (fullchange = (gettrend(co2ts) * 26 + 425)) # current atmospheric CO2 trend extended from 2024 to 2050

[1] 467.6 # atmospheric ppmv CO2 in 2050

> (theforce = log2((fullchange + deltappmv) / fullchange) * 3.7) # W/m2 forcing change due to 2050 CO2 difference

[1] 0.0023 # W/m2

> (tempchange = .7 * theforce) # temperature change from the CO2 forcing

[1] 0.0016 # °C

via Watts Up With That?

https://ift.tt/hbcftF4

August 28, 2024 at 12:03PM

Solar or food production? Somerset farmers locked into debate


Once again the obvious intermittency issue with renewables, whether solar or wind, is buried. Solar production peaks in the middle of the day, nowhere near the times when electricity demand is highest, and is highly seasonal. Outsourcing ever more food production to other countries has its own risks, but so does farming itself.
– – –
Should rural land be used to produce food or energy? It is a question that divides farmers nationwide, and is being debated on the Somerset Levels, says BBC News.

On ancient grazing pastures steel and silicon solar panels are being installed, taking thousands of acres of farmland out of food production.

Across the country, the new Energy Security Secretary, Ed Miliband, has already approved three huge controversial developments, covering 6,200 acres (2,500 hectares) of farmland.

And while some farmers see solar as offering financial stability, others fear the loss of the land that feeds us.

Mr Miliband wants to quadruple UK solar power, which he says will “make the UK a clean energy superpower.” [Talkshop comment – with part-time electricity?]

Some farmers are happy to rent their fields to the growing green energy industry.

Others are joining forces with campaigners fighting to keep farms for food.

“We’re losing so much of our farmland,” said Hugh Williams, of Somerset Campaign to Protect Rural England (CPRE).

“Once it has gone, the damage is done.”

So why do farmers agree to put their fields under silicon panels? And will it mean Britain has to import more food?
. . .
Louis Smith is an experienced rural accountant at the advisory firm Old Mill.

I asked him to compare solar with wheat, the most profitable crop farmers grow in the South West.

He explained: “In a phenomenal year you might hope for four tonnes of wheat per acre, which would give you a gross revenue of £600-£800 an acre, depending on the price. So after costs, you might make £200 an acre profit.”

Solar schemes are, he calculates, four or five times more profitable.

The government wants to quadruple the amount of solar energy made in Britain, from 15 gigawatts now to over 70 GW by 2035.

Plenty of farmers will be offered a solar sweetener. Few would want to put all their fields under panels, and there are tax consequences of doing so.

But a part of the farm? Mr Smith is quite clear.

“If you can get financial stability in your business, surely that’s what everybody is after?”

Full article here.
– – –
Image credit: Farming UK News

via Tallbloke’s Talkshop

https://ift.tt/r5Fd7QK

August 28, 2024 at 11:13AM