
Sun, clouds and climate – a post from an EIKE reader
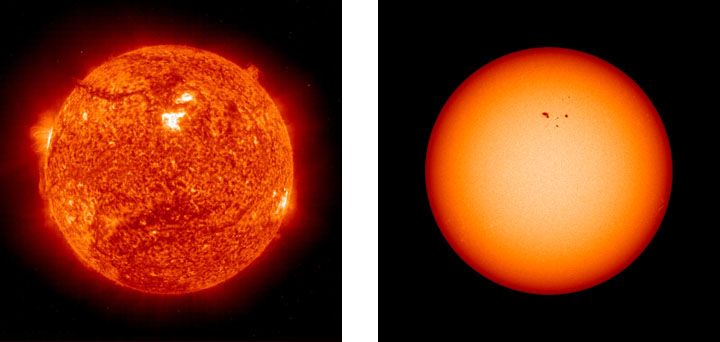
Image: NASA (public domain)
Posted by AR Göhring
In a conversation with the EIKE editorial team, our reader Garik Müller noted that recent solar storms have promoted cloud formation – which would contradict the Svensmark-Shaviv effect and the Forbush effect.
But the Earth’s atmosphere is known to be much more complicated than the computer models of climate researchers – solar radiation can also have a different effect under different circumstances.
A discussion article by Garik Müller
Question from EIKE:
When there is a lot of solar wind, the particles from space are deflected away from the earth, the Forbush effect. If there are fewer particles, there are fewer cloud nuclei. The recent solar ejections should therefore have reduced the clouds, nnless certain solar events produce particles that can penetrate the van Allen belt.
Garik Müller:
It is high-energy radiation that comes both from the cosmic realm and is emitted towards the Earth during certain solar activities. Usually the starting point on the sun points away from the Earth. This time, however, the Earth was directly in focus. Due to the cascade effect, the ionizing radiation reaches the troposphere.
The Forbush effect actually only works if the “solar storm” points towards the Earth at the same time.
If it is offset in time, it does not have such a strong effect.
However, the Svensmark-Shaviv effect, which I believe to be conclusive and correct after having studied it for a long time, is only the first stumbling block in events like this year and is far more strongly influenced by the sun. There was still little cloud cover until the beginning of June. As a result, we had higher global surface temperatures, which subsequently fell, as the evaporation rate over the oceans increased considerably, which in turn led to a partial fall in sea surface temperatures, especially in the Atlantic and Pacific.
After that, there was a period of increased solar activity, as I was able to learn from observations of a friend in Frankfurt. Whenever large-scale cloud formation began, the number of sunspots were considerably higher. This has also been the case recently. It has also been interesting to observe that the processes were always congruent in time.
If you then take the work of Zharkova, it seems striking that such events seem to accumulate towards the end of a solar maximum, which then often coincides with local weather phenomena such as the current one, which again raises many questions. It becomes unpleasant when the flow systems intensify the whole thing together with the topographical conditions.
The reactions from the climate hysterics are neither helpful nor appropriate. BBut then it becomes so mathematically complex that 99.9% of scientists can hardly describe it. Meticulous work would be necessary. This cannot be done using existing algorithmic models because the models would then crash.
This is the point where mathematics catches up with conventional theory. There is some work on this, but you won’t find anything about it without targeted research.
The idea came to me when I thought of my work on meson passages in this context. The theoretical foundations from this are very helpful for this topic.
More literature on this:
[1] Review of Particle Physics, C. Amsler et al., Physics Letters B667, 1 (2008)
[2] O.C. Allkofer, H. Jokisch, A survey on the recent measurements of the absolute vertical cosmicray muon flux at sea level, Il Nuovo Cimento A (1971-1996), Volume 15, Number 3, 1973, Pages 371-389.
[3] Thomas Hebbeker, Charles Timmermans, A compilation of high energy atmospheric muon data at sea level, Astroparticle Physics, Volume 18, Issue 1, August 2002, Pages 107-127.
[4] M. Fuidl, Kosmische Myonen in Schulversuchen, Johannes-Gutenberg-Universitaet Mainz, Institut fur¨ Physik, September 2003.
[5] C. Wiebusch, Astroteilchenphysik -Vorlesungsskriptum, RWTH Aachen, III. Physikalisches Institut, Sommer 2010.
[6] S. Schael, Teilchen und Astrophysik -Vorlesungsskriptum, RWTH Aachen, I. Physikalisches Institut, Winter 2008.
[7] W.R.Leo: Techniques for Nuclear and Particle Physics Experiments, Springer Verlag 1987
[8] J.Krieger, GNU Public License / wikimedia Commons https://ift.tt/P1xcAXK
[9] J.N. Crookes, B.C. Rastin, An investigation of the absolute intensity of muons at sea-level, Nuclear Physics B, Volume 39, 1 April 1972, Pages 493-508.
[10] B76D01 Photomultiplier Tube, ADIT.
[11] Christophe Dang Ngoc Chan, Angle solide definition, Wikicommons https://ift.tt/ZTqUbzk
[12] R. Haeusler, A. F. Badea, H. Rebel, I. M. Brancus, J. Oehlschlager, Distortions of experimental muon arrival time distributions of extensive air showers by the observation conditions, Astroparticle Physics, Volume 17, Issue 4, July 2002, Pages 421-426.
[13] Allkofer, O. C., Grieder, P. K. F., Cosmic Rays on Earth, Physik Daten, ISSN 0344-8401, 1984.
[14] Helios Dr. Bulle GmbH & Co. KG, Tea Boy Nr. 3334 -002 https://ift.tt/gMUBP8h
[15] S. Sciutto, COSMUS work group, AIRES Simulations https://ift.tt/9caf74D
[16] Auger Engineering Array Group, Pierre Auger Observatory https://ift.tt/IpdmOAt
[17] F. Schmidt, CORSIKA Shower Images https://ift.tt/InfeU5Q
[18] K.-H. Kampert and A. A. Watson. Extensive air showers and ultra high-energy cosmic rays: a historical review., European Physical Journal H 37:359-412 (August 2012). doi:10.1140/epjh/e2012-30013-x
[19] I. Allekotte et al., The Surface Detector System of the Pierre Auger Observatory , Nucl. Inst. Meth., vol. A586, pp. 409-420 (2008), arXiv:astro-ph/0712.2832
[20] J. de Mello Neto (for the Pierre Auger Collaboration), Studies of Cosmic Rays at the Highest Energies with the Pierre Auger Observatory, EPJ Web of Conferences(2014), doi: https://ift.tt/YJ6tQ82
[21] J. Bl¨ orandel, Cosmic rays from the knee to the highest energies, Progressumer, R. Engel and J.R. H¨ in Particle and Nuclear Physics, vol. 63, p. 293-338 (October 2009),https://ift.tt/4gVF5kT. 0725
[22] M.G. Aartsen et al., Observation of High-Energy Astrophysical Neutrinos in Three Years of IceCube Data, IceCube Collaboration, Phys.Rev.Lett., Volume 113, 2014 https://ift.tt/BCRkrT7
[23] Anne Schukraft, Search for a diffuse flux of extragalactic neutrinos with the IceCube Neutrino Observatory, Dissertation, Rheinisch-Westf¨alische Technische Hochschule (RWTH) Aachen, June 2013
[24] IceCube Collaboration, Evidence for High-Energy Extraterrestrial Neutrinos at the IceCube Detector, Science, 22 November 2013, Vol. 342 no. 6161, DOI: 10.1126/science.1242856
Donate – choose an amount
via NoTricksZone
September 28, 2024 at 09:42AM


