Gordon Hughes explains the analogy in his Rea Clear Energy article Offshore Trojan Horses. Excerpts in italics with my bolds and added images.
In July, the U.S. Department of Interior greenlighted large offshore wind farms in New Jersey and Maryland. Once the financial agreements are in place, New Jersey’s Atlantic Shores and Maryland’s MarWin and Momentum will join the two large wind farms in New York approved in June. These projects will receive huge, multibillion-dollar subsidies from the federal government and electricity ratepayers. What benefits will New Jersey and Maryland enjoy from this flood of money?
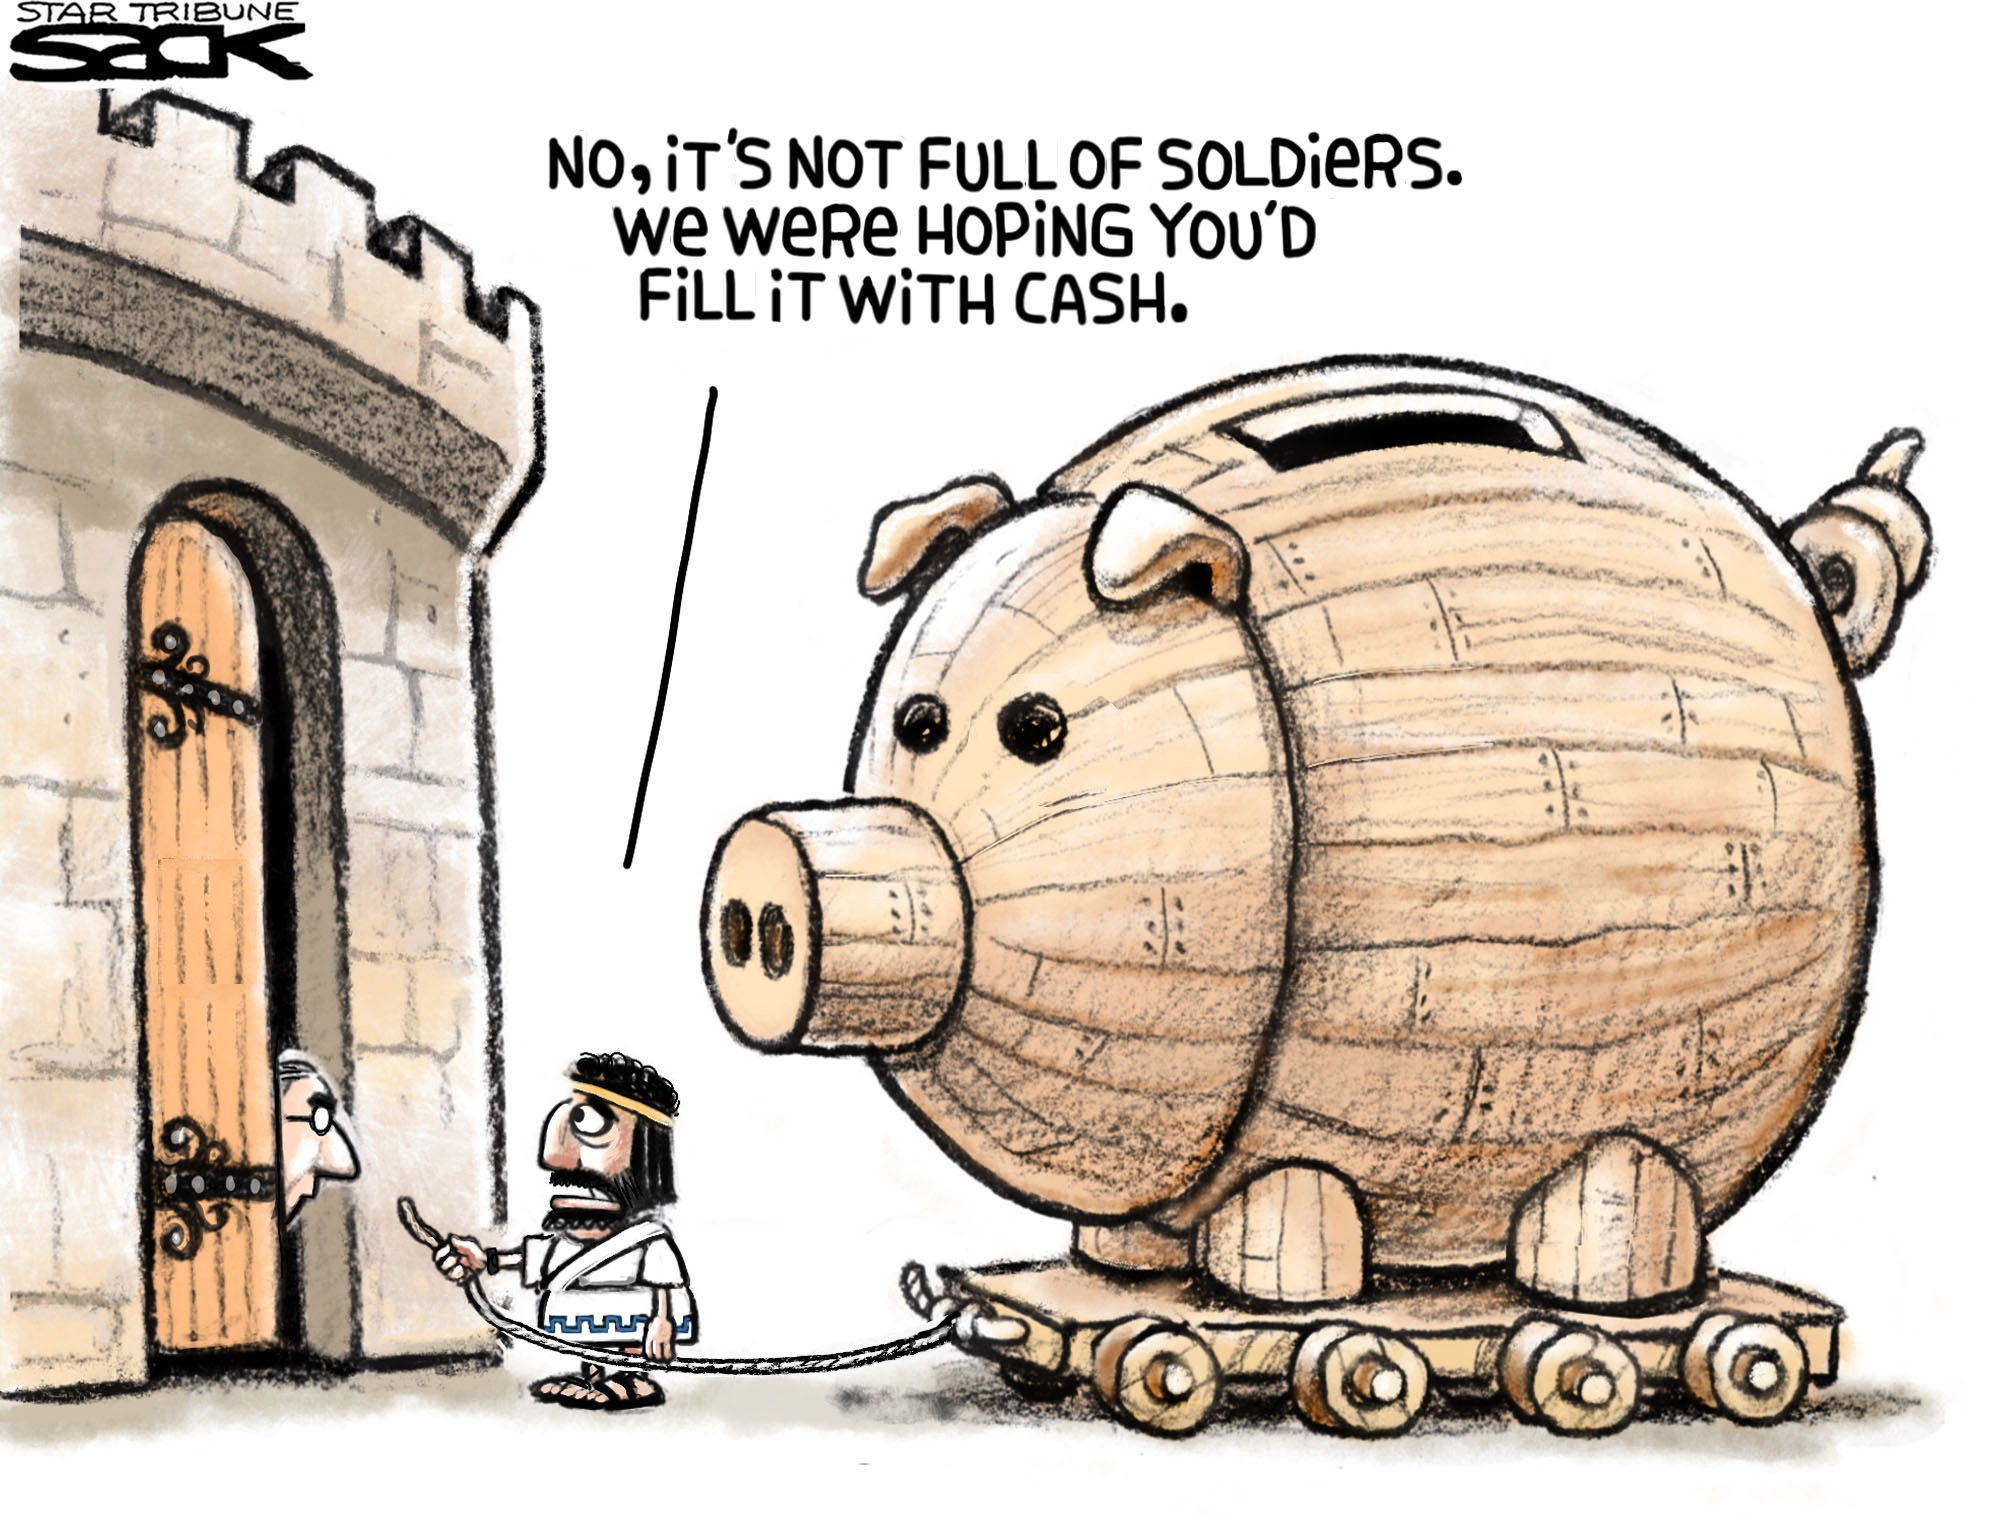
To answer this question, it is best to recall the classic warning of the Trojan Horse legend, “Beware of Greeks bearing gifts”—in other words, the hidden dangers of accepting something that seems too good to be true. New York State ignored that warning when it agreed to pay very high prices for the electricity to be supplied from its new offshore wind farms—Empire Wind 1 and Sunrise Wind—located off the coast of Long Island.

In announcing the final agreements, New York Governor Kathy Hochul triumphantly claimed that the new projects would create more than 800 jobs during the construction phase and deliver more than $6 billion in economic benefits for the state over 25 years.
Rather less emphasis was given to the fact that New York will pay an average price of over $150 per MWh (megawatt hour) for the electricity generated by Empire Wind 1 and Sunrise Wind.That’s more than four times the average wholesale price of electricity in New York during 2023–24, $36 per MWh. The total annual premium over the wholesale market price for the power from these wind farms will be about $520 million per year at 2024 prices. Over 25 years, New York ratepayers will be paying about $13 billion for alleged benefits of $6 billion.

That is not all. Thanks to tax credits, U.S. taxpayers will cover at least 40% of the costs of constructing the wind farms. At a minimum cost of $5.5 million per MW (million watts) of capacity, the total federal subsidy for New York’s two wind farms will be at least $3.8 billion.
What about jobs and other economic benefits? A study prepared for Equinor, the owner of Empire Wind 1, and submitted to the federal Bureau of Ocean Energy Management (BOEM) claimed that it would directly generate 180 annual jobs in New York during the six-year construction phase. The study estimated another 60 annual jobs due to the indirect employment effect, i.e., extra employment in the supply chain for the project.
A more reasonable estimate for the two projects together would be 515 annual jobs, not 800. The total contribution to New York State’s gross value added (the equivalent of GDP at the state level) during the construction of both projects would be less than $450 million, based on the report submitted to BOEM. Similar calculations for annual operating and maintenance (O&M) costs suggest an annual contribution of about $24 million to gross value-added or about $600 million over 25 years.
Rather than the benefits of $6 billion over 25 years touted by Governor Hochul, a realistic assessment would be closer to $1.1 billion at 2024 prices. In any event, residents will be paying a cumulative premium of $13 billion for the electricity these projects will generate.
Moreover, the additional jobs claimed for the project are concentrated heavily in the final year of construction—and the largest share (47%) consists of professional services. Overwhelmingly, these are jobs for people who would otherwise be working on other assignments.
The economic benefits of the two offshore wind farms are much lower than claimed by the governor and the jobs are, in large part, temporary assignments for professional services staff. Promoting business for consulting firms may be considered a desirable outcome by Ms. Hochul. Still, the very high financial burden will be borne by almost the entire population of the state.

Stepping back from the New York projects, the Biden administration’s overall goal is to reach a target of 30 GW (billion watts) of offshore electricity generation capacity by 2030 or shortly thereafter. That is equivalent to 17 times the capacity of the combined Empire Wind 1 and Sunrise Wind projects. Detailed costs and financial arrangements vary, but the figures above suggest that the recurring premium paid by electricity ratepayers in states with offshore wind farms will be about $9 billion per year. The benefits of new job creation and incomes from capital and O&M expenditures are likely to be less than $800 million per year.
In addition to the very large subsidies paid for from ultra-high electricity bills, federal taxpayers will contribute about $65 billion via tax credits if the Biden administration’s offshore wind target is met. While the subsidies for individual projects may not seem outrageous, the commitment of money to subsidize offshore generation is about $870 for every member of the country’s population. This may be spread over 25 years, but it is a huge liability for one very small element of U.S. programs to support renewable energy.
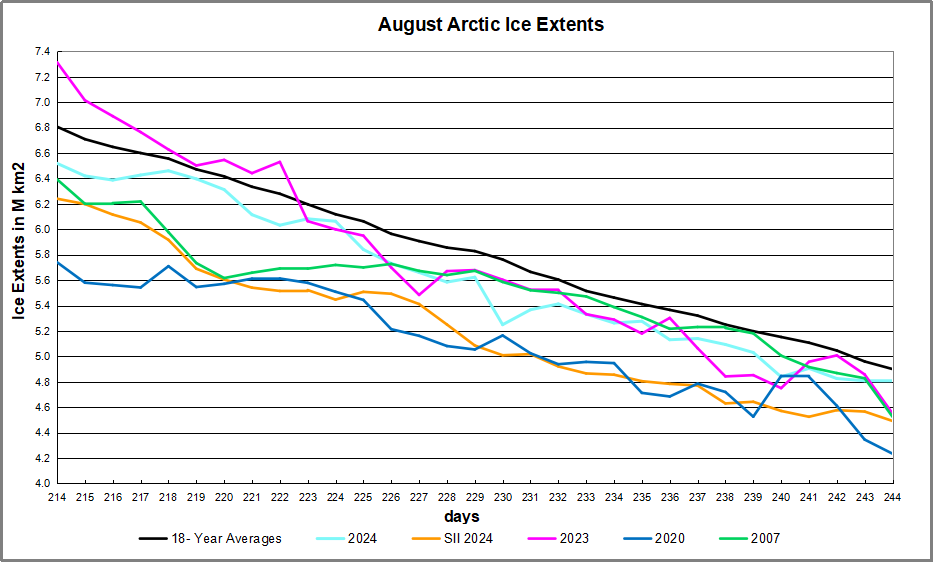
PS And it’s doubtul how many wind turbines will last 25 years

The Short Lives of Wind Turbines
via Science Matters
https://ift.tt/MVsliJ7
September 1, 2024 at 09:01AM