The Version 6 global average lower tropospheric temperature (LT) anomaly for July, 2024 was +0.85 deg. C departure from the 1991-2020 mean, up from the June, 2024 anomaly of +0.80 deg. C.
The linear warming trend since January, 1979 now stands at +0.15 C/decade (+0.13 C/decade over the global-averaged oceans, and +0.21 C/decade over global-averaged land).
The following table lists various regional LT departures from the 30-year (1991-2020) average for the last 19 months (record highs are in red):
YEAR
MO
GLOBE
NHEM.
SHEM.
TROPIC
USA48
ARCTIC
AUST
2023
Jan
-0.04
+0.05
-0.13
-0.38
+0.12
-0.12
-0.50
2023
Feb
+0.09
+0.17
+0.00
-0.10
+0.68
-0.24
-0.11
2023
Mar
+0.20
+0.24
+0.17
-0.13
-1.43
+0.17
+0.40
2023
Apr
+0.18
+0.11
+0.26
-0.03
-0.37
+0.53
+0.21
2023
May
+0.37
+0.30
+0.44
+0.40
+0.57
+0.66
-0.09
2023
June
+0.38
+0.47
+0.29
+0.55
-0.35
+0.45
+0.07
2023
July
+0.64
+0.73
+0.56
+0.88
+0.53
+0.91
+1.44
2023
Aug
+0.70
+0.88
+0.51
+0.86
+0.94
+1.54
+1.25
2023
Sep
+0.90
+0.94
+0.86
+0.93
+0.40
+1.13
+1.17
2023
Oct
+0.93
+1.02
+0.83
+1.00
+0.99
+0.92
+0.63
2023
Nov
+0.91
+1.01
+0.82
+1.03
+0.65
+1.16
+0.42
2023
Dec
+0.83
+0.93
+0.73
+1.08
+1.26
+0.26
+0.85
2024
Jan
+0.86
+1.06
+0.66
+1.27
-0.05
+0.40
+1.18
2024
Feb
+0.93
+1.03
+0.83
+1.24
+1.36
+0.88
+1.07
2024
Mar
+0.95
+1.02
+0.88
+1.35
+0.23
+1.10
+1.29
2024
Apr
+1.05
+1.25
+0.85
+1.26
+1.02
+0.98
+0.48
2024
May
+0.90
+0.98
+0.83
+1.31
+0.38
+0.38
+0.45
2024
June
+0.80
+0.96
+0.64
+0.93
+1.65
+0.79
+0.87
2024
July
+0.85
+1.02
+0.68
+1.06
+0.77
+0.67
+0.01
The full UAH Global Temperature Report, along with the LT global gridpoint anomaly image for July, 2024, and a more detailed analysis by John Christy, should be available within the next several days here.
The monthly anomalies for various regions for the four deep layers we monitor from satellites will be available in the next several days:
Stop the rush! A slightly sinister sounding ‘intervention from policymakers’ (some kind of government ban?) is proposed. The nanny state must step in or people might use too much electricity keeping cool, or something. Worse still, they might expel heat into the outside air. Brits are living in the wrong type of homes it seems, or will be should a mythical Mediterranean-style climate ever arrive.
– – –
The UK needs coordinated plans to stop a rush for air conditioning as temperatures rise, experts say.
Overheating is already a problem in UK homes, resulting in increasing levels of discomfort, illness and death, claim the researchers.
In a new policy brief, University of Exeter researchers warn that—without intervention from policymakers—many more UK households will opt for air-con.
This would lead to more carbon emissions, create new challenges for the energy system, and increase inequality.[Talkshop comment – what?]
The researchers call for a “passive-first” approach to keep people cool, and make five key recommendations to reduce risks and support action.
“In temperate countries like the UK, buildings have largely been built to retain warmth in winter rather than keep out the heat,” said Richard Hoggett, from the University of Exeter.
“Already in an average summer, around 20% of homes in England experience overheating. Risks are currently higher in London and the South East, but all regions of the UK will need to adapt.
“Recent research on the 2022 heat waves highlights that the country is currently ill-prepared for future extreme heat events.”
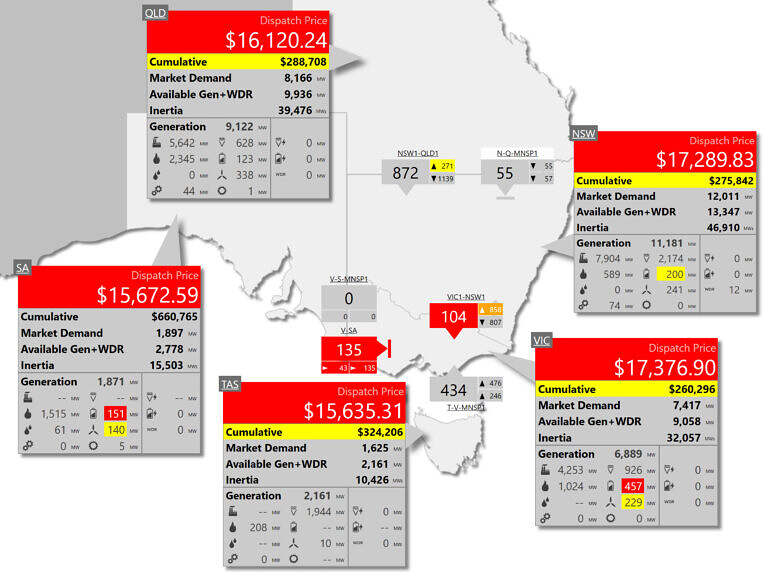
Over at WattClarity on Monday when every state had prices over $3,000 per MWh simultaneously, Dan Lee noted that this was extremely rare. Since 2008, there have only been 32 intervals when prices were above $1,000 in all five states at once and nine of the 32 occurred on Monday.
Then Tuesday was so much worse:
Record high electricity prices across the NEM. July 2024
Naturally the Sydney Morning Herald is blaming “aging coal plants”. Because we can’t get rid of coal fast enough, right? Somehow it’s a “harbinger of the price hikes” we’re facing “if aging fossil fuel generators are forced to stay open longer”. And, geniuses, if prices hit $17,000 a megawatt-hour when some coal power is down for a day, what happens when we get rid of coal entirely? Is that when Tinkerbell saves the day by turning Sydney Harbor into a giant battery, or when $17,000 prices become the new normal?
Somehow the unplanned outages of reliable coal plants create sky high prices, whereas the unplanned outages of wind and solar power create Utopia.
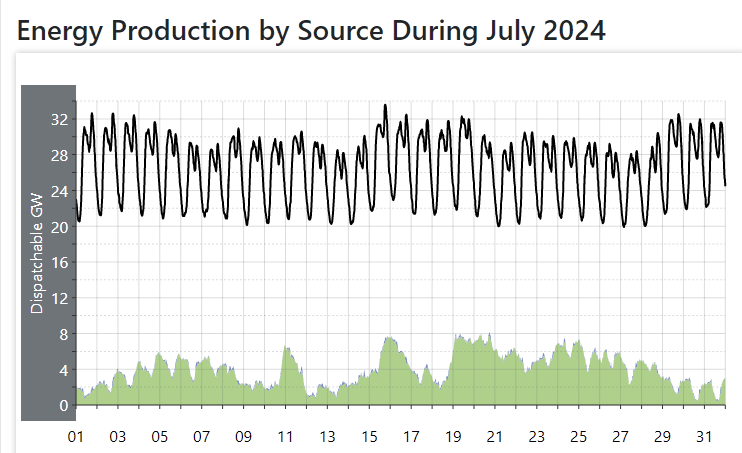
Not so coincidentally, the price spikes on July 31 2024 occurred when wind and solar generators were out:
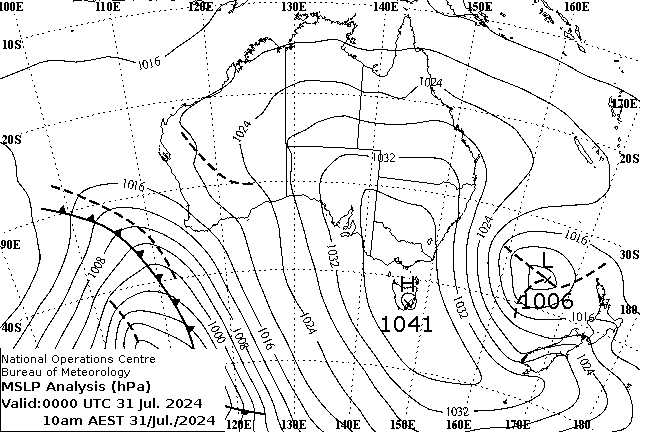
The price spikes were also boosted by the cold weather we aren’t supposed to be getting in our warmer world.
The synoptic chart for July 31 shows that old familiar pattern. One high pressure cell can ruin wind turbine production everywhere:
…
Caitlin Fitzsimmons of the Sydney Morning Herald blames the slow-down in new wind farm approvals for the dire situation. But another 1,000 wind turbines won’t save the day when there is no wind. More useless wind power is still useless, it just costs more.
Blame the capitalists!
Poor Giles Parkinson at Reneweconomy blames the price spikes on evil profiteering but worries the public will think it’s renewable generators fault. He can see that these prices are bad news for the image of the “transition”:
What we see here is naked greed, around an essential service…
Geoff Eldridge, from GPE NEMLog, says the average wholesale price across all NEM regions hit a jaw-dropping $16,419/MWh in the early evening on Tuesday. That smashes the previous record of $12,491 /MWh reached on July 14, 2022, at the height of the international fossil fuel crisis sparked by the invasion of Ukraine.
With a perfectly straight face he complains about competition being reduced as reliable generators are forced out of the market:
Renewables are supposed to challenge this and lower the price on wholesale markets by introducing competition. But as the number of fully dispatchable generators declines, competition at critical times has actually been reduced – at least for the time – and like seagulls around a box of chips, the market players dive in.
This, of course, is exactly what the “renewable transition” was subsidized to do — to force out the cheaper competition. So the more we transition the more expensive it will get:
And the problem is that in a hotly partisan energy debate, and a lop-sided and populist media disinterested in actual facts,it will be renewables that get the blame.
But he seems to realize it isn’t a free market, and in that he is correct. The regulators allowed giant conglomerate groups to own competing generation units, which means they can play these off one another. When they drive out coal power they win big in the rest of their portfolio.
Battery storage is supposed to throw a bit more competition into the market. But the problem is that many of these assets are now owned or contracted to the very same energy giants that control the rest of the generation. If anything, it’s made it easier for them to control prices and profits.
Predatory capitalism worked well for AGL. They were given Liddell coal plant for nothing in 2014, but wouldn’t sell it for $250 million in 2018. It was worth more dead than alive. Banker analysts explained that they wouldn’t sell AGL either, because if someone else kept Liddell running it would keep wholesale electricity prices down (which is bad for all the other generators). Liddell coal power was shut down in April last year. If it was still running, we might not have had these price spikes. Where was Giles Parkinson when Liddell was being given away, run into the ground, and then driven out of the market? He was cheering the rigged market on. Now it is coming back to bite him.
The last few days were some of the lowest wind power for the month. There was high demand, but it was not a record:
….
Paul McArdle at WattClarity drills through a few bidding details and says it appears there were more cheap bids than usual and the cold weather demand was a primary driver. But we will have to wait for the longer analysis that always occurs after these market disruptions.
Daily prices are on fire this week — the average wholesale prices for the last three days were about $250/MWh in NSW and Queensland, in the order of $300 in Victoria and Tasmania, and a shocking $675 for South Australia. That’s effectively 72 hours of wildly high prices. And even though the retail electricity providers will be hedged, the spot prices still feed through to the retail electricity bills sooner or later.
The Park fire Pyrocumulus cloud, seen from Highway 149 looking north, at 3:38PM on July 26, 2024. Photo by Anthony Watts.
The New York Times (NYT), in a July 30th story titled “How Did the Park Fire Get So Big, So Fast?” claims that “[h]eat has been breaking records all summer, and Dr. Williams said records will probably continue to fall over the next several years as the burning of fossil fuels continues to add greenhouse gases to the atmosphere.”
This is false. The article itself provides no data or citations to support this claim but rather relies on opinions from so-called climate experts who have no hands-on connection to the fire whatsoever.
Having spent 35 years in Chico, CA, the Park fire is one of three recent wildfires with which I have personal hands-on and boots on the ground experience. The other two were the Camp Fire in 2018, and the Dixie fire in 2021. All these fires affected me personally and the people around me.
Yet somehow NYT and their bevy of so-called experts think they can divine the cause and conditions that drove these fires from their offices from afar. In each case, NYT has blamed climate change as either a driver or contributor to these three fires without so much as a shred of proof. In fact, NYT contradicts their own claims in their article in the table of the top ten fires in California by acreage burned:
Climate change isn’t listed as a cause in any of them. However, that doesn’t stop the “experts” they interviewed for the story to try making a climate connection where none exists:
July 22, two days before the fire began, was Earth’s hottest day on record. June was the 13th consecutive month to break a global heat record. Some areas burned by the Park fire saw their single-hottest 30-day periods on record just before the blaze broke out.
Dr. Williams compared the dry conditions to those preceding California’s second-largest wildfire, the 2021 Dixie fire, which began during a drought and burned almost one million acres. The state has since emerged from drought, which makes the heat’s effect on fuels even more notable, he said.
“It was an exceptional heat wave, and an exceptional drying of the vegetation,” said Daniel Swain, a climate scientist at U.C.L.A. and the National Center for Atmospheric Research. Wetter winters led to less-severe fire seasons in 2022 and 2023. But extreme heat this summer, with more hot weather in the forecast, means “we’ve kiln-dried all that extra fuel,” Dr. Swain said.
The Park fire was started by arson, according to Cal Fire. The dry vegetation that allowed it to burn so quickly had a very clear fingerprint of climate change, Dr. Swain said.
By my observations, this sort of causality shoehorning (to coin a phrase) is becoming increasingly common among journalists and climate advocates as they strain to fit any weather event or catastrophe into the climate change narrative.
Swain’s claim of “a very clear fingerprint of climate change” on dry vegetation that fueled the Park fire is little more than his personal opinion. He offers no scientific citation or basis for his claim.
While there was indeed a heat wave prior to the Park fire, that had no bearing on the fire at all. The area where the fire ignited, Butte County California and the most-burned area in Tehama County are not in drought conditions according to the U.S. Drought Monitor for July 23rd – the day before the Park fire was ignited by a criminal arsonist.
So “climate change caused drought” and resultant abnormally dry conditions didn’t figure into the Park fire at all. The fire wouldn’t exist without the criminal act of arson. I would not be surprised at if the next episode of causality shoehorning is a story claiming “Climate Change Causes More Arsonists.”
The arson ignition point, in Chico’s Bidwell Park, is in the foothills of the Sierra Nevada. Just to the north of that point huge acreages of grassland and scrub brush exist. Combine that ignition with the sustained southerly winds that day of 20-25 mph, and it is no surprise that the fire rapidly spread north. Rick Carhart, the Public Information Officer for CalFire in Butte County and a Chico resident for decades, confirmed in a telephone interview that the area “had not naturally burned in several decades, and had no control burns to reduce fuel loads.” He added that these “high fuel loads, combined with the wind that day made a very aggressive fire.”
My colleague, Heartland Institute research fellow Linnea Lueken, published a scathing factual rebuttal last year of a case with The Sacramento Bee making similar but baseless claims like the NYT when they attempted to connect climate change to wildfires and their natural drivers, such as lightning. She writes:
The Intergovernmental Panel on Climate Change finds no climate signal, nor increasing trend, behind thunderstorms, or lightning occurrences. Also, NASA satellites have documented a global long-term decline in wildfires. NASA reports satellites have measured a 25-percent decrease in global lands burned since 2003.
Examining wildfires in California in particular, research shows massive wildfires have regularly swept through the state. Indeed, a 2007 paper in the journal Forest Ecology and Management reported that prior to European colonization in the 1800s, more than 4.4 million acres of California forest and shrub-land burned annually. As compared to the 4.4 million California acres that burned each year prior to European colonization, only 90,000 acres to 1.6 million California acres burn in a typical year now.
Clearly, there is no climate change driving component to California wildfires at all. If there were, fires in the present would be consuming much more than 4.4 million acres annually – but this isn’t happening. The simple fact is, Arsonists Are Responsible for More Wildfires than Climate Change. The intensity and coverage of wildfire varies greatly from year to year, as evidenced by the 2022 NYT story, Why California’s 2022 Wildfire Season Was Unexpectedly Quiet. A map of fires from year to year in the article demonstrates this well:
Of course, in that article they can’t resist blaming climate change, only providing cherry-picked data back to 1990 to bolster their claim, while completely ignoring the huge fires of the past.
The NYT believes, like some sort of diagnostic remote “telemedicine” call, that they and their experts can divine the climate connections to the fire from offices in New York and from so called “climate experts” sitting in their offices elsewhere who know better about what is going on than people with boots on the ground.
It is a shameful and obvious demonstration that the NYT cares more about furthering the climate agenda, than they do about reporting the facts.
Anthony Watts is a senior fellow for environment and climate at The Heartland Institute. Watts has been in the weather business both in front of, and behind the camera as an on-air television meteorologist since 1978, and currently does daily radio forecasts. He has created weather graphics presentation systems for television, specialized weather instrumentation, as well as co-authored peer-reviewed papers on climate issues. He operates the most viewed website in the world on climate, the award-winning website wattsupwiththat.com.