Guest Post by Willis Eschenbach
I do a lot of work with the CERES satellite dataset. An image of their data collection system is above. From their website:
The CERES project has advanced the state-of-the-art in Earth Radiation Budget (ERB) observations through improved accuracy of the CERES instruments and extensive use of coincident higher spatial resolution spectral imager measurements on both low-Earth orbit and geostationary platforms. CERES involves a high level of data fusion. During the CERES period, the team has processed data from 7 CERES instruments, 2 MODIS, 2 VIIRS and 20 geostationary imagers, all integrated to obtain climate accuracy in radiative fluxes from the top to the bottom of the atmosphere. Over 90% of the CERES data product volume involves two or more instruments.
However, recently, there have been claims in an analysis by Nikolov and Zeller (N&Z) that the IPCC is misusing the CERES satellite data. Now, I hate to write about this analysis for reasons I’ll get into, but as the saying goes, “Needs must when the Devil drives.”
The analysis is Nikolov & Zeller: Misrepresentation of Critical Satellite Data by IPCC, and it’s hosted over at Tallbloke’s Talkshop.
The reason I didn’t want to write about it is that I’ve had run-ins with Ned Nikolov and Karl Zeller before, and also with Roger Tattersall, AKA “Tallbloke”.
With N&Z, a while back they published a scientific paper using aliases. I figured it out, which wasn’t all that hard given that the aliases were Den Volokin and Lark Rellez. So I wrote to the editor pointing this out, and the fat was in the fire. Suffice it to say, they weren’t happy with me.
They also published an analysis claiming that gravity is what is keeping the atmosphere warmer than it would be given the distance of the Earth from the sun. And that, of course, isn’t physically possible … and I said so.
With Roger Tallbloke, I’m banned from commenting on his site, Tallbloke’s Talkshop. It started with him banning Joel Shore from his site for saying that N&Z’s gravity analysis violated the conservation of energy. From a post during that time:
Roger’s exact words to Joel were:
… you’re not posting here unless and until you apologise to Nikolov and Zeller for spreading misinformation about conservation of energy in their theory all over the blogosphere and failing to correct it.
Now, I have done the very same thing that Joel did. I’ve said around the web that the N&Z theory violates conservation of energy. So I went to the Talkshop and asked, even implored, Roger not to do such a foolish and anti-scientific thing as banning someone for their scientific views. Since I hold the same views and I committed the same thought-crimes, it was more than theoretical to me. Roger has remained obdurate, however, so I am no longer able to post there in good conscience.
Then, in a separate incident, I put up an actual proof that N&Z’s claim violated conservation of energy. I’m sure that didn’t endear me to N&Z. In the comments to that post, Rog got angry at me and banned me. I guess I’m double-banned.
So me commenting on an N&Z post hosted at Tallbloke’s Talkshop … well … let me just say there are forces at play and leave it at that.
To be fair, after someone pointed the N&Z out to me a week or so ago, I did get curious and started to take a quick look at the paper. I got a few paragraphs in, laughed, and moved on. Here’s why.
N&Z’s claim in the paper is that the IPCC is totally misrepresenting the CERES data by inverting it. From the opening of the paper:
We found out that the CERES global anomalies of reflected shortwave and outgoing longwave radiation have been multiplied by -1 in the computer code employed to generate Fig. 7.3. This caused inversion of the long-term trends of these key climate parameters. Dr. Matthew Palmer, one of the authors of Section 7.2.2, admitted in an email message that this trend inversion was done intentionally, but failed to provide a convincing justification for it.
When they said that, I immediately knew what had happened. Let me explain.
In the CERES datasets, generally all fluxes are positive in sign. So for example, in the CERES dataset the average value of TOA solar radiation heading towards the Earth is + 340 W/m2, and the average value of reflected solar heading away from the Earth is + 99 W/m2. Both are positive.
However, this is not the only convention in use. The IPCC, for example, considers energy fluxes heading towards the Earth as positive, and fluxes heading away from the Earth as negative. The logic behind this is that inward fluxes warm the Earth so they should be positive, and outbound fluxes cool the Earth so they should be negative. Fair enough.
So the IPCC would say that solar radiation is + 340 W/m2, and reflected solar radiation is – 99 W/m2. The outgoing radiation is negative.
The same is true about the upwelling longwave at the top of the atmosphere. The CERES data gives that as a positive value, + 240 W/m2 … but under the IPCC convention it’s a negative value, – 240 W/m2.
There’s nothing sacred about either of these conventions. Both are perfectly valid ways of doing business. For that matter, it would also be perfectly valid to consider fluxes headed towards the Earth as negative, and those going out away from the Earth as positive.
As long as you know which convention is in operation, it’s not a problem. For example, in CERES fashion, since all flows are positive, the net solar remaining after reflection is calculated as solar minus reflection.
But using the IPCC convention, where reflection is negative, the net solar remaining after reflection is calculated as solar plus reflection.
And when you understand and follow the convention in use, both give you the correct answer.
So after reading that small bit of their paper, I could already see where the misunderstanding lay. It was just different sign conventions. And since I didn’t want to write about it, I stopped reading the analysis right there, and I went on to other things.
However, today Anthony asked me to take a look at the paper because it seems to be causing a bit of a disturbance in the force. So it was “Once more into the breach, dear friends”, and I read it to the end. And near the end, to my surprise, they discussed their interaction with the authors, viz
We received a reply from Dr. Palmer on July 10, 2024, where he acknowledged that the reflected solar and outgoing thermal flux anomalies had intentionally been multiplied by -1. However, his explanation for this data manipulation was simply an expansion of the justification stated in the caption of Fig. 7.3 that invokes flux direction. Specifically, Dr. Palmer wrote:
“… reflected SW and outgoing LW are both defined as positive in the upward/outward direction. Therefore, for those timeseries we multiply by -1 so that they are expressed in a way that is consistent with the rest of the chapter. This means, for example, that a decrease in reflected SW means a relative GAIN of energy in the Earth system. Similarly, an increase in outgoing LW means a relative LOSS of energy in the Earth system. Note that in the figure we label these as “global solar flux anomaly” and “global thermal flux anomaly” rather than “reflected SW flux” and “outgoing LW flux”.”
Man, did I laugh when I read that. It said the exact same thing I’d already figured out was the problem. However, N&Z just blew him off saying:
As discussed above, this explanation makes no physical sense, because anomalies are always defined with respect to a chosen reference value and, therefore, have nothing to do with flux direction. Also, expressing a timeseries in terms of anomalies is not supposed to change the temporal trend of the original data.
Yeah … no. That’s not how it works. Sign conventions are just that, a convention. All the authors did, and rightly so, was to make their analysis consistent with IPCC conventions and more importantly, consistent with the model results they were comparing it to, by multiplying the outgoing flows of shortwave and longwave by -1. Totally legitimate, and in their case, totally necessary.
Anyhow, that’s N&Z, wrong again. However, my guess is that they won’t admit it, they’ll just keep on keeping on.
And that’s all I’m going to say on the N&Z claim. Here on our forested hillside with a tiny view of the Pacific Ocean six miles (ten km) distant to the west, the temperature has dropped and the fog is back. Saw a red fox scurrying by today looking for his lunch … life is good.
My best to all.
w.
I gotta say it: When you comment, please quote the exact words you are discussing. It avoids endless misunderstandings.
NB: Today at the time when this publishes, I’ll be ripping the innards out of a toilet and taking them to town to find a replacement … so my replies will be delayed.
via Watts Up With That?
August 1, 2024 at 12:04PM
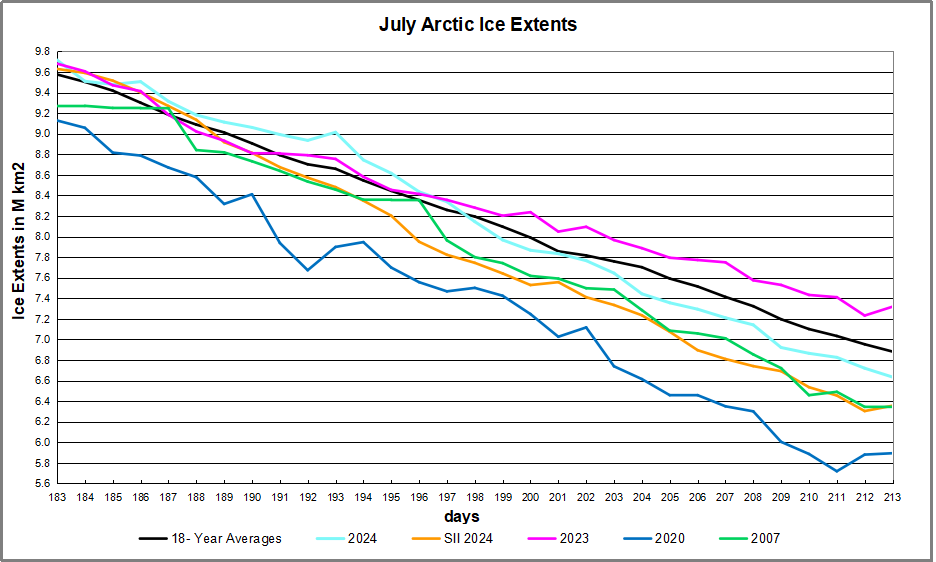
 The table below shows the distribution of Sea Ice on day 213 across the Arctic Regions, on average, this year and 2007. At this point in the year, Bering and Okhotsk seas are open water and thus dropped from the table.