Author: Iowa Climate Science Education

No, CNBC, Insurance Premiums Are Not Increasing Due to Climate Change

From ClimateREALISM

An article published on the CNBC website on July 29th made the claim in this headline: “Homeowners insurance premiums rose 21% last year. Climate change is partly to blame, experts say.”  The article goes on to say, “Experts say a rise in severe weather largely contributed to the increase, but it’s hard to tell how insurers are factoring climate risk into the cost of policies.”

This is false; several lines of data and research show that severe weather has been decreasing over the past several decades despite a modest warming of the climate.

The basis of the claim in the article is this:

Between May 2022 and May 2023, home insurance prices rose an average of 21% at renewal time, according to Policygenius.

A rise in catastrophic severe weather events contributed to this jump, experts say, and the rate of price increases is not expected to slow. As insurers face higher costs, they pass those along to consumers in the form of pricier premiums.

The first mistake they make is that a one-year period is not indicative of the influence of climate change. Climate operates on a much longer time scale spanning decades whereas weather operates on the short time scale found in days to a single year. What we experience on a day-to-day basis are weather events, not climate events. As has been said many times, weather is not climate. If during the same year there was actually less severe weather, it would not be related to climate change either. However, this is a choice that has been made to bolster the claims in the article.

The article itself contradicts the claim in the headline with this paragraph,

Though home insurance premiums jumped significantly in price last year, it isn’t a new phenomenon. To that point, between 2012 and 2021 the average premium rose from $1,034 to $1,411, according to the Insurance Information Institute.

Clearly insurance premium increases are not solely tied to weather in a single year.

The headline cites so-called experts in saying “climate change is partly to blame.” Sadly, not one of the people mentioned in the article has any climate expertise.

The data on severe weather compared to climate change is very clear. Many real world data sets show that there has been no increase in drought, or heatwaves; no increase in flooding; no increase in tropical cyclones and hurricanes; no increase in winter storms; and no increase in thunderstorms or tornadoes, or associated hail, lightning, and extreme winds from thunderstorms.

Further the Intergovernmental Panel on Climate Change (IPCC) has published research showing that severe weather has not made itself known in linkage to climate change. As can be seen from the Table 12.12 on Page 90 – Chapter 12 of the UN IPCC Sixth Assessment Report Emergence of Climate Impact Drivers (CIDs), there is no evidence of any increase or decrease, globally or by region, in the frequency, severity or extent of; frost, mean precipitation, river floods, heavy precipitation and pluvial floods, landslides, aridity, hydrological drought, agricultural or ecological drought, fire weather or wildfires, mean wind speed, severe wind storms or tornados, tropical cyclones or hurricanes, sand and dust storms, snow glacial or ice sheets, heavy snowfall and ice storms, hail, snow avalanche, relative sea levels, coastal floods, coastal erosion, marine heatwaves, ocean acidity, air pollution weather or radiation at earth’s surface.

The most compelling evidence though comes in terms of insurance losses related to severe weather. Clearly,  the trend in property losses has declined as the Earth has modestly warmed over the last several decades.

Since climate change is not causing increasingly extreme weather, it cannot be causing increasing insurance premiums; the data simply does not support that premise. Other factors must be at play. For example this article by the National Association of Realtors shows that two states with the highest propensity for hurricane impact, Florida and Louisiana, have the greatest increases in insurance rates Even though the number of major hurricanes hitting the United states is down over the past decade.

The likely factor is increasing coastal populations. People like to live by the ocean. The population of coastal counties in the United States has been growing, increasing by 40.5 million people, or about 46%, from 1970 to 2020. This is despite the fact that coastal counties make up less than 10% of the total land area, but account for 39% of the total population. The population is projected to increase by over 10 million people, or 8+% into the 2020s.

With more people on coastlines, the risks to life and property increase, even though there’s been no trend in coastal storms. The insurance increases appear to be driven mostly by demographic changes, not climate.

There is no evidence that climate change is worsening the extreme weather events impacting the nation. It was irresponsible for CNBC to publish this article, as it has many inaccuracies and misleading claims. But that seems to be “par for the course” in the media these days.

Anthony Watts

Anthony Watts is a senior fellow for environment and climate at The Heartland Institute. Watts has been in the weather business both in front of, and behind the camera as an on-air television meteorologist since 1978, and currently does daily radio forecasts. He has created weather graphics presentation systems for television, specialized weather instrumentation, as well as co-authored peer-reviewed papers on climate issues. He operates the most viewed website in the world on climate, the award-winning website wattsupwiththat.com.

via Watts Up With That?

https://ift.tt/I9106jp

August 1, 2024 at 08:08AM

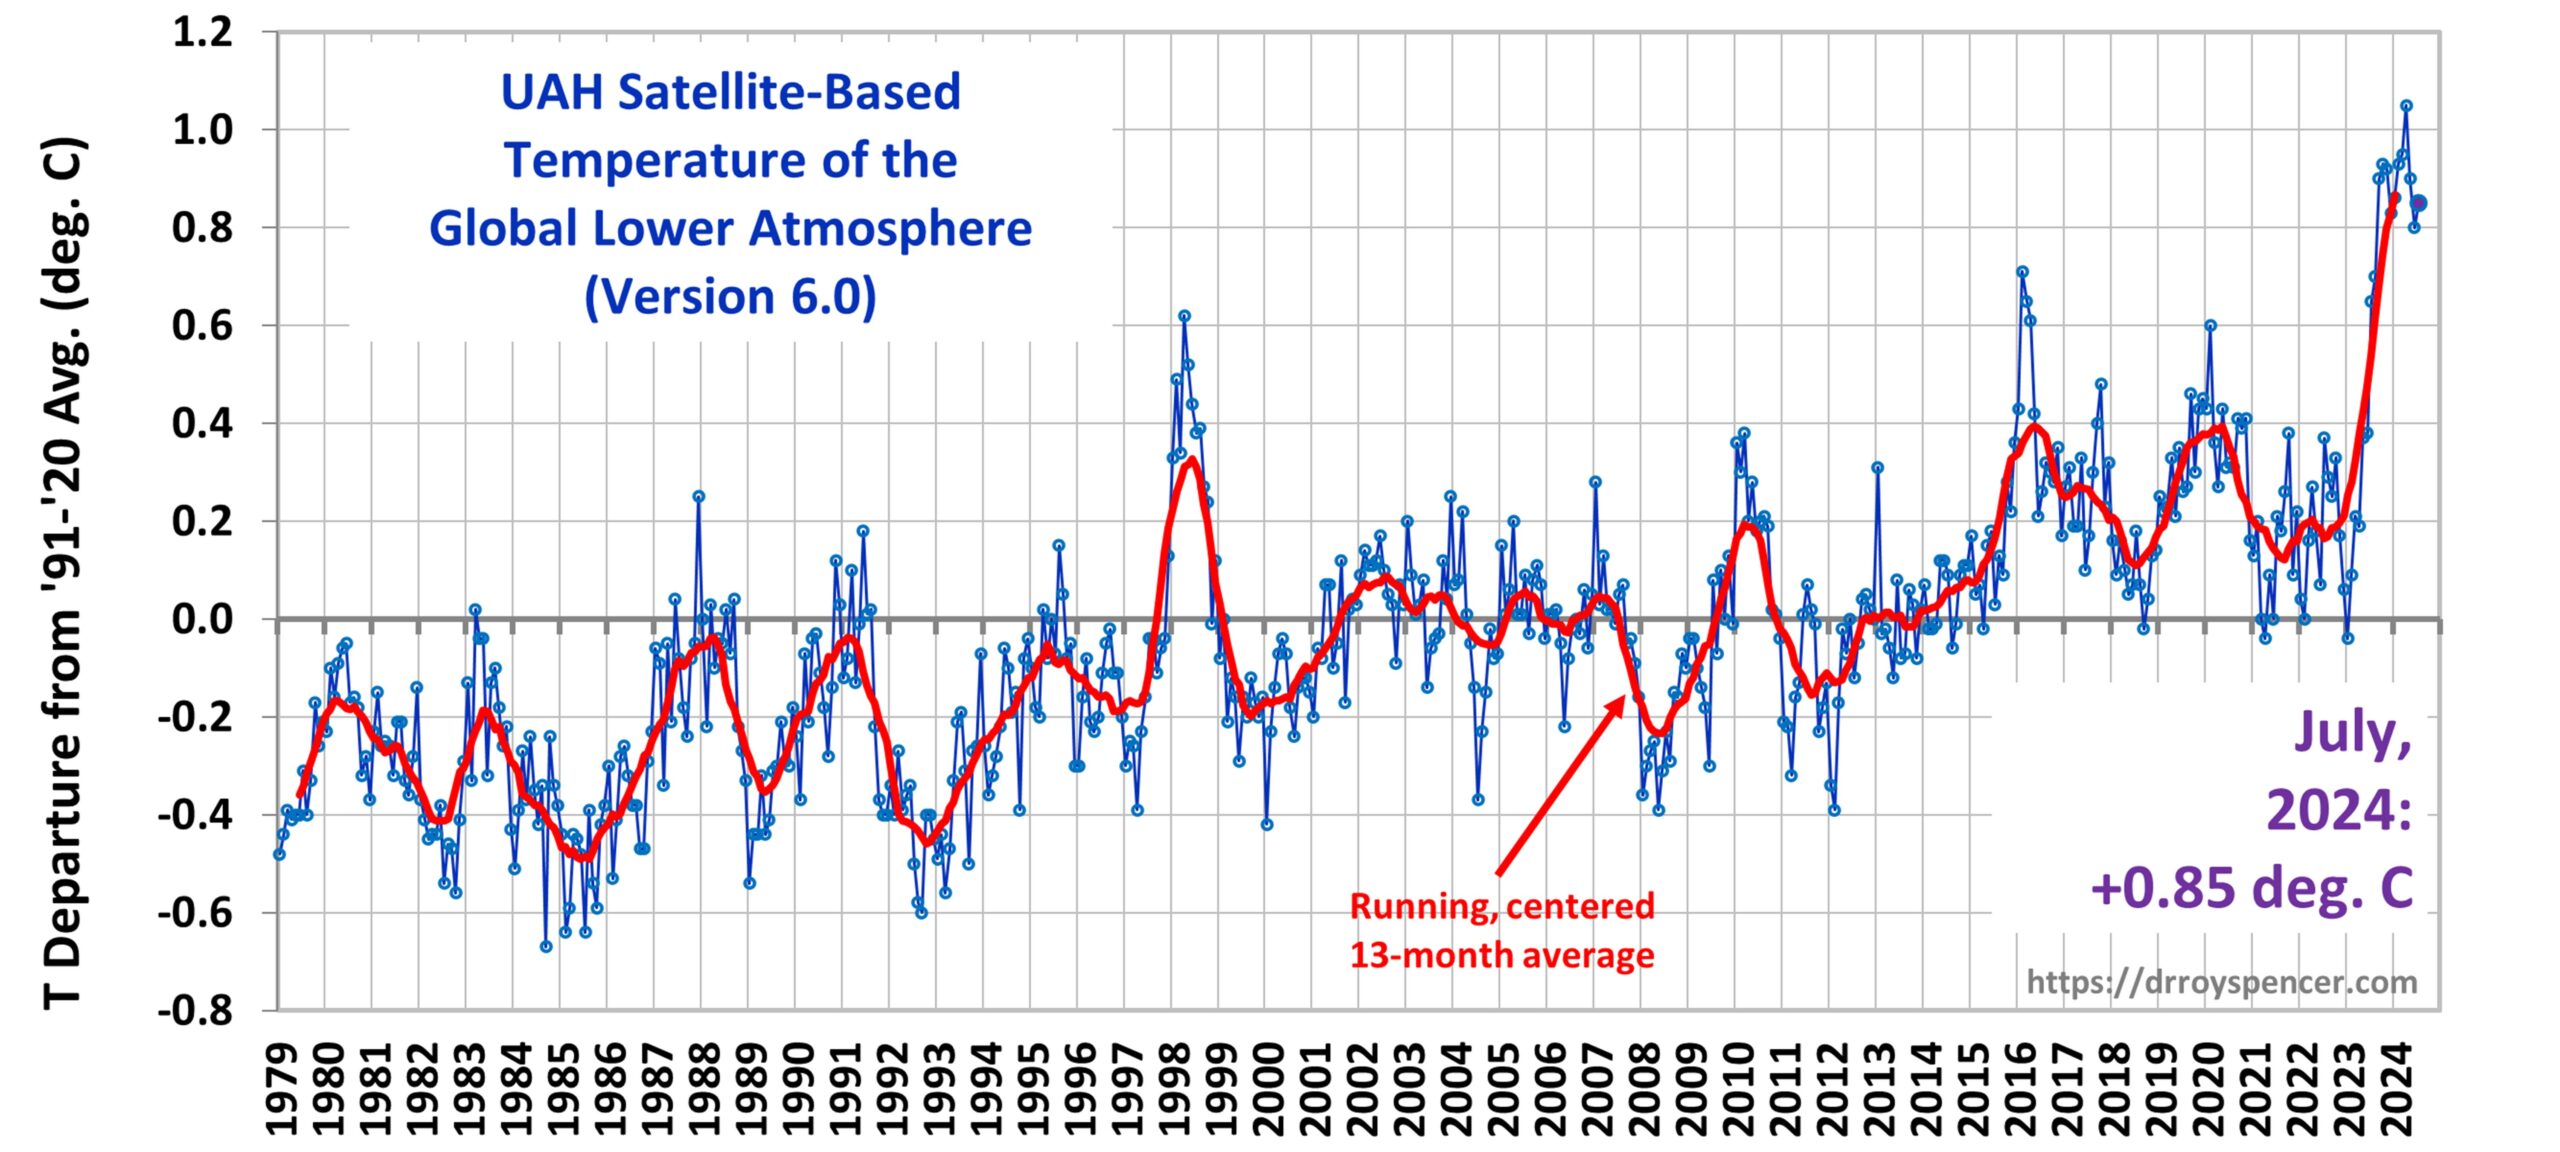
UAH Global Temperature Update for July, 2024: +0.85 deg. C

The Version 6 global average lower tropospheric temperature (LT) anomaly for July, 2024 was +0.85 deg. C departure from the 1991-2020 mean, up from the June, 2024 anomaly of +0.80 deg. C.

The linear warming trend since January, 1979 now stands at +0.15 C/decade (+0.13 C/decade over the global-averaged oceans, and +0.21 C/decade over global-averaged land).

The following table lists various regional LT departures from the 30-year (1991-2020) average for the last 19 months (record highs are in red):

YEAR MO GLOBE NHEM. SHEM. TROPIC USA48 ARCTIC AUST
2023 Jan -0.04 +0.05 -0.13 -0.38 +0.12 -0.12 -0.50
2023 Feb +0.09 +0.17 +0.00 -0.10 +0.68 -0.24 -0.11
2023 Mar +0.20 +0.24 +0.17 -0.13 -1.43 +0.17 +0.40
2023 Apr +0.18 +0.11 +0.26 -0.03 -0.37 +0.53 +0.21
2023 May +0.37 +0.30 +0.44 +0.40 +0.57 +0.66 -0.09
2023 June +0.38 +0.47 +0.29 +0.55 -0.35 +0.45 +0.07
2023 July +0.64 +0.73 +0.56 +0.88 +0.53 +0.91 +1.44
2023 Aug +0.70 +0.88 +0.51 +0.86 +0.94 +1.54 +1.25
2023 Sep +0.90 +0.94 +0.86 +0.93 +0.40 +1.13 +1.17
2023 Oct +0.93 +1.02 +0.83 +1.00 +0.99 +0.92 +0.63
2023 Nov +0.91 +1.01 +0.82 +1.03 +0.65 +1.16 +0.42
2023 Dec +0.83 +0.93 +0.73 +1.08 +1.26 +0.26 +0.85
2024 Jan +0.86 +1.06 +0.66 +1.27 -0.05 +0.40 +1.18
2024 Feb +0.93 +1.03 +0.83 +1.24 +1.36 +0.88 +1.07
2024 Mar +0.95 +1.02 +0.88 +1.35 +0.23 +1.10 +1.29
2024 Apr +1.05 +1.25 +0.85 +1.26 +1.02 +0.98 +0.48
2024 May +0.90 +0.98 +0.83 +1.31 +0.38 +0.38 +0.45
2024 June +0.80 +0.96 +0.64 +0.93 +1.65 +0.79 +0.87
2024 July +0.85 +1.02 +0.68 +1.06 +0.77 +0.67 +0.01

The full UAH Global Temperature Report, along with the LT global gridpoint anomaly image for July, 2024, and a more detailed analysis by John Christy, should be available within the next several days here.

The monthly anomalies for various regions for the four deep layers we monitor from satellites will be available in the next several days:

Lower Troposphere:

http://vortex.nsstc.uah.edu/data/msu/v6.0/tlt/uahncdc_lt_6.0.txt

Mid-Troposphere:

http://vortex.nsstc.uah.edu/data/msu/v6.0/tmt/uahncdc_mt_6.0.txt

Tropopause:

http://vortex.nsstc.uah.edu/data/msu/v6.0/ttp/uahncdc_tp_6.0.txt

Lower Stratosphere:

http://vortex.nsstc.uah.edu/data/msu/v6.0/tls/uahncdc_ls_6.0.txt

via Roy Spencer, PhD.

https://ift.tt/zNkZnib

August 1, 2024 at 05:57AM

Austerity may kill Labour’s green superpower ambitions at the first hurdle

By Paul Homewood


h/t Robin Guenier

A bit of a curate’s egg this time from AEP!


image

Labour’s heady bid to make Britain a “clean energy superpower” has already run into cold reality, barely days into the Starmer-Reeves era.

The Government has nudged up the operating buffer for this year’s AR6 auction of fixed offshore wind contracts to £1.1bn but this is still not nearly enough to underpin the goal of quadrupling offshore wind to 60 gigawatts (GW) by 2030. Time is already running out, given the six to eight-year lag time for offshore wind farms.

Unless this buffer is backed by serious money, Labour has no chance of hitting its target of 100pc clean power in six years. It is the test case for the credibility of Ed Miliband, the plenipotentiary of Energy Security and Net Zero.

Britain’s policy of covering the wind auction budget by tacking it on to electricity bills is untenable and destructive now that wind is the backbone of the system, and electrification is the holy grail. The money has to come from the global capital markets, drawing on the Government’s blue chip credit rating.

The offshore wind auction last year failed because the maximum strike price was set too low for the world market, at the time convulsed by commodity inflation, post-Covid bottlenecks, and rocketing interest rates.

Green investment is capital expenditure-intensive and highly sensitive to rates. It wins later with low operating costs, but first you must get over the hump.

Nobody turned up to bid for the AR5 offshore round in 2023, leaving a gaping hole in the UK’s energy strategy. The UK has wasted a year. It must now lure back foreign wind companies tempted by America’s Inflation Reduction Act, Europe’s Green Deal and Asia’s offshore expansion.

Energy consultants ICIS says the state must secure a total of 33GW in this year’s auction and next (AR7) to meet its 2030 targets. The funding may need to be three times greater to lever the necessary scale.

A £1.1bn budget will deliver around 6GW in this year’s round. “We need at least 9GW. The Government has got to get this right,” said Giles Dickson, head of WindEurope.

Let us clear up one confusion. The AR6 auction budget is not a subsidy. It is the operating balance sheet that allows the state to manage contracts for difference (CfD).

The state earns an arbitrage profit or loss depending on whether the market price of electricity is above or below the CfD strike price. The Treasury should make money on the new fixed-base auctions. Floating wind turbines are another story.

The AR6 round is the first hurdle. There are others. The UK must compete with the whole world for a tiny fleet of vessels needed to build a wind farm. A new turbine installation ship costs $330m (£260m), or $220,000 a day to rent. None are built in Europe.

Only 52 installation vessels of all kinds exist. Few can handle new 14 MW turbines, let alone the 20 MW monsters on the way. BLIX Consultancy says there will be an acute shortage of both installation vessels and cable-laying vessels by the end of this decade as the world’s offshore rush accelerates.

A new report by the Royal Academy of Engineering says every lever must be pulled if Labour is to come close to its clean-power deadline. Britain’s four remaining gas-cooled nuclear reactors, all facing closure by 2028, must be kept going.

The new nuclear plant at Hinkley Point C must come online this decade (still possible). The “greenlighting” of carbon capture for gas and biomass plants, plus a little green hydrogen, could add up to 5GW of clean power by 2030.

The first 1.8GW cable of the Xlinks project bringing renewable energy from Morocco to Cornwall must be delivered by 2030. It combines Sahara solar in the day with coastal convection wind in the evening, and battery back-up, to deliver base load power.

Xlinks is now deemed a Nationally Significant Infrastructure Project (NSIP), cutting through planning obstacles. The full 3.6GW project will deliver 8pc of the UK’s power.

The UK will have 8.8GW of back-up from interconnectors to Europe once the Viking Link to Denmark is fully up and running, effectively giving the UK access to Norwegian hydro and French nuclear power.

The first of the four EGL cables bringing power from Scotland to England must be completed by its target date of 2029. It brings 2GW into play and starts to reverse the policy lunacy of compensating Scottish wind farms forced to curtail power generation for lack of cables.

The Miliband plan will fail if it continues to take 14 years to put in a new transmission line. The Electricity Networks Commissioner says this must be halved to seven years. Reforms in northern Sweden have cut the time to nearer five years. It can be done.

The current 700GW queue for grid connections must be whittled down by ending the first-come-first-serve system, which allows zombie requests to clog up the system.

The UK’s “great grid upgrade” is well under way and is further advanced than in much of Europe. Labour will nevertheless have to invoke NSIP fast-track powers to sweep aside local objections and build “electro-highways” – i.e. pylons – against simmering public resistance.

The report said this means ruffling a lot of feathers, and will test democratic and social consent.

One can discern a route to clean power by 2030 once you add in smart technology to manage demand. But I struggle to see how the UK can cover a three-week dunkelflaute doldrum at the coldest and darkest point of mid-winter.

There will not be enough green hydrogen on the market by then to plug the hole. We will need a reserve of gas-fired plants into the early 2030s.

Furthermore, it is counter-productive to bend every sinew to achieve that particular target. Rushing to decarbonise the last and toughest 10pc will push up electricity costs, ceteris paribus. That clashes with the more urgent goal of electrifying all transport and heat. Best is the enemy of good.

But if you are going to set a vertiginous target and if you hope to mobilise the nation with the elan of the vaccine task force, you had better not come crashing down at the first fence.

https://www.telegraph.co.uk/business/2024/07/31/austerity-kill-labour-green-superpower-ambition-first-hurdl/


Let’s try and cut through to some of the more important points:

  • AEP for some reason seems think there is a race to hit the 100% clean energy target by 2030. Other than the fact that it was set by the idiot Miliband, there is no earthly reason why we should aim for 2030 or any other year, or at all for that matter. The country won’t collapse if we don’t hit the target.

What matters is that the UK pursues an energy policy that makes sense, is affordable and works, which Miliband’s plan certainly won’t.

  • His headline sums it up very well. Miliband’s crazy plan will cost hundreds of billions, money we plainly have not got. It has nothing to do with “austerity”, which I have always thought of a stupid term anyway. The country could never afford the plan regardless of how well the economy was doing.

image

  • AEP believes that the current system of adding CfD subsidies on to energy bills is wrong:

“Britain’s policy of covering the wind auction budget by tacking it on to electricity bills is untenable and destructive now that wind is the backbone of the system, and electrification is the holy grail. The money has to come from the global capital markets, drawing on the Government’s blue chip credit rating.”

He seems to have finally woken up to just of shockingly expensive offshore wind actually is. However his solution of simply adding to public debt instead in order to finance more wind farms ignores the reality that taxpayers will sooner or later have to pay it all back.

  • AEP misleads readers when he says:

“Let us clear up one confusion. The AR6 auction budget is not a subsidy. It is the operating balance sheet that allows the state to manage contracts for difference (CfD).

The state earns an arbitrage profit or loss depending on whether the market price of electricity is above or below the CfD strike price. The Treasury should make money on the new fixed-base auctions. Floating wind turbines are another story.”

At current market prices, the AR6 budget is definitely a subsidy. While we have no idea what fossil fuel prices may be in ten years time, what we do know is that AR6 will lock in higher electricity prices than now for many years to come. It is grossly misleading for him not to mention this fact.

  • AEP rightly questions whether it is even logistically possible to build all the offshore wind needed:

“The AR6 round is the first hurdle. There are others. The UK must compete with the whole world for a tiny fleet of vessels needed to build a wind farm. A new turbine installation ship costs $330m (£260m), or $220,000 a day to rent. None are built in Europe.

Only 52 installation vessels of all kinds exist. Few can handle new 14 MW turbines, let alone the 20 MW monsters on the way. BLIX Consultancy says there will be an acute shortage of both installation vessels and cable-laying vessels by the end of this decade as the world’s offshore rush accelerates.”

image

  • Finally he claims that “One can discern a route to clean power by 2030 once you add in smart technology to manage demand.” . But then in the next breath says “But I struggle to see how the UK can cover a three-week dunkelflaute doldrum at the coldest and darkest point of mid-winter.”

It is, of course, the hopeless intermittency of wind power that makes Miliband’s entire plan a fairy tale. Even AEP belatedly accepts that green hydrogen will be of little help, and interconnectors cannot be relied on either.

Given all of this, where is the sense in wasting hundreds of billions on upgrading the grid, building wind farms and carbon capture?

via NOT A LOT OF PEOPLE KNOW THAT

https://ift.tt/c27ICvA

August 1, 2024 at 05:30AM

Earlier Forecast Of “A Summer From Hell” in Germany Just Isn’t Materializing. July Comes In Near Normal!

From the NoTricksZone

By P Gosselin

After a preliminary tabulation of data collected from its approx. 2000 stations across the country, the results of Germany’s, DWD national weather service in Offenbach show that earlier dramatic predictions of a “hellish summer” have yet to come true.  

German annual rainfall anomaly. Germany’s been getting wetter – not drier. Image: DWD. 

False alarmist predictions

In March, 2024, “experts” like biologist Mark BeneckeIs warned that climate change “was coming to a head this summer” for Germany, predicting “unprecedented heat” in 2024.

June in Germany came in near normal, and now according to the DWD, July 2024 has also been “rather variable , with consistent summer weather simply refusing to materialize.”

The brief periods of warm weather quickly got interrupted by showers and thunderstorms.

Slightly warmer than normal

The mean temperature in July 2024 (preliminary) was 18.9°C, or 0.6°C warmer than the 1991 to 2020 reference period mean of 18.3 °C. The start of the month was rather cool and autumnlike.

The peak value was recorded at the Bad Muskau station (Saxony), where it reached 34.8°C on July 10.

On July 30th, temperatures plummeted again at night and the nationwide low of 3.8 °C, recorded in Deutschneudorf-Brüderwiese (Saxony).

Few warm nights

Tropical nights (when lows do not drop below 20.0 °C) were the exception rather than the rule and only occurred in small numbers on the Upper Rhine, in Lower Bavaria, Saxony and the greater Berlin area. Earlier reports warned that German cities like Hamburg would see a sharp increase in warm tropical nights that would make sleep more difficult. So far there hasn’t been one such night in Hamburg this summer.

Average rainfall

“Experts” also warned that Germany would see more drought in the summer as climate warming progresses. But this summer so far has been wetter than normal. According to the DWD, July saw 88 liters of rain per square meter. Compared to the climate reference period from 1991 to 2020 (87 l/m²), July 2024 was practically dead-on average.

More sunshine

In terms of sunshine in July, the country saw a mean of of 237 hours in July, which was only slightly above average compared to the 1991-2020 climate reference period (226 hours). That probably helped to make the month a bit warmer than average.

via Watts Up With That?

https://ift.tt/SxcP9hO

August 1, 2024 at 04:04AM