Author: Iowa Climate Science Education

Utah’s The Independent is Right, Climate Activism Ignores or Harms the World’s Poor

From ClimateREALISM

By Linnea Lueken

The Independent, a news site out of Southern Utah, ran an article recently titled “Fight Climate Change, Ignore the Poor,” in which writer Howard Sierer claims climate change activism neglects the needs of the poor in favor of their preferred policy goals. This is true. Anti-growth and green policies do far more harm than good for the poorest people in the world by stifling their access to cheap reliable energy.

Sierer reports that the G-20 organization has called for $3 trillion per year in spending for developing nations, however more than half of that is supposed to be earmarked for climate, sustainability, and related infrastructure, with the rest going towards food and medical technology. Sierer points out that it doesn’t make much sense, “given the realities on the ground in many developing countries, places where opportunity is limited by a lack of the cheap and plentiful energy that allowed rich nations to develop.”

“Climate Change activists try to paper over these realities by arguing that poverty and climate change are inextricably linked,” Sierer continues, noting that time and again studies have shown “spending on core development priorities would help much more and much faster per dollar spent than applying funds to climate.”

He makes the point that investments on things like energy access, clean water, and medical infrastructure would help people right now, and improve weather resilience, but investments focused on cutting emissions “won’t deliver noticeably different outcomes for a generation or more, if ever.”

Sierer’s analysis is completely correct, backed up by research published by the Copenhagen Consensus Center, and by reporting on the ground by farmers in places like Africa, where a large portion of the population across the continent’s various nations live without consistent or reliable energy.

In the Climate Realism post, “Wrong, BBC, the Popular Kenyan Farmer Is Right, There Is No Climate Emergency, Africa Does Need Fossil Fuels,” I take a look at one farmer who has been leading the fight for energy access in his community. The climate activists at the BBC attempted to write a hit piece on him in an attempt to drive attention away from the real issues Kenyan subsistence farmers are facing, and the realistic solutions to their problems. The farmer, Jusper Machogu, lives in a poor area, and advocates for the modernization of farming for his family and neighbors. He is critical of “green” farming practices that lower yields and involve greater labor on the farmers’ part.

Modern synthetic fertilizers and fossil-fuel powered equipment have already begun to help African nations’ food production over time, reducing hunger and malnutrition, as discussed here, here, and here. Similarly, oil exploration and development is gradually increasing in African countries, as discussed here and here. This is despite the efforts of green NGOs and financial institutions which try to discourage development on the dark continent.

Not to mention, electricity and indoor heating that is made possible by fossil fuels drastically reduces the need for cooking and heating fuels like wood, crop waste, and dung, all of which are commonly used in poor nations. The indoor burning of wood, dung, and crop waste produces poor indoor air quality and results lung and heart ailments – leading causes of death in poor countries.

The poor of Africa and in other impoverished, energy-starved areas around the world are not clamoring for decarbonization, they are asking for reliable energy and the products and services and infrastructure it makes possible.

Sierer ends his article by explaining that despite more than $12 trillion spent on renewable worldwide, “global greenhouse gas emissions grew to an all-time high in 2023, with consumption of coal, oil, and natural gas each near record levels as worldwide energy demand continues to grow.”

This means that despite trillions in investments so far, there has been no identifiable benefit. Think what benefits those trillions could have delivered if devoted to traditional development, including modern energy infrastructure, in the world’s poorest countries.

Sierer points out that while getting rid of fossil fuels may result in some nebulous, distant supposed benefits, none of which have been proven, “the costs and disruption of rapid decarbonization are immediate and substantial.”

The Independent should be applauded for running this article. Sierer’s analysis hits the nail on the head that climate activism is more likely to be harming the world’s poor rather than helping them.

via Watts Up With That?

https://ift.tt/5t9TJqW

July 25, 2024 at 08:01PM

Electrification Without the Infrastructure

By Jonathan Lesser

As state and federal policies mandate the electrification of virtually all end uses to reduce carbon emissions from fossil fuels. For example, 18 states have adopted California’s Advanced Clear Car II rules requiring increasing percentages of new vehicle sales to be EVs, reaching 100% for the 2035 model year. In 2019, New York City enacted Local Law 97, which requires all residential buildings larger than 25,000 square feet to convert to electricity by 2035. Other states, such as New Jersey seek to convert all residential heating to electricity.

Together, mandates for electric vehicles (EVs) and electrification of space and water heat will likely double electricity consumption and peak demand. Coupled with policies that mandate supplying the nation’s electricity with zero-emissions resources, notably intermittent wind and solar power, not only will electricity prices continue to increase but the ability to meet consumers’ increased demand will become more problematic.

One would assume that mandates requiring consumers to switch to electricity would recognize the need for the additional infrastructure needed to meet increased demand. One would be wrong. Not just the additional generating resources to replace the coal and natural gas plants being shuttered, but also the new transmission lines, transformers, and upgraded distribution lines that will be needed to handle the increased loads, especially when demand peaks, such as in the early evening hours.

That infrastructure will be costly. The infrastructure needed for an all-EV future alone will likely cost between$2 and $4 trillion. Additional infrastructure to handle increased demand from switching space and water heat to electric heat pumps, as policymakers have proposed, will drive costs even higher.

The OPEC oil embargoes of the 1970s clearly demonstrated the link between energy prices and economic growth. By increasing the cost to produce most goods and services, the embargoes exacerbated inflation and caused the U.S. economy to fall into recession. The same relationship holds for electricity, especially as electricity becomes the “fuel” for more end uses: higher electric prices mean reduced economic growth, leading to a lower standard of living and greater economic hardship for consumers.

Among the nation’s electric grid operators, the twin policies of forcing greater electrification and requiring it to be met primarily with intermittent wind and solar generation are creating concerns that reliability will suffer, leading to widescale blackouts. For example, the New York Independent System Operator estimates that it will need almost 30,000 MW – roughly the size of 30 nuclear plants – of “Dispatchable Emissions-free Resources” by 2030. Although NYISO states that DEFRs are “not yet available on a commercial scale,” in fact, they don’t exist. Assuming a non-existent generating technology will be invented, commercialized, and deployed on a large scale in just six years is a technological and economic fantasy.

Hence, to address the lack of needed electric infrastructure, instead policymakers plan to restrict access to the electricity they have decreed consumers must use. The idea is to “manage” electricity demand rather than build the infrastructure necessary to allow consumers access to the electricity they need when they need it.

For residential customers the mechanisms to do so include time-of-use pricing, akin to the “surge” pricing used by Uber, which raises prices when demand is greatest; and direct load control, whereby utilities control when and how much consumers can use their large electric-consuming appliances. Home EV chargers will be the largest electricity users for many households and as they proliferate, they will impose the greatest demand on local grids. Another idea is for local utilities to use EVs as resources – draining EV batteries when the utility requires additional electricity to meet demand.

For large commercial and industrial customers, it includes interruptible contracts, whereby the local utility or grid operator can shut off the customer’s electricity for a specified duration in exchange for a lower electricity price.

Electricity consumption can be “managed” or even reduced by restricting consumers’ access to it or by charging prohibitively high prices when they most want that access. But doing so has a real economic cost, which policymakers have ignored.

The result will be greater consumer inconvenience, higher costs, lower economic growth, and greater economic hardship. While some environmentalists may consider such an outcome a “feature” and not a “bug,” presumably most consumers will not.

Jonathan Lesser is a senior fellow with the National Center for Energy Analytics and the president of Continental Economics. This article is adapted from a forthcoming report on electric planning and infrastructure.

This article was originally published by RealClearEnergy and made available via RealClearWire.

via Watts Up With That?

https://ift.tt/KJYsxeg

July 25, 2024 at 04:01PM

Paying the price for Great British Energy

By Paul Homewood


image

While Rachel Reeves and Sir Keir Starmer are warning of a “difficult” autumn Budget to deal with the “crisis” in the public finances, the Government is getting on with the business of spending vast sums of taxpayers’ money on its pursuit of net zero.

Speaking at the launch of the new state-run Great British Energy, Sir Keir unveiled a partnership between the company and the Crown Estate to speed up the construction of offshore wind projects, including an ominous pledge to make “necessary changes” to the planning system to rush through the construction of pylons. It is not exactly an encouraging prospect.

Ed Miliband, the Net Zero and Energy Security Secretary, has also not been shy about admitting that this represents the Government taking a far more explicitly interventionist approach to the economy. GB Energy is intended to act as a “catalyst” for private sector investment, with the hope that a taxpayer stake of £8.3 billion will attract £60 billion of funding from other investors. But by taking stakes in renewable energy projects, it will expose taxpayers directly to the success or failure of these schemes.

If these projects were economically viable, would the private sector itself not be enthusiastic about supporting them without a partnership with Government or considerable taxpayer support? But the last government renewables auction round saw no bids from offshore wind developers, with complaints that the existing subsidies were not generous enough.

Mr Miliband said that this is a “Government in a hurry on behalf of the British people”. It would be better off slowing down. Even Labour seems to be unclear about whether these initiatives will indeed benefit the public through lower bills, despite claims about new renewables projects boosting energy security.

There will be considerable scepticism about this point, with the Resolution Foundation among others arguing that the rush to net zero could add hundreds of pounds to household bills.

Doubts have also been raised about the Government’s wider aim of decarbonising the grid by 2030. Many experts consider that it is unachievable, at any price. But instead of listening to criticism, ministers are ploughing ahead with an ideological approach that could cost British voters and industry dearly. They cannot say they haven’t been warned.

https://www.telegraph.co.uk/news/2024/07/25/paying-the-price-for-great-british-energy/

via NOT A LOT OF PEOPLE KNOW THAT

https://ift.tt/qzoajdh

July 25, 2024 at 03:53PM

Tropics, SH Lead Oceans Cooler June 2024

The best context for understanding decadal temperature changes comes from the world’s sea surface temperatures (SST), for several reasons:

  • The ocean covers 71% of the globe and drives average temperatures;
  • SSTs have a constant water content, (unlike air temperatures), so give a better reading of heat content variations;
  • Major El Ninos have been the dominant climate feature in recent years.

HadSST is generally regarded as the best of the global SST data sets, and so the temperature story here comes from that source. Previously I used HadSST3 for these reports, but Hadley Centre has made HadSST4 the priority, and v.3 will no longer be updated.  HadSST4 is the same as v.3, except that the older data from ship water intake was re-estimated to be generally lower temperatures than shown in v.3.  The effect is that v.4 has lower average anomalies for the baseline period 1961-1990, thereby showing higher current anomalies than v.3. This analysis concerns more recent time periods and depends on very similar differentials as those from v.3 despite higher absolute anomaly values in v.4.  More on what distinguishes HadSST3 and 4 from other SST products at the end. The user guide for HadSST4 is here.

The Current Context

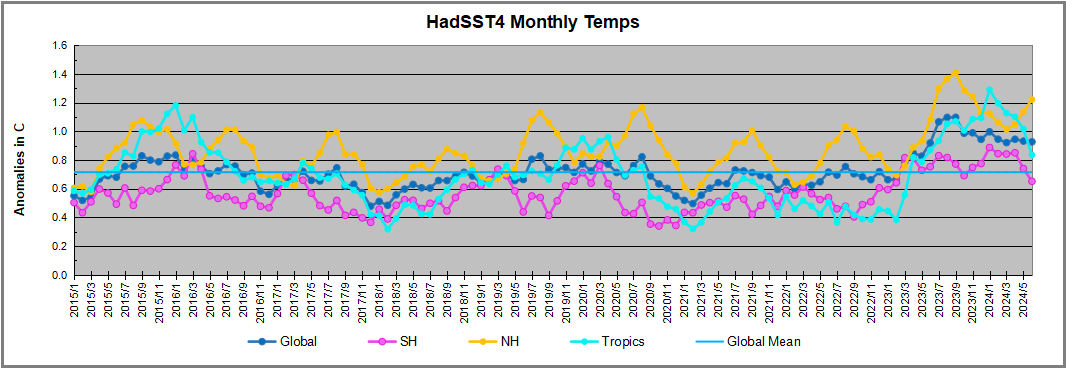
The chart below shows SST monthly anomalies as reported in HadSST4 starting in 2015 through June 2024.  A global cooling pattern is seen clearly in the Tropics since its peak in 2016, joined by NH and SH cycling downward since 2016.
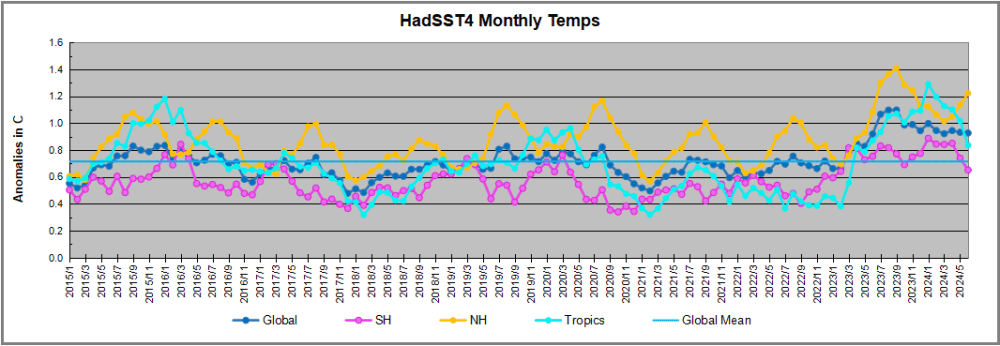
 

Note that in 2015-2016 the Tropics and SH peaked in between two summer NH spikes.  That pattern repeated in 2019-2020 with a lesser Tropics peak and SH bump, but with higher NH spikes. By end of 2020, cooler SSTs in all regions took the Global anomaly well below the mean for this period.  

Then in 2022, another strong NH summer spike peaked in August, but this time both the Tropic and SH were countervailing, resulting in only slight Global warming, later receding to the mean.   Oct./Nov. temps dropped  in NH and the Tropics took the Global anomaly below the average for this period. After an uptick in December, temps in January 2023 dropped everywhere, strongest in NH, with the Global anomaly further below the mean since 2015.

Then came El Nino as shown by the upward spike in the Tropics since January 2023, the anomaly nearly tripling from 0.38C to 1.09C.  In September 2023, all regions rose, especially NH up from 0.70C to 1.41C, pulling up the global anomaly to a new high for this period. By December, NH cooled to 1.1C and the Global anomaly down to 0.94C from its peak of 1.10C, despite slight warming in SH and Tropics.

In January 2024 both Tropics and SH rose, resulting in Global Anomaly going higher. Since then Tropics have cooled from a  peak of 1.29C down to 0.84C.  SH also dropped down from 0.89C to 0.65C. NH lost ~0.4C as of March 2024, but has risen 0.2C over the last 3 months Despite that upward NH bump, the Global SST anomaly cooled further.  The next months will reveal the strength of 2024 NH warming spike, which could resemble summer 2020, or could rise to the 2023 level.

Comment:

The climatists have seized on this unusual warming as proof their Zero Carbon agenda is needed, without addressing how impossible it would be for CO2 warming the air to raise ocean temperatures.  It is the ocean that warms the air, not the other way around.  Recently Steven Koonin had this to say about the phonomenon confirmed in the graph above:

El Nino is a phenomenon in the climate system that happens once every four or five years.  Heat builds up in the equatorial Pacific to the west of Indonesia and so on.  Then when enough of it builds up it surges across the Pacific and changes the currents and the winds.  As it surges toward South America it was discovered and named in the 19th century  It is well understood at this point that the phenomenon has nothing to do with CO2.

Now people talk about changes in that phenomena as a result of CO2 but it’s there in the climate system already and when it happens it influences weather all over the world.   We feel it when it gets rainier in Southern California for example.  So for the last 3 years we have been in the opposite of an El Nino, a La Nina, part of the reason people think the West Coast has been in drought.

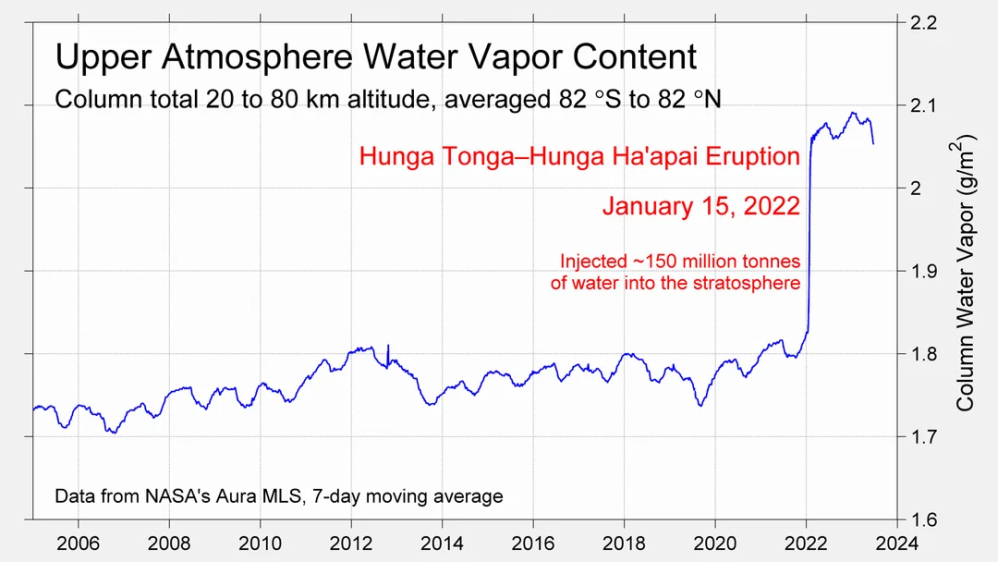
It has now shifted in the last months to an El Nino condition that warms the globe and is thought to contribute to this Spike we have seen. But there are other contributions as well.  One of the most surprising ones is that back in January of 2022 an enormous underwater volcano went off in Tonga and it put up a lot of water vapor into the upper atmosphere. It increased the upper atmosphere of water vapor by about 10 percent, and that’s a warming effect, and it may be that is contributing to why the spike is so high.
A longer view of SSTs
To enlarge, open image in new tab.

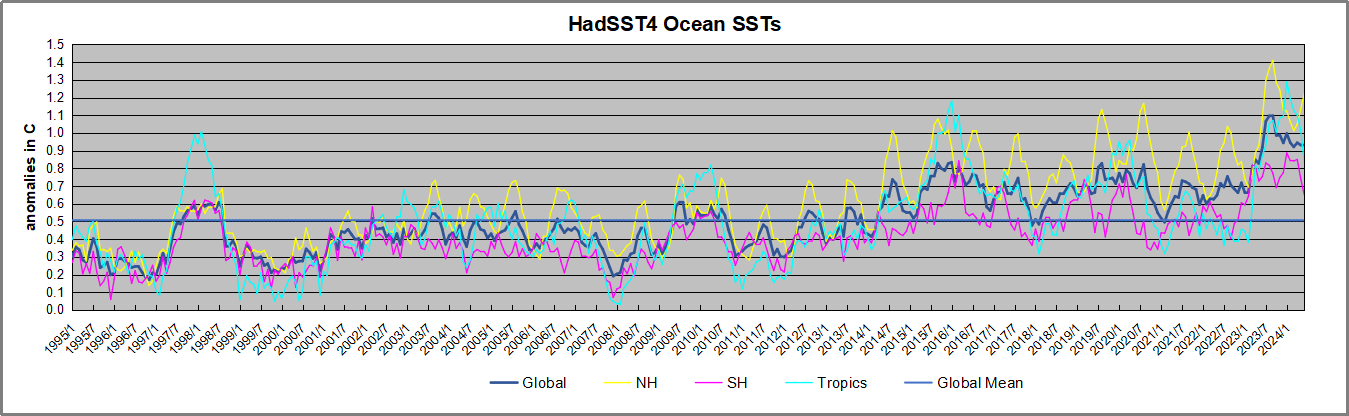
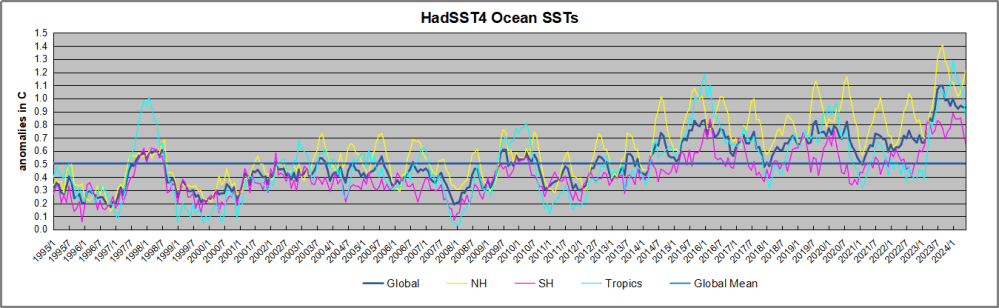
The graph above is noisy, but the density is needed to see the seasonal patterns in the oceanic fluctuations.  Previous posts focused on the rise and fall of the last El Nino starting in 2015.  This post adds a longer view, encompassing the significant 1998 El Nino and since.  The color schemes are retained for Global, Tropics, NH and SH anomalies.  Despite the longer time frame, I have kept the monthly data (rather than yearly averages) because of interesting shifts between January and July. 1995 is a reasonable (ENSO neutral) starting point prior to the first El Nino. 

The sharp Tropical rise peaking in 1998 is dominant in the record, starting Jan. ’97 to pull up SSTs uniformly before returning to the same level Jan. ’99. There were strong cool periods before and after the 1998 El Nino event. Then SSTs in all regions returned to the mean in 2001-2. 

SSTS fluctuate around the mean until 2007, when another, smaller ENSO event occurs. There is cooling 2007-8,  a lower peak warming in 2009-10, following by cooling in 2011-12.  Again SSTs are average 2013-14.

Now a different pattern appears.  The Tropics cooled sharply to Jan 11, then rise steadily for 4 years to Jan 15, at which point the most recent major El Nino takes off.  But this time in contrast to ’97-’99, the Northern Hemisphere produces peaks every summer pulling up the Global average.  In fact, these NH peaks appear every July starting in 2003, growing stronger to produce 3 massive highs in 2014, 15 and 16.  NH July 2017 was only slightly lower, and a fifth NH peak still lower in Sept. 2018.

The highest summer NH peaks came in 2019 and 2020, only this time the Tropics and SH were offsetting rather adding to the warming. (Note: these are high anomalies on top of the highest absolute temps in the NH.)  Since 2014 SH has played a moderating role, offsetting the NH warming pulses. After September 2020 temps dropped off down until February 2021.  In 2021-22 there were again summer NH spikes, but in 2022 moderated first by cooling Tropics and SH SSTs, then in October to January 2023 by deeper cooling in NH and Tropics.  

Then in 2023 the Tropics flipped from below to well above average, while NH produced a summer peak extending into September higher than any previous year.  Despite El Nino driving the Tropics January 2024 anomaly higher than 1998 and 2016 peaks, following months cooled in all regions, and the Tropics continued cooling in April, May and June along with SH dropping, suggesting that the peak likely has been reached, though NH warming is the outlier.

What to make of all this? The patterns suggest that in addition to El Ninos in the Pacific driving the Tropic SSTs, something else is going on in the NH.  The obvious culprit is the North Atlantic, since I have seen this sort of pulsing before.  After reading some papers by David Dilley, I confirmed his observation of Atlantic pulses into the Arctic every 8 to 10 years.

Contemporary AMO Observations

Through January 2023 I depended on the Kaplan AMO Index (not smoothed, not detrended) for N. Atlantic observations. But it is no longer being updated, and NOAA says they don’t know its future.  So I find that ERSSTv5 AMO dataset has current data.  It differs from Kaplan, which reported average absolute temps measured in N. Atlantic.  “ERSST5 AMO  follows Trenberth and Shea (2006) proposal to use the NA region EQ-60°N, 0°-80°W and subtract the global rise of SST 60°S-60°N to obtain a measure of the internal variability, arguing that the effect of external forcing on the North Atlantic should be similar to the effect on the other oceans.”  So the values represent sst anomaly differences between the N. Atlantic and the Global ocean.

The chart above confirms what Kaplan also showed.  As August is the hottest month for the N. Atlantic, its varibility, high and low, drives the annual results for this basin.  Note also the peaks in 2010, lows after 2014, and a rise in 2021. Now in 2023 the peak was holding at 1.4C before declining.  An annual chart below is informative:
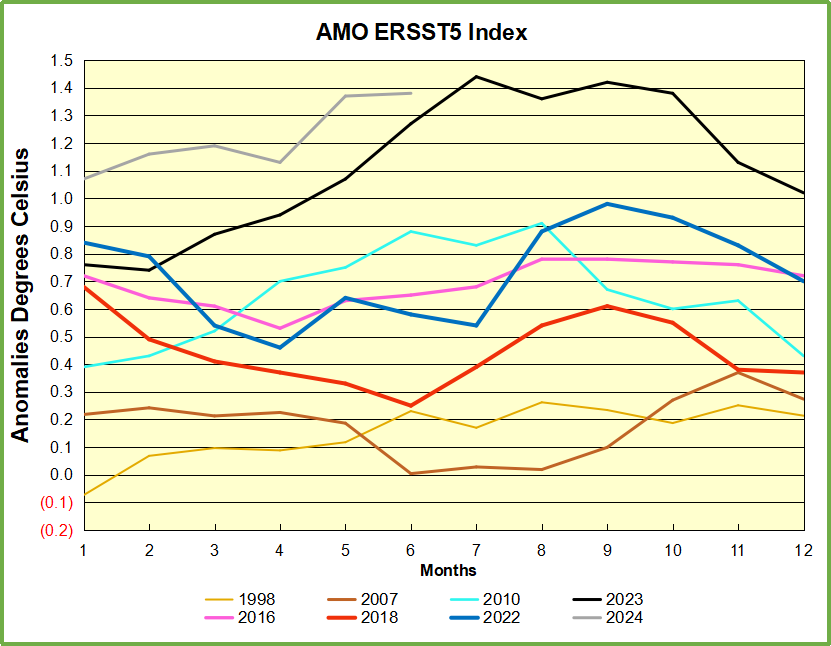
Note the difference between blue/green years, beige/brown, and purple/red years.  2010, 2021, 2022 all peaked strongly in August or September.  1998 and 2007 were mildly warm.  2016 and 2018 were matching or cooler than the global average.  2023 started out slightly warm, then rose steadily to an  extraordinary peak in July.  August to October were only slightly lower, but by December cooled by ~0.4C.

Now in 2024 the AMO anomaly started higher than any previous year, then leveled off for two months declining slightly into April.  Remarkably, May shows an upward leap putting this on a higher track than 2023, and rising slightly higher in June.  The next months will show us if that warming strengthens or levels off.

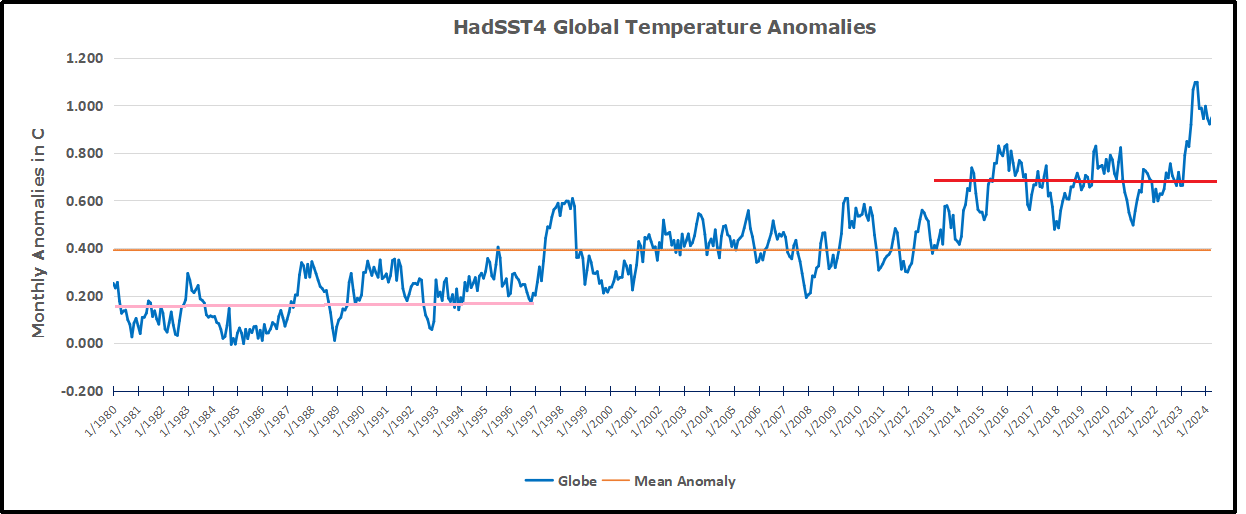
The pattern suggests the ocean may be demonstrating a stairstep pattern like that we have also seen in HadCRUT4. 

The purple line is the average anomaly 1980-1996 inclusive, value 0.18.  The orange line the average 1980-202404, value 0.39, also for the period 1997-2012. The red line is 2013-202404, value 0.66. As noted above, these rising stages are driven by the combined warming in the Tropics and NH, including both Pacific and Atlantic basins.

See Also:

2024 El Nino Collapsing

Curiosity:  Solar Coincidence?

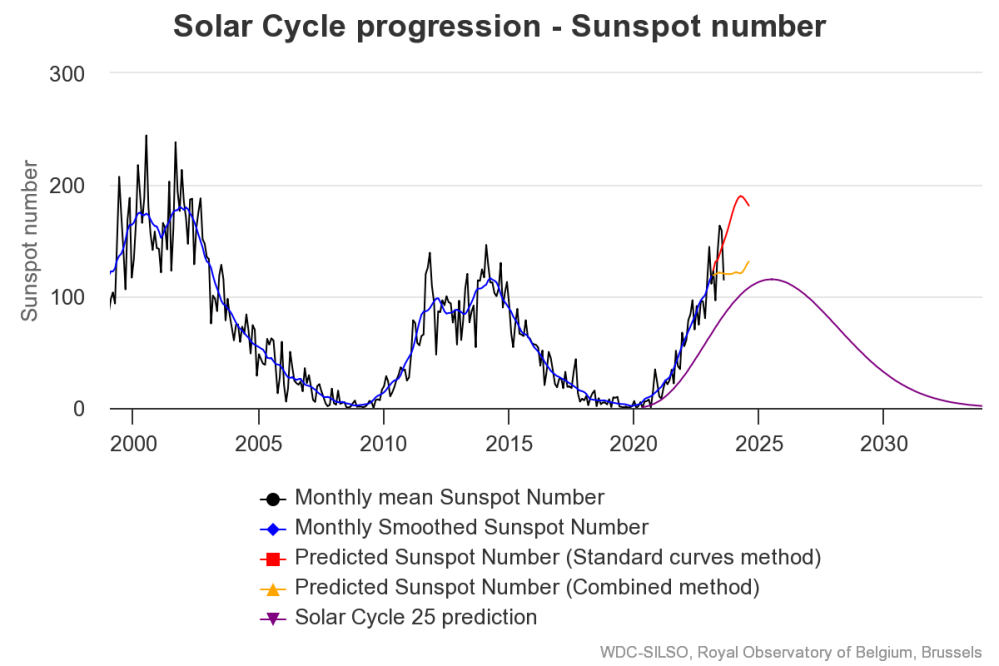
The news about our current solar cycle 25 is that the solar activity is hitting peak numbers now and higher  than expected 1-2 years in the future.  As livescience put it:  Solar maximum could hit us harder and sooner than we thought. How dangerous will the sun’s chaotic peak be?  Some charts from spaceweatherlive look familar to these sea surface temperature charts.
Summary

The oceans are driving the warming this century.  SSTs took a step up with the 1998 El Nino and have stayed there with help from the North Atlantic, and more recently the Pacific northern “Blob.”  The ocean surfaces are releasing a lot of energy, warming the air, but eventually will have a cooling effect.  The decline after 1937 was rapid by comparison, so one wonders: How long can the oceans keep this up? And is the sun adding forcing to this process?

Space weather impacts the ionosphere in this animation. Credits: NASA/GSFC/CIL/Krystofer Kim

Footnote: Why Rely on HadSST4

HadSST is distinguished from other SST products because HadCRU (Hadley Climatic Research Unit) does not engage in SST interpolation, i.e. infilling estimated anomalies into grid cells lacking sufficient sampling in a given month. From reading the documentation and from queries to Met Office, this is their procedure.

HadSST4 imports data from gridcells containing ocean, excluding land cells. From past records, they have calculated daily and monthly average readings for each grid cell for the period 1961 to 1990. Those temperatures form the baseline from which anomalies are calculated.

In a given month, each gridcell with sufficient sampling is averaged for the month and then the baseline value for that cell and that month is subtracted, resulting in the monthly anomaly for that cell. All cells with monthly anomalies are averaged to produce global, hemispheric and tropical anomalies for the month, based on the cells in those locations. For example, Tropics averages include ocean grid cells lying between latitudes 20N and 20S.

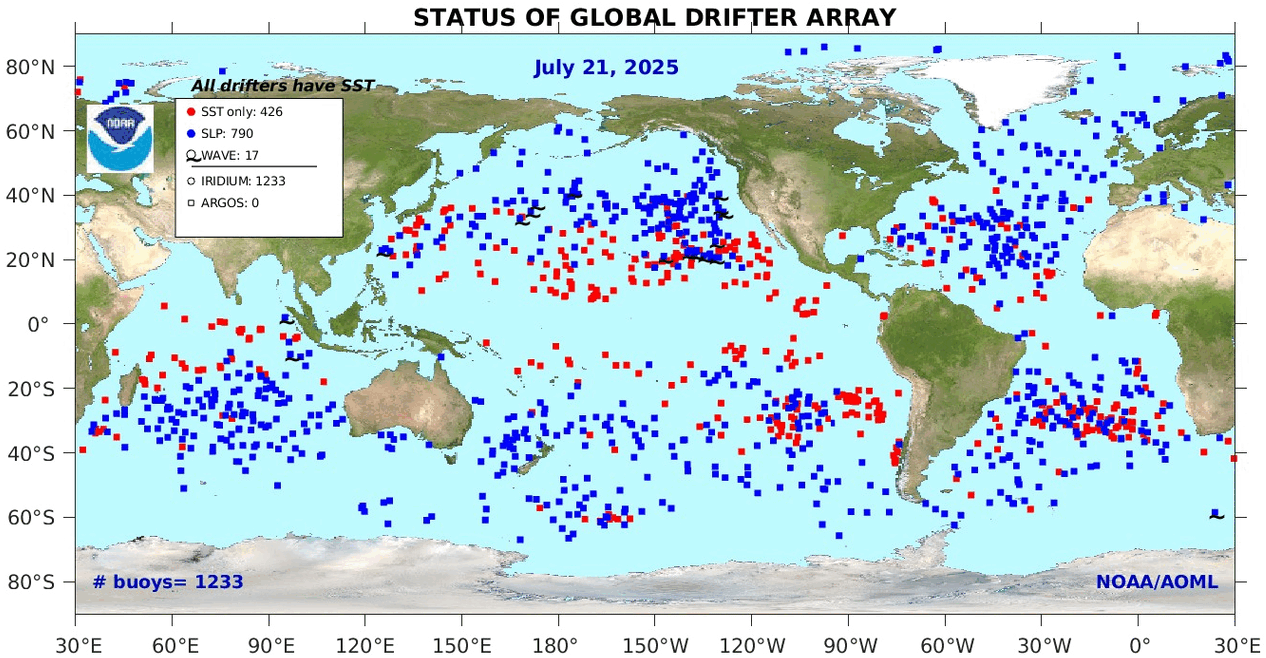
Gridcells lacking sufficient sampling that month are left out of the averaging, and the uncertainty from such missing data is estimated. IMO that is more reasonable than inventing data to infill. And it seems that the Global Drifter Array displayed in the top image is providing more uniform coverage of the oceans than in the past.

uss-pearl-harbor-deploys-global-drifter-buoys-in-pacific-ocean

USS Pearl Harbor deploys Global Drifter Buoys in Pacific Ocean


via Science Matters

https://ift.tt/qGf7HIF

July 25, 2024 at 02:50PM