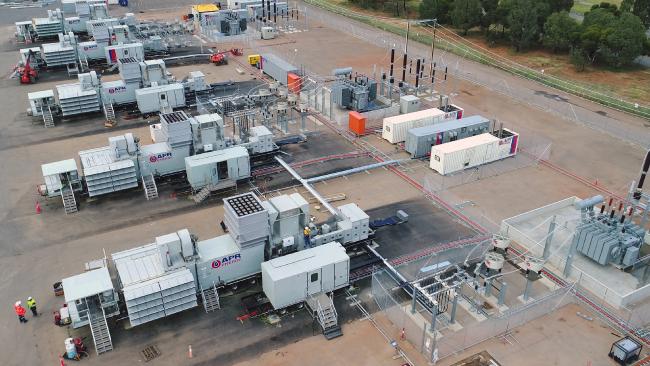
Oil and gas producers are making a killing thanks to chaotically intermittent wind and solar, providing fuel to run gas and diesel generators as so-called ‘backup’.
Mike Holly apparently doesn’t like monopolies and has a set against hydrocarbons. However, he makes a fair point targeting oil and gas producers making a killing every time wind and solar output collapses (sunset and/or calm and cloudy weather will do it every time).
For every MW of wind and solar capacity, there’s a MW of fast-start, peaking power generator capacity waiting in the wings. The owners of those ‘peakers’ – open cycle gas turbines, diesel and kerosene-fuelled generators – cash in at power consumers’ expense.
Noting the way that this has been engineered around the globe (as Mike Holly does below), you don’t need to be a cynic to conclude that the so-called ‘wind and solar transition’ was really designed by crony capitalists to enjoy extraordinary financial gain.
Mike points out that the wind and solar industry’s claims about reducing carbon oxide gas emissions in the electricity generation sector are complete bunkum.
Exposed Global Conspiracy Was Hiding Big Backup Problem of Wind and Solar
Americans Against Monopolies
Mike Holly
19 June 2024
Many global governments, led by the U.S., European Union (EU) and China, are favouring and building wind and solar energy, and incentivizing and pressuring other countries to do the same. U.S. preferential policies include mandates, manufacturing and generation tax subsidies, and regulations rewarding unreliable generation, such as competitive bidding, wholesale markets and low-cost transmission. Global governments have even conspired to hide the reduced fuel efficiencies of the natural gas generators needed to follow wind and solar energy, and misrepresent the reductions in greenhouse gas emissions attributed to these energy sources. The conspiracy of silence has finally been exposed by an electricity industry engineer and a Norwegian study. The governments can now be held even more responsible for high oil and natural gas usage, future energy crises and climate change (i.e., if that exists and is caused by humans).
For example, the U.S. Energy Information Administration (EIA) has used only fuel consumption data to attribute 65% of the decline in theoretical U.S. carbon dioxide emissions to the shift from coal- to natural gas-fired electricity generation, and 30% to the increase in wind and solar generation. They have ignored well-known methane leaks from oil and gas fracking that greatly increase the greenhouse effect, perhaps enough to negate the benefits of shifting from coal. Less well known and even more significant, governments and government-franchised utility monopolies have been hiding the data needed to determine the fuel efficiencies of the gas generation used to backup wind and solar energy.
The intermittent output from wind and solar energy can be followed far more economically with natural gas generators. Obviously, the typical capacity factors of wind and solar energy of under 50% means the renewable energy replaces less than half of the gas generation needed for backup. But an even bigger problem is the intermittent output from wind and solar has forced the gas generators to ramp up and down at lower fuel efficiencies, and replace much less gas than being reported.
The shift from coal to natural gas was driven by aging plants, environmental regulations, fuel efficiencies, costs, and backup of wind and solar. U.S. generation fueled by natural gas increased from 19% in 2005 to 41% in 2020, with perhaps half of the increase now following wind and solar. Older gas plants average about 45% fuel efficiency. The most efficient combined cycle natural gas plants entering service since 2014 have the potential for fuel efficiencies of up to about 60%. Yet, overall gas efficiency increased from 37 to 43 percent between 2000 to 2010, and then plateaued when the most efficient plants were coming online. This plateauing correlates with the increase in wind generation from 2.3% in 2010 to 10.2% in 2022.
In the May 10, 2023 article of The Telegraph entitled “The wind and solar power myth has finally been exposed,” electricity industry engineer Bryan Leyland explains that countries with a considerable amount of wind and solar generation have started following the unpredictable fluctuations of power from the renewable energy by replacing efficient combined-cycle gas turbine plants with open-cycle gas turbines that burn about twice as much gas (note: utilities have been known to disconnect the second turbine of combined-cycle plants). Leyland effectively throws cold water on hopes for technological breakthroughs with electricity storage and calls it madness that governments are expecting to build more wind and solar until net carbon emissions are reduced to zero.
But perhaps the best evidence of the conspiracy comes from a recent Norwegian scientific study of the electricity grid in Ireland entitled “Wind power is not sustainable when fossil balancing power is taken into account.” They analyzed the grid in Ireland because they have high wind speeds and market penetration, and were offered rare access to the necessary data. They found that wind energy was actually reducing emissions from gas plants by only 10 to 20 percent, compared to 20 to 40 percent claimed in typical publications. The Norwegian study concluded: “Over the last 20 years, humanity has reduced its share of fossil primary energy consumption by using wind and solar power by merely 4 percentage points after spending more than 3 trillion USD. This says it all.”
Strangely, the Norwegian study doesn’t explicitly state that the reduction of emissions was limited by the lower fuel efficiencies of the gas generators used for backup. But the author claims as much in the comment section of his linked-in article. And while $3 trillion is a lot of money, it is 3.2% of global public debt. The failure to diversify from oil and natural gas usage could be much more expensive for the global economy, if it results in future energy crises and/or climate change. Every added unit of wind energy is forcing the future use of at least a similar unit of gas generation AND at a fraction of the efficiency. U.S. oil and natural gas production were declining from 1970 to 2005, before the government granted environmental exemptions to fracking. With production from fracking now expected to decline in the next few years, it isn’t clear what can take its place.
The problem with governments is likely political (and not madness), while government-franchised utility monopolies favor utility-scale wind and solar because their energy sources are controlled by government and profits increase with spending. U.S. Congressional Republicans and utility monopolies wouldn’t even respond to requests for the data needed to determine the fuel efficiencies of the gas plants used to backup wind and solar energy. In Germany, utility engineers won’t allow the use of their data and have received promotions after pretending that the government’s energy transition (Energiewende) actually works. China doesn’t even bother to try to use much of its wind and solar energy. Brazil responded to questions about backup from natural gas by studying backup with hydropower, despite environmental and other concerns.
The global conspiracy also includes other interests that benefit from the perception that wind and solar reduce natural gas usage and carbon emissions. The environmental movement benefits from donations and overwhelms due diligence by sending a constant barrage of propaganda promoting wind and solar, including exaggerated claims of backup with batteries and the eventual construction of a pie-in-the-sky national grid electrified only by wind, hydropower and solar. The Big Banks are controlled by the “woke” policies of the Democratic Party and receive preferential subsidies encouraging their financing and ownership of wind and solar generators in the U.S., along with low-interest money from the Federal Reserve Bank. Wind and solar manufacturing in China and the U.S. are also controlled and subsidized by the government.
The U.S., European Union (EU) and China and their global organizations have been incentivizing and pressuring developing countries to favor wind and solar energy. Examples include: (1) the Biden administration gave First Solar, a solar energy company owned by a Biden megadonor, a $500 million government loan to build a manufacturing facility in India, (2) China has made wind and solar manufacturing and other investments in Brazil in exchange for favoring wind and solar generation over co-generation at domestic sugar cane ethanol plants that could have readily and economically reduced both oil and natural gas usage and greenhouse gas emissions, and (3) inspired by Germany, the United Nations and World Bank have been financing wind, hydro and solar energy in Africa, including Kenya and Nigeria.
Perhaps, the biggest indication of a global conspiracy is that Big Oil & Gas interests rarely mention the low reductions in natural gas usage caused by wind and solar energy, probably because it is great for their business. They often call wind and solar a pipe dream while opposing the supposed transition with relatively minor criticisms, such as land and mineral usage, capacity factors, reliability and blackouts. Government policies favoring wind and solar energy are providing political cover, that attempts are being made to solve depleting oil and natural gas reserves and climate change, while not actually threatening their $4 trillion per year global markets. The U.S. and EU obtain two-thirds of total energy from oil and by-product natural gas and less than 13% from each coal and nuclear, compared to global energy use of 54% oil and gas, 27% coal and 6% nuclear.
Manipulation of oil and natural gas supplies has caused global oil crises and threatened entire economies and even war. Global oil production has been controlled by the Organization of the Petroleum Exporting Countries and Russia (OPEC plus), which produces over half of global oil supply and has the world’s lowest-cost petroleum reserves. But the U.S., which produces over 20% of oil and natural gas, has also made these markets more dominant by favoring Big Oil & Gas companies. Global trade policies allow OPEC to prevent their citizens from producing oil and manipulate supply on global markets. Oil price spikes have led to 10 of the last 12 U.S. recessions. Governments have also claimed climate change poses an “existential threat” to life on Earth, although the seriousness of those claims now appears dubious considering government favouritism for oil and gas.
Americans Against Monopolies

via STOP THESE THINGS
July 26, 2024 at 02:30AM