
"Ultimately, it’s going to be, unless there is major technological change, wind and solar are going to be around, though hopefully not subsidized or mandated."
via CFACT
July 2, 2025 at 01:54PM
"Ultimately, it’s going to be, unless there is major technological change, wind and solar are going to be around, though hopefully not subsidized or mandated."
via CFACT
July 2, 2025 at 01:54PM
Linnea Lueken published this week at Climate Realism Thanks, NewScientist, for Admitting Climate Change Isn’t Making the Jet Stream More Erratic. Excerpts in italics with my bolds and added images.
NewScientist, a publication dedicated to popularizing science, recently published a post titled “Extreme winter weather isn’t down to a wavier jet stream,” reporting on a new study that shows, the jet stream is not getting wavier in winter months due to climate change. NewScientist writes that “[i]ncreasingly erratic winter weather in the northern hemisphere isn’t a result of the polar jet stream getting more wavy, according to new research . . ..”
This is true, and it has been evident for some time, but runs counter
to assertions commonly made by climate alarmists.

Although the vast bulk of the article is devoted to insisting that climate change is causing worsening winter and summer weather, claims regularly debunked at Climate Realism, the publication deserves some credit for reporting the study’s results concerning the jet stream, which was, in fact, the focus of the research itself.
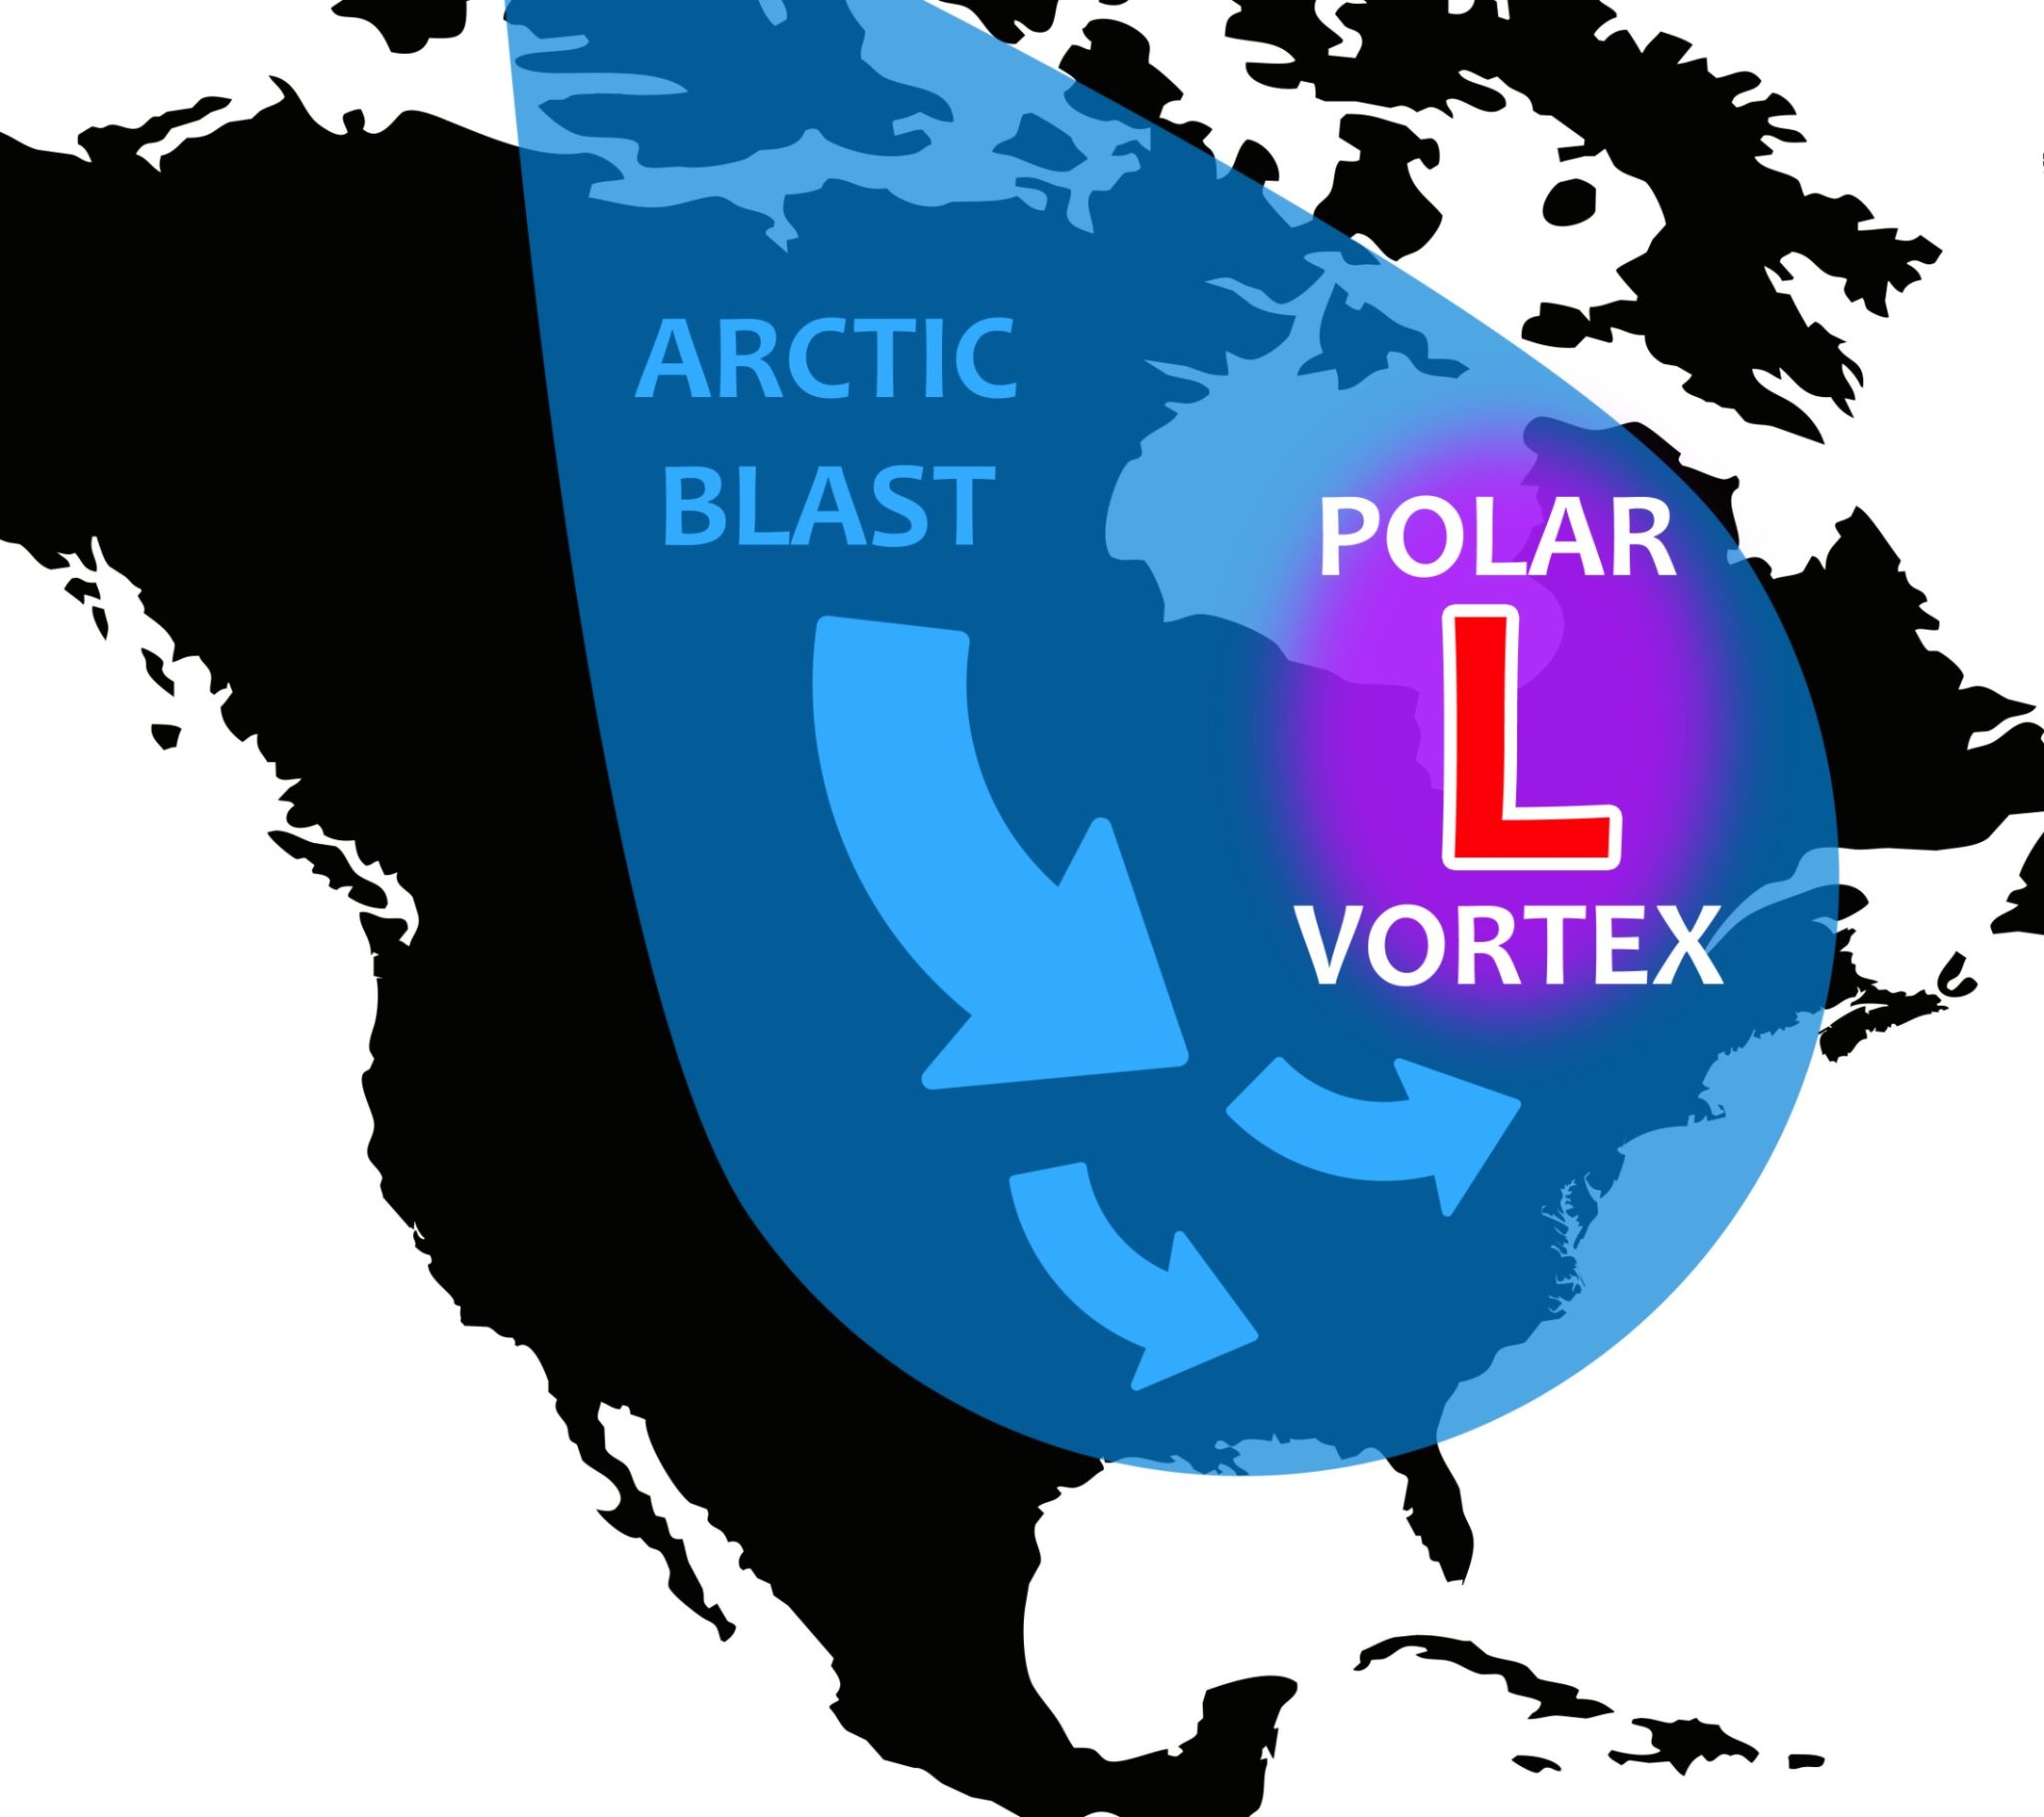
The new reports findings are not actually that “new,” in the sense that Climate Realism has reported on research that came to the same conclusion several times in the past few years, here, here, and here, for instance. There is copious evidence showing that not only are cold snaps not uncommon, but that the jet stream’s (and more specifically, polar vortex) influence on extreme winter weather has been acknowledged since at least 1853. Years of studies looking at the frequency of and intensity of polar vortex events have found no consistent trends. As pointed out by my colleague Anthony Watts in this post on the subject:
“a 2021 study in the journal Geophysical Research Letters found no statistically significant increase in jet stream waviness or meandering in recent decades,”
and he explains there has never been a consensus among scientists when it comes to the issue of polar vortex/jet stream behavior.
The post at NewScientist goes on to explain the new study, saying “recent erratic behaviour isn’t out of the ordinary,” and that the jet stream has been both wavier and less wavy than it is today. Unfortunately, that is where the NewScientist and the authors of the paper it was discussing ceased to follow the evidence. One of the study’s authors reassured NewScientist that climate change is still “affecting extreme weather events in all sorts of really important ways,” and that the jet stream is actually becoming wavier in the summertime, “where it is getting slower, with bigger waves, which leads to things like big heatwaves, drought, and wildfires.”
This would be compelling if existing data backed up the claim,
but, in fact, big heatwaves, drought, and wildfires have not
become more frequent or severe in recent decades.
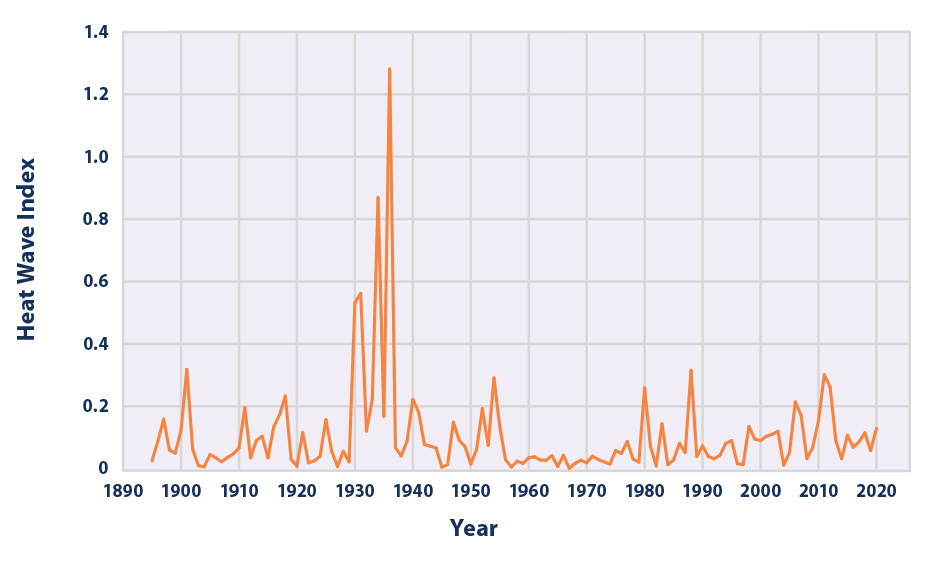
Heatwaves were much more severe in the earlier decades of the 20th century, and overall drought has been declining while precipitation increases. Now that it is summer, many outlets are attempting to claim that hot weather is driven by climate change. In doing so they almost always ignore where heat records are being set, as it is often at airports and other heat-absorbing locations, and ignore historical records that show hot summers are not unprecedented.
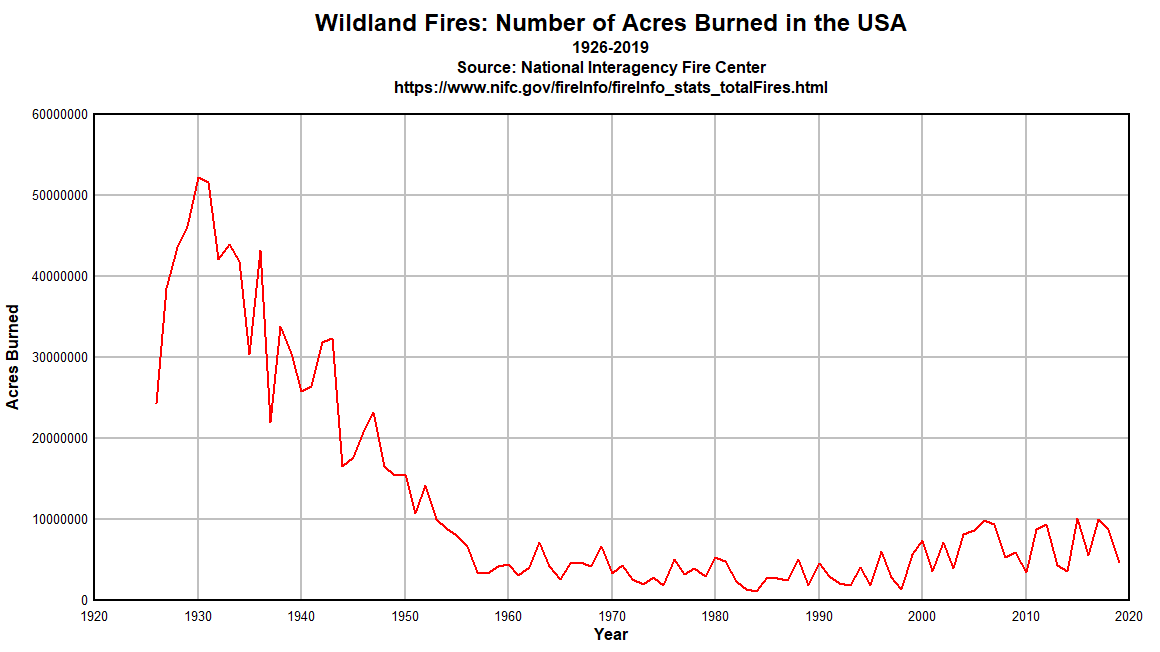
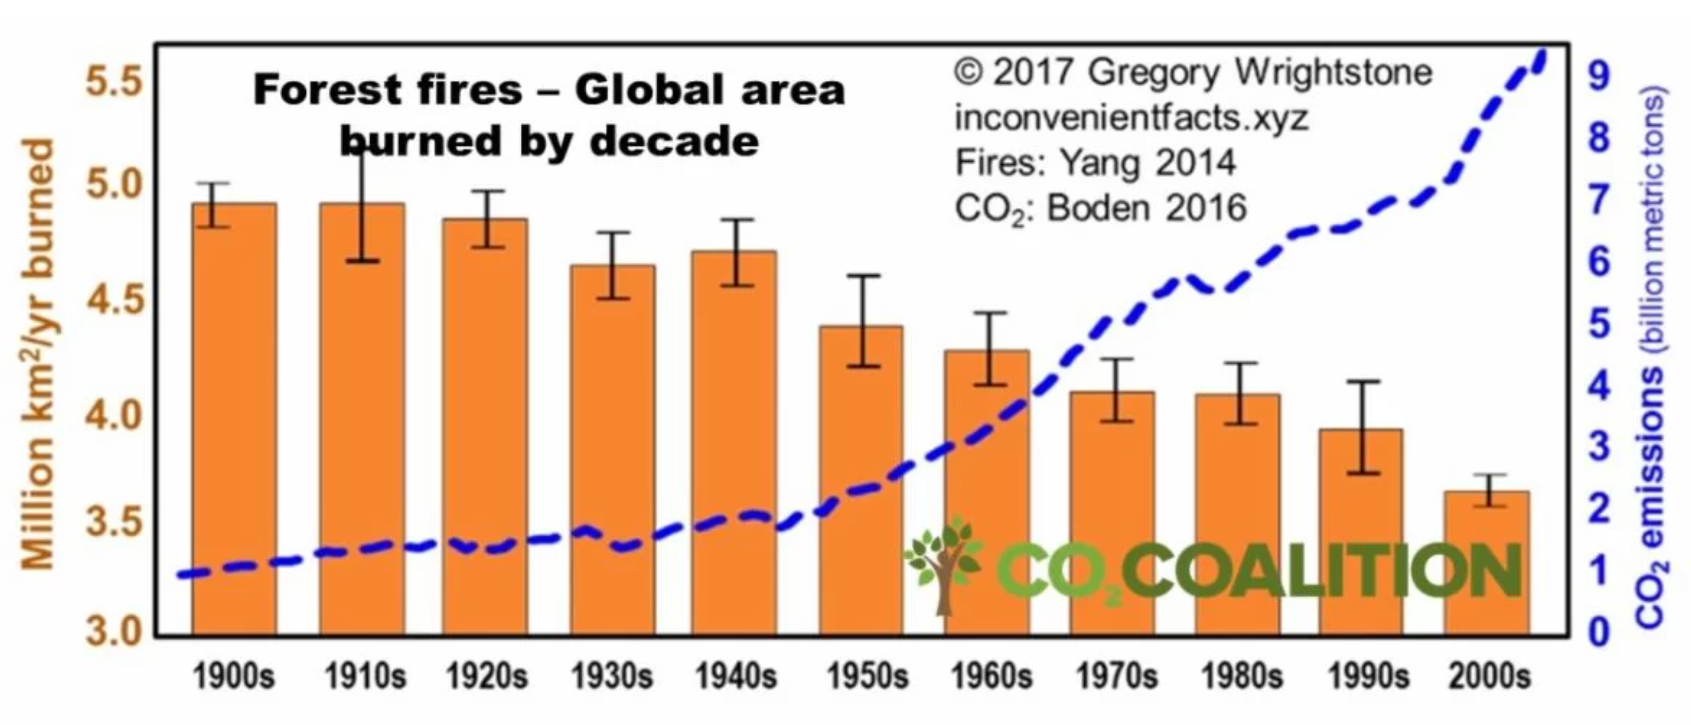
Similarly, data shows that wildfires were worse in the past with research from NASA and the European Space Agency showing that acreage lost to wildfires has declined markedly over the past few decades.
The NewScientist, and the AGU study it references, should have quit when they were ahead. They should have published their unalarming findings about climate change’s lack of an impact on the winter jet stream without then assuring people that despite their study’s findings, they really are true believers and climate change is making weather worse. The latter point is refuted by real world data.

Simulation of jet stream pattern July 22. (VentuSky.com)
We are heading into winter this year at the bottom of a solar cycle, and ocean oscillations due for cooling phases. The folks at Climate Alarm Central (CAC) are well aware of this, and are working hard so people won’t realize that global cooling contradicts global warming. No indeed, contortionist papers and headlines are warning us all that CO2 not only causes hothouse earth, overrun with rats and other vermin. CO2 also causes ice ages when it feels like it.
Update Nov. 26, 2019: Much ado about the polar jet stream recently with a publication by Tim Woolings A battle for the jet stream is raging above our heads. The Claims are not new:
The jet has always varied – and has always affected our weather patterns. But now climate change is affecting our weather too. As I explore in my latest book, it’s when the wanderings of the jet and the hand of climate change add up that we get record-breaking heatwaves, floods and droughts – but not freezes.
The same supposition was made last year in an article by alarmist Jason Samenow at Washington Post. Study: Freak summer weather and wild jet-stream patterns are on the rise because of global warming. Excerpts in italics with my bolds
In many ways, the summer of 2018 marked a turning point, when the effects of climate change — perhaps previously on the periphery of public consciousness — suddenly took center stage. Record high temperatures spread all over the Northern Hemisphere. Wildfires raged out of control. And devastating floods were frequent.
Michael Mann, climate scientist at Pennsylvania State University, along with colleagues, has published a new study that connects these disruptive weather extremes with a fundamental change in how the jet stream is behaving during the summer. Linked to the warming climate, the study suggests this change in the atmosphere’s steering current is making these extremes occur more frequently, with greater intensity, and for longer periods of time.
The study projects this erratic jet-stream behavior will increase in the future, leading to more severe heat waves, droughts, fires and floods.
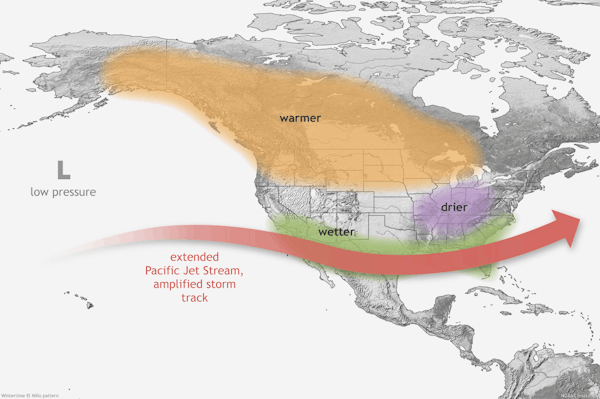
The jet stream is changing not only because the planet is warming up but also because the Arctic is warming faster than the mid-latitudes, the study says. The jet stream is driven by temperature contrasts, and these contrasts are shrinking. The result is a slower jet stream with more wavy peaks and troughs that Mann and his study co-authors ascribe to a process known as “quasi-resonant amplification.”
The altered jet-stream behavior is important because when it takes deep excursions to the south in the summer, it sets up a collision between cool air from the north and the summer’s torrid heat, often spurring excessive rain. But when the jet stream retreats to the north, bulging heat domes form underneath it, leading to record heat and dry spells.
The study, published Wednesday in Science Advances, finds that these quasi-resonant amplification events — in which the jet stream exhibits this extreme behavior during the summer — are predicted to increase by 50 percent this century if emissions of carbon dioxide and other greenhouse gases continue unchecked.
Whereas previous work conducted by Mann and others had identified a signal for an increase in these events, this study for the first time examined how they may change in the future using climate model simulations.
“Looking at a large number of different computer models, we found interesting differences,” said Stefan Rahmstorf from the Potsdam Institute for Climate Impact Research and a co-author of the study, in a news release. “Distinct climate models provide quite diverging forecasts for future climate resonance events. However, on average they show a clear increase in such events.”
Although model projections suggest these extreme jet-stream patterns will increase as the climate warms, the study concluded that their increase can be slowed if greenhouse gas emissions are reduced along with particulate pollution in developing countries. “[T]he future is still very much in our hands when it comes to dangerous and damaging summer weather extremes,” Mann said. “It’s simply a matter of our willpower to transition quickly from fossil fuels to renewable energy.”
Mann has been leading the charge to blame anticipated cooling on fossil fuels, his previous attempt claiming CO2 is causing a slowdown of AMOC (part of it being the Gulf Stream), resulting in global cooling, even an ice age. The same idea underlay the scary 2004 movie Day After Tomorrow.
 Other scientists are more interested in the truth than in hype. An example is this AGU publication by D.A Smeed et al. The North Atlantic Ocean Is in a State of Reduced Overturning Excerpts in italics with my bolds.

Figure 3
Indices of subsurface temperature, sea surface height (SSH), latent heat flux (LHF), and sea surface temperature (SST). SST (purple) is plotted using the same scale as subsurface temperature (blue) in the upper panel. The upper panel shows 24 month filtered values of de‐seasonalized anomalies along with the non‐Ekman part of the AMOC. In the lower panel, we show three‐year running means of the indices going back to 1985 (1993 for the SSH index).
Changes in ocean heat transport and SST are expected to modify the net air‐sea heat flux. The changes in the total air‐sea flux (Figure S4, data obtained from the National Centers for Environmental Prediction‐National Center for Atmospheric Research reanalysis; Kalnay et al., 1996) are almost all due to the change in LHF. The third panel of Figure 3 shows the changes in LHF between the two periods. There is a strong signal with increased heat loss from the ocean over the Gulf Stream. That the area of increased heat loss coincides with the location of warming SST indicates that the changes in air‐sea fluxes are driven by the ocean.
Whilst the AMOC has only been continuously measured since 2004, the indices of SSH, heat content, SST, and LHF can be calculated farther back in time (Figure 3, bottom). Over this longer time period, all four indices are strongly correlated with one another (Table S5; correlations were calculated using the nonparametric method described in McCarthy et al., 2015). These data suggest that measurement of the AMOC at 26°N started close to a maximum in the overturning. Prior to 2007 the indices show variability on a time scale of 8 to 10 years and no trend is evident, but since 2014 all indices have had values lower than any other year since 1985.
Previous studies have shown that seasonal and interannual changes in the subtropical AMOC are forced primarily by changing wind stress mediated by Rossby waves (Zhao & Johns, 2014a, 2014b). There is growing evidence (Delworth et al., 2016; Jackson et al., 2016) that the longer‐term changes of the AMOC over the last decade are also associated with thermohaline forcing and that the changed circulation alters the pattern of ocean‐atmosphere heat exchange (Gulev et al., 2013). The role of ocean circulation in decadal climate variability has been challenged in recent years with authors suggesting that external, atmospheric‐driven changes could produce the observed variability in Atlantic SSTs (Clement et al., 2015). However, the direct observation of a weakened AMOC supports a role for ocean circulation in decadal Atlantic climate variability.
Our results show that the previously reported decline of the AMOC (Smeed et al., 2014) has been arrested, but the length of the observational record of the AMOC is still short relative to the time scales of important decadal variations that exist in the Atlantic. Understanding is therefore constantly evolving. What we identify as a changed state of the AMOC in this study may well prove to be part of a decadal oscillation superposed on a multidecadal cycle. Overlaying these oscillations is the impact of anthropogenic change that is predicted to weaken the AMOC over the next century. The continuation of measurements from the RAPID 26°N array and similar observations elsewhere in the Atlantic (Lozier et al., 2017; Meinen et al., 2013) will enable us to unravel and reveal the role of ocean circulation in the changing Atlantic climate in the coming decades.

Regarding the more recent attempt to link CO2 with jet stream meanderings, we have this paper providing a more reasonable assessment. Arctic amplification: does it impact the polar jet stream? by Valentin P. Meleshko et al. Excerpts below in italics with my bolds.
Analysis of observation and model simulations has revealed that northward temperature gradient decreases and jet flow weakens in the polar troposphere due to global climate warming. These interdependent phenomena are regarded as robust features of the climate system. An increase of planetary wave oscillation that is attributed to Arctic amplification (Francis and Vavrus, 2012; Francis and Vavrus, 2015) has not been confirmed from analysis of observation (Barnes, 2013; Screen and Simmonds, 2013) or in our analysis of model simulations of projected climate. However, we found that GPH variability associated with planetary wave oscillation increases in the background of weakening of zonal flow during the sea-ice-free summer. Enhancement of northward heat transport in the troposphere was shown to be the main factor responsible for decrease of northward temperature gradient and weakening of the jet stream in autumn and winter. Arctic amplification provides only minor contribution to the evolution of zonal flow and planetary wave oscillation.
It has been shown that northward heat transport is the major factor in decreasing the northward temperature gradient in the polar atmosphere and increasing the planetary-scale wave oscillation in the troposphere of the mid-latitudes. Arctic amplification does not show any essential impact on planetary-scale oscillation in the mid and upper troposphere, although it does cause a decrease of northward heat transport in the lower troposphere. These results confound the interpretation of the short observational record that has suggested a causal link between recent Arctic melting and extreme weather in the mid-latitudes.
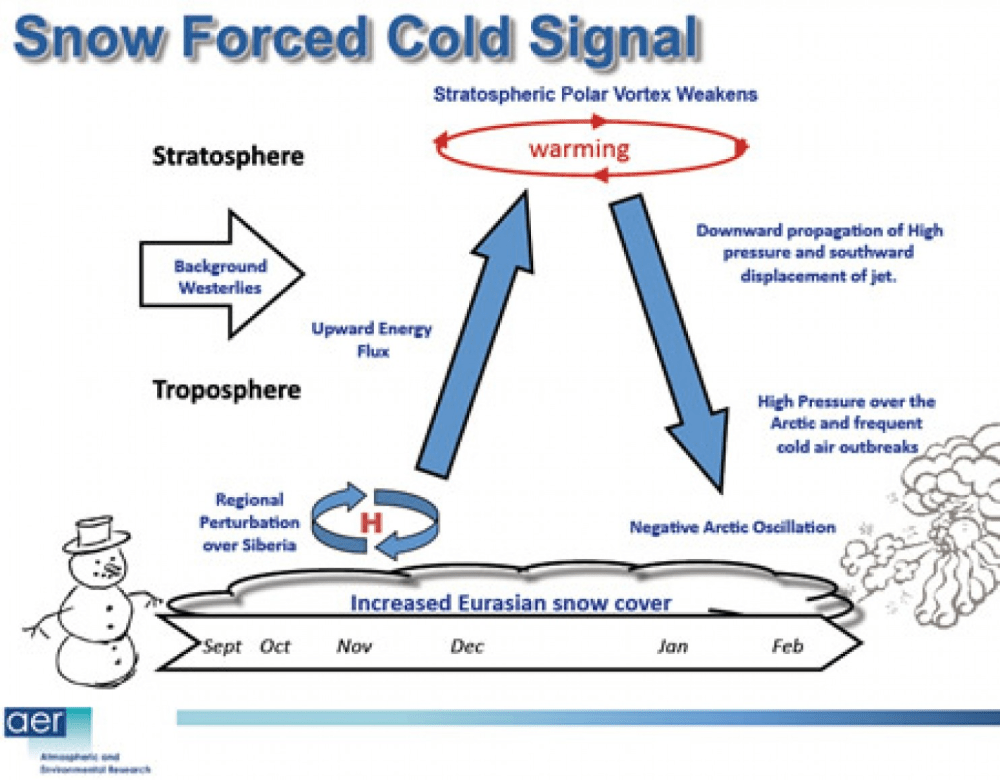
There are two additional explanations of factors causing the wavy jet stream, AKA Polar Vortex. Dr Judah Cohen of AER has written extensively on the link between Autumn Siberian snow cover and the Arctic oscillation. See Snowing and Freezing in the Arctic for a more complete description of the mechanism.
Finally, a discussion with Piers Corbyn regarding the solar flux effect upon the jet stream at Is This Cold the New Normal?
Video transcript available at linked post.

via Science Matters
July 2, 2025 at 12:23PM
By Robert Bradley Jr.
Aaron Nichols on LinkedIn provided a history of federal solar tax subsidies, beginning with Jimmy Carter. His point was to show that the numerous extensions (15 by my count) were bipartisan. My point, instead, is that on-grid solar is inherently noncompetitive against free market energies. [Note: AN blocked me]

Solar tax credits were not “created by the Inflation Reduction Act” or “invented by the Biden Administration,” Nichols begins. He continues:
The first solar energy incentives were created in 1978 by Jimmy Carter’s Administration. They’ve even enjoyed bipartisan support and been renewed by Republican administrations! Here’s a high-level history of solar tax credits:
1978: The Energy Tax Act of 1978 set the first federal solar ITC at 10% of project costs. Congress extended and modified this credit through the early 1980s, eventually making a 10% solar ITC permanent in 1992.
1992: The Energy Policy Act of 1992 established the PTC for renewable electricity. Originally aimed mainly at wind power, it provided 1.5¢ per kWh for the first 10 years of a project’s operation.
Solar was not initially eligible for the PTC, but this law reaffirmed the permanent 10% ITC for solar.
2005: President George W. Bush signed the Energy Policy Act of 2005, a landmark energy bill establishing a 30% ITC for solar investments. This included a new 30% residential solar credit. The 30% rate was initially temporary but was later extended by the Obama administration.
.
2008: The Emergency Economic Stabilization Act of 2008 (enacted under President Bush and continued by President Obama) extended the 30% ITC for eight more years and removed the $2,000 cap on the residential credit.
2009: In response to the financial crisis, the American Recovery and Reinvestment Act of 2009 (Obama administration) introduced a cash grant option (the Section 1603 Treasury Grant Program) in lieu of the ITC.
2015: The Consolidated Appropriations Act of 2016 (enacted Dec 2015 under President Obama) provided a long-term extension with a phase-down for the solar ITC. It maintained the 30% ITC for projects commencing through 2019, then scheduled step-downs: 26% for 2020, 22% for 2021, and thereafter dropping to 10% for commercial and 0% for residential in 2022.
2020: In late 2020, under President Trump, Congress extended the phase-out schedule for solar credits by two years. COVID-19 relief legislation (Dec 2020) kept the ITC at 26% for projects begun in 2021 and 2022 (instead of dropping further), with 22% for those begun in 2023. There was speculation that President Trump might veto this extension, but he ultimately signed it into law.
2022: The Inflation Reduction Act (IRA) of 2022, passed under President Biden, not only renewed and increased these clean energy tax credits but also redesigned them. It restored the ITC to 30% and guaranteed it for at least a decade, revived the PTC for solar and other renewables, and introduced bonus credits and elective pay.
Comment
“Clean energy doesn’t have to be Red vs. Blue (and historically hasn’t been),” Aaron Nichols ended. “Investment in solar energy infrastructure benefits us all.”
Really? Tell that to Sunnova clients and investors. Tell that to beleaguered taxpayers. One wonders how long Mr. Nichols will still have employment, his job description being
I’m a NABCEP-certified PV professional who’s worked in solar sales, installation, and marketing. I’ve researched and written on federal clean energy policies and have served as a source on the U.S. solar market for several major publications, including Business Insider, USA Today, and NerdWallet. My writing has appeared in Solar Today, PV Tech, and Solar Power World.
One hopes his skill set can be redeployed to non-political profit centers. The private sector needs him more than a dying industry does. (And he should unblock me at part of his changeover.)
Appendix: My ITC Summary
In Wind and Solar Power: Old, Uneconomic, Government Dependent, I provided this similar summary of the Investment Tax Credit (ITC)
Fast forward to the 1970s when U.S. price controls on natural gas and oil led to shortages and fears of Peak Oil and Peak Gas. Solar became the political energy of choice for President Carter, beginning with a 10 percent Investment Tax Credit in 1978. Extensions followed in 1980, 1986, 1988, 1989, 1990, and 1991.
The Energy Policy Act of 1992, increasing the ITC to 30 percent of invested capital, was extended in 2006, 2008, 2009, 2016, 2018, 2019, and 2022, the most recent being in Biden’s Inflation Reduction Act. In all, solar has received 15 extensions of its “temporary” program to date.
Not good, and time for change.
Subscribe to get the latest posts sent to your email.
via Watts Up With That?
July 2, 2025 at 12:02PM
By Paul Homewood
At the end of spring the Met Office put out a press release, which claimed that “this spring shows some of the changes we’re seeing in our weather patterns, with more extreme conditions, including prolonged dry, sunny weather, becoming more frequent.”


As there is no evidence at all that dry springs are becoming more common, I asked the Met Office to provide for their claim.
This is their reply:

The UK Climate 2023 report referenced offers this conclusion on the section Page 31 to 36:

In other words, dry seasons if anything are on the decrease.
The section from page 74 merely looks at future projections, which therefore have no relevance at all..
Meanwhile the Christidis study is also irrelevant, as it looks summers in Europe. Similarly the Kendon study is only concerned with projections for summer.
The Met Office have been unable to offer any evidence for Emma Carlisle’s claim. Indeed they cannot, because none exists.
Her incorrect statement should be retracted and a correction published.
via NOT A LOT OF PEOPLE KNOW THAT
July 2, 2025 at 11:13AM
