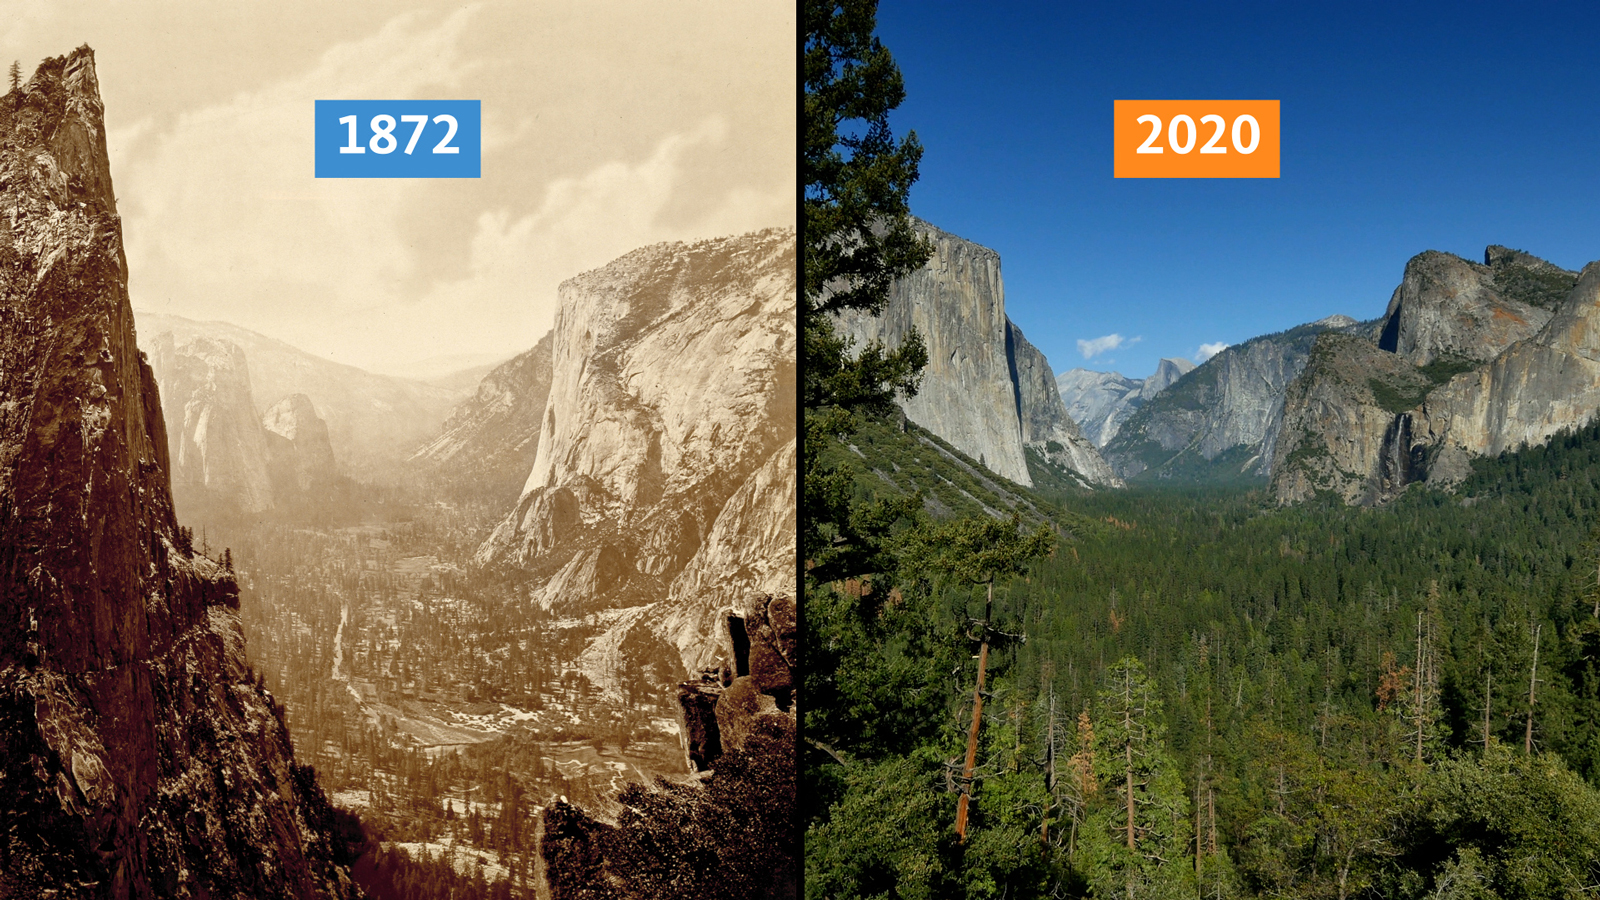
Although the University of California feels obliged to partly blame climate change for wildfires, they then devote the rest of the article to the real reasons:
Two hundred years ago, someone walking through Yosemite would not have seen the densely packed forests we now associate with the Sierra Nevada.
They would have passed through broad meadows and perhaps have even been drawn to comment, as the Spanish did, on how the land appeared like a “well-tended garden.”
In fact, that is exactly what Spaniards were seeing: Indigenous people native to Yosemite and other parts of the world for millennia have used fire to promote healthy forests. Today, the wisdom of that approach is seen as one of the keys to unraveling the deadly cycle of California wildfires.
It’s easy to assume that the impenetrable forests we associate with the mountains of California have always been there. Many of the popular images of Yosemite, for example, were taken decades after federal agencies moved to suppress fires in the region and removed native tribes.
But ecological records and oral Indigenous history alike describe how fire, sparked by lightning or planned by tribes, played a vital role in shaping California’s landscape for thousands of years. A recent UC Berkeley study found that forest biomass in the Klamath Mountains region used to be approximately half of what it is now, and that burns carried out by the Karuk and Yurok tribes played a significant role in maintaining forest structure and biodiversity.
Ask the Honorable Ron W. Goode, Tribal Chairman of the North Fork Mono Tribe, what’s missing from the land and he will tell you it’s fire.
It may be a contentious subject, especially given California’s recent traumatic wildfires. “But I need to talk to you about fire,” Goode says.
A side-by-side comparison of Yosemite in 1872 versus 2020. Tree cover in the area has greatly expanded. Credit: University of California
Regardless of the climatic impact, and we know from tree-line studies that California was much warmer than now in the Middle Ages, there is nothing we can do about that.
But there is plenty we can about forestry management.
52.14282 -2.04127 Met Office CIMO Assessed CIMO Class 4 installed 1/1/1953 relocated 1957 relocated again 1993.
A number of issues to discuss here. Following on from the review of Pershore College this is the other Pershore weather station also known by the Met Office as Throckmorton depending on where you look it up. The screen is sited at the north, north eastern end of the runway of the former RAF Pershore/Throckmorton Airfield which is no longer used for aviation. It has, however, subsequently been used for other, somewhat more gruesome, purposes. And, in conjunction with Pershore College, offers a demonstration of Heat Island effect.
The location sits between the runway end and Long Lane (the sole airfield access road) running partly around the airfield perimeter. As can be seen from the aerial image there is extensive roadside hedging encroaching onto screen. Additionally there are significant metallic structures likely to distort wind patterns.
The Street view image from 2011 clearly shows the screen and surrounding influences on screen temperature just a few metres from the road and layby parking/viewing area.
Whoever is responsible for the roadside vegetation maintenance is not known to me but I suspect it will likely have passed to the Local Authority in the airfield’s post operational days. Clearly it is not considered a priority for aviation safety anymore leading to significant unchecked growth. The effect on temperature readings is inevitable with the screen now barely visible at all. The 2024 current view from the same spot is below.
This neglect of key Met office operational sites in this manner is a recurring theme in so many of my reviews even of such highly and expensively equipped sites as this. As I observed with Shobdon Airfield a relatively small annual investment would ensure continued site reading’s integrity. Absent such maintenance and all the last decade’s temperature readings for the historic record have needlessly become unreliable and unusable for the key aspect of climate reporting. In this particular case many of the wind readings will be distorted a large part of the time as well.
So what else is problematical? In common with disused airfields they are being repurposed. Often industrial complexes develop as they have here and the sites readily lend themselves to parking things up. Just like Bedford and others, Pershore is turning into an ever increasingly large parking lot for either scrapped or new cars – often unsold but pre-registered models notably EVs.
Not only were the local residents angered and distressed at huge volumes of traffic and the stench involved in this operation, the issues did not go away when they stopped. The rotting carcasses required tankers to pump out the resultant “liqueur” and yet more traffic and stench for a considerable time after. Quite what effect this may have had on soil and surface temperatures is not recorded. It must certainly have been an unpleasant situation for the residents.
This location though rapidly changing, is still rural and just 6 kilometres from Pershore College weather station.
Two sites in such close proximity and just 2 metres difference in elevation, should not consistently significantly differ in temperature readings. As I noted in my report on Pershore College there was a significant recent difference in daytime maxima with the now developed College site warmer. Further comparison of recent cold temperatures also indicates the College holds onto this warmth overnight whilst the rural airfield site drops much colder and much more quickly. The Weatherobs comparison graphs clearly demonstrate this. The airfield site dropped to -5°C by midnight last night (9/1/2025) then ultimately down to a minimum of -6.6°C early this morning.
Conversely, at the same times, the College site had only dropped to -1.3°C by midnight and recorded a minimum of -4.8°C. Large differences.
The holding of daytime stored heat, slower temperature decline and higher minimum are all clear indications of Heat Island effect. This is not a cherry pick, ongoing inspection of the two near neighbours regularly indicates such major differences. Unfortunately whilst the Met Office provide “Climate Averages” for the airfield site (by whatever data homogenisation they choose) they do not freely supply comparative data for the College site. The primary concern, though, is that the College site is the one being used to represent the CET but is no longer representing the natural environment.
The current cold weather period is readily demonstrating these UHI Effects. The weatherobs screen capture from 2:00 am 10/1/2025 shows real time temperatures varying from 0°C in urban areas of Birmingham/ Winterbourne and -1°C of Coventry/Coundon, and Pershore College contrasting with as low as -5°C at rural Pershore/Throckmorton and -6°C at rural Benson and South Newington.
I will be monitoring and soon reviewing more of the stations in this Gloucestershire, Warwickshire, Oxfordshire, Worcestershire concentration. The above map only indicates automatic reporting stations in this area, there are surprisingly several more manual reporting stations, many in inappropriate locations (i.e. domestic gardens) to add to the above.
Carbon pricing is pushing up energy prices, admits the Bank of England.
The Telegraph report:
Net zero policies are sharply driving up energy costs, the Bank of England has admitted, as officials battle to bring living costs back under control.
Sarah Breeden, the Bank’s deputy governor, said households and businesses were paying more for energy because of so-called carbon permits, which require power plants to pay for each tonne of carbon dioxide they emit.
These permits accounted for nearly half the cost of fuel bought by gas-fired power plants last year, Ms Breeden said, which was passed on to consumers.
My final example relates to the role of climate mitigation policy in energy prices where there is now evidence that policies aimed at the climate transition were probably more important contributors to the recent rise and fall in inflation than we previously thought.
As Chart 3 shows, carbon prices rose materially in 2021 and 2022, peaking at around £100 per tonne of carbon dioxide (CO2) equivalent in the summer of 2022, a roughly 100% increase in price on the previous year.From 2021 onwards, the UK’s emissions trading scheme saw a reduction in the supply of carbon permits, a decreasing share of permits being given out for free, and an expansion of sectoral coverage (over the 2021 to 2030 period). This was around the same time as the increase in wholesale gas prices, which could also have contributed to this rise in carbon prices.
These carbon costs are non-trivial in the sectors most exposed to the scheme, like the power sector. In 2022, during the peak of energy price shock, the wholesale price of gas was the dominant driver of high electricity prices. In 2024, however, carbon costs which amounted to roughly 50% of the fuel costs for gas-fired electricity producers in the UK were a major driver of prices. Overall we might expect close to 100% of carbon costs naturally to be passed on in wholesale market prices.
Even in 2024, carbon costs amounted for half the fuel cost of a CCGT, in other words about £20/MWh.
As gas-fired power tends to set the wholesale price for electricity, the impact on consumer bills is magnified, with renewable generators making windfall profits on top of their subsidies.
Although carbon prices have fallen from their peak, it is understood that this is just a temporary adjustment.
The ESO, for instance, in their Clean Power 2030 report, states that the officially projected carbon prices in 2030 will be triple today’s.
Annoyingly, they don’t seem to have an option to show which fuel categories are which! But I have filtered out below everything except for Biomass, CCGT, Nuclear and Wind, in that order. (I/Cs at 5.30pm were supplying 6.3 GW, Pumped Storage 4.7 GW, OCGT 0.9 GW and Others 3.8 GW).
With Biomass and Nuclear running flat out, CCGT supplied 24.2 GW at that time. Wind ran at 2.6 GW. It needs to be pointed out that wind has often fallen to less than 1 GW in winter.
This particular near miss appears to have caught the NESO by surprise, because demand turned out to be 3 GW higher than anticipated three days before. And as Kathryn points out, alarm bells are already ringing for Friday evening, when winds are forecast to be even lighter than last night.
Why did we get into this awful mess?
It does not take a genius to work out why? We shut down more than 20 GW of reliable coal capacity, and thought we could replace it with medieval technology that only works when the wind blows!
Discover more from Watts Up With That?
Subscribe to get the latest posts sent to your email.