Church Lawford WMO 03544 – Just beam it up somewhere else.

52.35880 -1.33137 Met Office CIMO Assessed Class 5 Installed 1/1/1991

It possibly seemed a good idea for someone to install the weather station here in the early 1990s as the site was a former potential site for emergency Government. Tim Channon did a detailed review of the site back in 2012 when there were only 15 satellite dishes in total – well worth reading.

How things have changed since.

Sometimes reviewing sites it feels as if I am looking for problems rather than looking at the positives the site offers. In this case it is obvious a very large expense has gone into creating this major very well equipped site. The frustration is why has no further care been taken to ensure it remains so? This is a street view image from winter 2009 with the compound in the field corner clear of most trees and shade.

At the time it was still a reasonably good site and surely it should have been kept that way with our taxpayer money. So the same spot latest image.

Clearly this confirms the headline image of a site completely shaded by trees to the eastern side, only the northern elevation fully open, heavy shade to come later in the day from the nearby satellite dish and tree to the west and with extensive hard standing and car parking to the south.

Despite all the above this does not appear to be the end of the matter. Apparently the entire surrounding area is due for redevelopment which is not surprising when pulling the view out to see the rest of the area.

I do not expect this site to be relocated as it has too much strategic relevance but its readings will effectively become even more affected by adverse surroundings. A Class 5 waste of resources.

via Tallbloke’s Talkshop

https://ift.tt/nBP4qRL

January 7, 2025 at 04:19PM

California’s Exxon Lawsuit Is Guided More By Symbols Than Actions

By Nate Scherer

The idea of corporate social responsibility is not new. For years, there has been a push for companies to act in a more socially responsible manner, specifically as it relates to environmental stewardship. While environmental stewardship is important, concerns about sustainability must be balanced carefully with consumer interests. The nation’s most populous state increasingly appears to have forgotten these important fact.

California is suing oil and gas giant ExxonMobil for alleged “deceptive public messaging surrounding plastics recycling” and its culpability in “the plastic waste and pollution crisis.” Unfortunately, the lawsuit is extremely misguided and ignores the complicated role plastics continue to play in society. It seeks to pin blame on a single company for a global problem while absolving itself from any responsibility.

While many states have instituted laws requiring manufacturers to recycle, or otherwise safely dispose of waste products, California’s lawsuit goes a step further. It seeks to hold a company liable for something that, as a large oil and gas producer, it is only indirectly responsible for. That makes it uniquely dangerous and potentially damaging to consumer interests since plastics have diverse applications and continue to be widely used.

It goes without saying that plastic waste is a serious problem that, in many ways, embodies the economic concept known as the tragedy of the commons where individual actions can collectively lead to negative consequences. Every year, the U.S. produces millions of tons of plastic, much of which ultimately ends up in landfills, or in the worst cases, is discarded into the environment. California notes that only a small percentage of this plastic is recycled, with the Environmental Protection Agency putting the number at about 9%.

However, California has chosen to ding Exxon for promoting advanced recycling technology and endorsing the widely recognized recycling symbol on its products. The state argues these actions have misled consumers into believing that if they properly dispose of products, they will be recycled, even though most current research suggests this is not the case. But touting technological advances in recycling—even when modest—and encouraging people to recycle are good things, not bad.

The federal government has encouraged recycling for decades and spends millions annually on education campaigns such as “America Recycles Day.” For its part, California also continues to promote recycling and regularly passes new rules and regulations to make the process easier for consumers. Whether these efforts are effective is a separate question, but Exxon is far from alone in embracing recycling as a solution to plastic waste.

That makes California’s lawsuit against Exxon disingenuous. The state seems far more interested in going after the company simply because it is the world’s largest “refiner and marketer” of petrochemical products than it is concerned about solving the world’s plastic pollution problem. Perhaps that’s why the Golden State is seeking “multiple billions of dollars” in civil penalties. 

The lawsuit also seems to neglect the enormous benefits that plastics have brought to ordinary people, including Californians. Despite ongoing challenges with recycling, plastics are attractive because they are extremely versatile, cheap to manufacture, and possess many unique properties that make them preferable to alternative materials that are not always as practical to use or even better for the environment.

Indeed, there is a reason that plastics are known as the “material with 1,000 uses.” Today, over 6,000 consumer products rely on petrochemicals as a primary compound. They are found in items as mundane as milk cartons and shampoo bottles to lifesaving medical devices and automobile seatbelts. One would think that a state that claims to be concerned that “plastics are everywhere” would at least attempt to understand why that is the case, and what makes the material so popular.

Unfortunately, that would require California to carefully weigh the pros and cons of plastics, something it has shown no interest in doing as it attempts to wean off oil and gas. California would do well to remember that solving global problems like plastic waste will require global efforts, efforts that are undermined each time it chooses to single out a company already committed to playing its part.

Nate Scherer is a policy analyst with the American Consumer Institute, a nonprofit education and research organization. For more information about the Institute, visit us at www.TheAmericanConsumer.Org or follow us on X @ConsumerPal

This article was originally published by RealClearEnergy and made available via RealClearWire.


Discover more from Watts Up With That?

Subscribe to get the latest posts sent to your email.

via Watts Up With That?

https://ift.tt/q7cH5Ej

January 7, 2025 at 04:09PM

Tipping point: Zuckerberg dumps “fact-checkers”, allows immigration talk, copies X and moves team from CA to Texas

By Jo Nova

The Tipping Point is here, just not the one they expected

Instead of the climate shifting, the big change is our culture. Now that the election is safely over, Mark Zuckerberg admits that censorship went too far and he’s going to change things. He’s suddenly decided that free speech matters again and Facebook and Instagram will drop the third party “fact checkers” because they made too many mistakes. (Of course, he doesn’t admit that these were not mistakes at all, but entirely the plan.)

As David Evans (the other half) says “Reminds me of 1989, when the Berlin Wall fell. It was the end of another leftist regime based on censorship and cancelling.  The good news just kept on coming.”

It’s a very limited mea culpa —  just good intentions and a bit of scope creep

It’s not like he was interfering in elections, tilting the balance to buy political protection,  increase his profits, or score points at dinner parties with billionaire friends.

From the Press Release:

In recent years we’ve developed increasingly complex systems to manage content across our platforms, partly in response to societal and political pressure to moderate content. This approach has gone too far. As well-intentioned as many of these efforts have been, they have expanded over time to the point where we are making too many mistakes, frustrating our users and too often getting in the way of the free expression we set out to enable.

And it was only “harmless content” that was lost  —  it’s not like people died, wallowed in jail, or got attacked by illegal immigrants due to their loss of free speech:

Too much harmless content gets censored, too many people find themselves wrongly locked up in “Facebook jail,” and we are often too slow to respond when they do.

The Fact Checkers turned out to have their own biases:

If his plan was to give more expert opinions so “the people could judge” it does seem odd that they hired 20 year old nobodies with no qualifications to censor Harvard Professors in medicine:

The intention of the program was to have these independent experts give people more information about the things they see online, particularly viral hoaxes, so they were able to judge for themselves what they saw and read.

Ahh, the miracle, of how the people were supposed to be able to judge what they couldn’t see and never read… but nevermind, eh?

It was just terribly bad luck the fact checkers all happened to support the same side of politics that Zuckerberg donated $400 million dollars too in 2020:

That’s not the way things played out, especially in the United States. Experts, like everyone else, have their own biases and perspectives. This showed up in the choices some made about what to fact check and how. Over time we ended up with too much content being fact checked that people would understand to be legitimate political speech and debate. Our system then attached real consequences in the form of intrusive labels and reduced distribution. A program intended to inform too often became a tool to censor.

He openly admits that the Twitter community notes policy is much better and will adopt it.

It’s unusual in the business world to see someone copy a competitor (and openly say so):

We plan to phase in Community Notes in the US first over the next couple of months, and will continue to improve it over the course of the year. As we make the transition, we will get rid of our fact-checking control, stop demoting fact checked content and, instead of overlaying full screen interstitial warnings you have to click through before you can even see the post, we will use a much less obtrusive label indicating that there is additional information for those who want to see it.

Elon Musk is happy. “This is cool”, he says.

And like Musk, Zuckerberg is sending the policy brains team to Texas — belatedly realizing that the Californian bubble is not the place to connect with most Americans:

… we will be moving the trust and safety teams that write our content policies and review content out of California to Texas and other US locations.

Suddenly people will be able to discuss immigration and gender identity

We want to undo the mission creep that has made our rules too restrictive and too prone to over-enforcement. We’re getting rid of a number of restrictions on topics like immigration, gender identity and gender that are the subject of frequent political discourse and debate. It’s not right that things can be said on TV or the floor of Congress, but not on our platforms. These policy changes may take a few weeks to be fully implemented.

It’s telling that he picks these topics. Immigration, especially is the hot button topic in the US, UK and Europe. This change will come through in mere weeks, he says, leaving us wondering if Zuckerberg suddenly realized Facebook and Instagram were in danger of being 100% irrelevant in the real world. A cruel observer might say that his interest in free speech was purely profit driven.

At ZeroHedge, they point out that it’s just over a month since Zuckerberg met Donald Trump at Mar-a-Lago, and only one day after one of Trump’s closest allies joined the board of Facebook — the UFC CEO Dana White.

It’s all a step in the right direction. But after censoring ICU Specialists who were trying to save lives and who turned out to be right, Zuckerberg is going to have to do a lot more than mouthing the weak words of “mistakes”. The nicest possible interpretation is that as a mere double-digit billionaire, (unlike Musk) Zuckerberg was squeezed by the Blob until he complied. The US government could have put him out of business in five minutes if he offended them. But where is that story? His country — the world — really needs to hear the real mea culpa.

Nothing can compensate for the damage to lives that could have been avoided, but there are plenty of people out whose losses can be cut quickly:

The impact-wave of the Trump win continues.

0 out of 10 based on 0 rating

via JoNova

https://ift.tt/ayfeo1I

January 7, 2025 at 03:08PM

Ocean Even Cooler December 2024

The best context for understanding decadal temperature changes comes from the world’s sea surface temperatures (SST), for several reasons:

  • The ocean covers 71% of the globe and drives average temperatures;
  • SSTs have a constant water content, (unlike air temperatures), so give a better reading of heat content variations;
  • Major El Ninos have been the dominant climate feature in recent years.

HadSST is generally regarded as the best of the global SST data sets, and so the temperature story here comes from that source. Previously I used HadSST3 for these reports, but Hadley Centre has made HadSST4 the priority, and v.3 will no longer be updated.  HadSST4 is the same as v.3, except that the older data from ship water intake was re-estimated to be generally lower temperatures than shown in v.3.  The effect is that v.4 has lower average anomalies for the baseline period 1961-1990, thereby showing higher current anomalies than v.3. This analysis concerns more recent time periods and depends on very similar differentials as those from v.3 despite higher absolute anomaly values in v.4.  More on what distinguishes HadSST3 and 4 from other SST products at the end. The user guide for HadSST4 is here.

The Current Context

The chart below shows SST monthly anomalies as reported in HadSST4 starting in 2015 through December 2024.  A global cooling pattern is seen clearly in the Tropics since its peak in 2016, joined by NH and SH cycling downward since 2016, followed by rising temperatures in 2023 and 2024.

Note that in 2015-2016 the Tropics and SH peaked in between two summer NH spikes.  That pattern repeated in 2019-2020 with a lesser Tropics peak and SH bump, but with higher NH spikes. By end of 2020, cooler SSTs in all regions took the Global anomaly well below the mean for this period.  A small warming was driven by NH summer peaks in 2021-22, but offset by cooling in SH and the tropics, By January 2023 the global anomaly was again below the mean.

Now in 2023-24 came an event resembling 2015-16 with a Tropical spike and two NH spikes alongside, all higher than 2015-16. There was also a coinciding rise in SH, and the Global anomaly was pulled up to 1.1°C last year, ~0.3° higher than the 2015 peak.  Then NH started down autumn 2023, followed by Tropics and SH descending 2024 to the present. After 10 months of cooling in SH and the Tropics, the Global anomaly came back down, led by NH cooling the last 4 months from its peak in August. It’s now about 0.1C higher than the average for this period.

Comment:

The climatists have seized on this unusual warming as proof their Zero Carbon agenda is needed, without addressing how impossible it would be for CO2 warming the air to raise ocean temperatures.  It is the ocean that warms the air, not the other way around.  Recently Steven Koonin had this to say about the phonomenon confirmed in the graph above:

El Nino is a phenomenon in the climate system that happens once every four or five years.  Heat builds up in the equatorial Pacific to the west of Indonesia and so on.  Then when enough of it builds up it surges across the Pacific and changes the currents and the winds.  As it surges toward South America it was discovered and named in the 19th century  It iswell understood at this point that the phenomenon has nothing to do with CO2.

Now people talk about changes in that phenomena as a result of CO2 but it’s there in the climate system already and when it happens it influences weather all over the world.   We feel it when it gets rainier in Southern California for example.  So for the last 3 years we have been in the opposite of an El Nino, a La Nina, part of the reason people think the West Coast has been in drought.

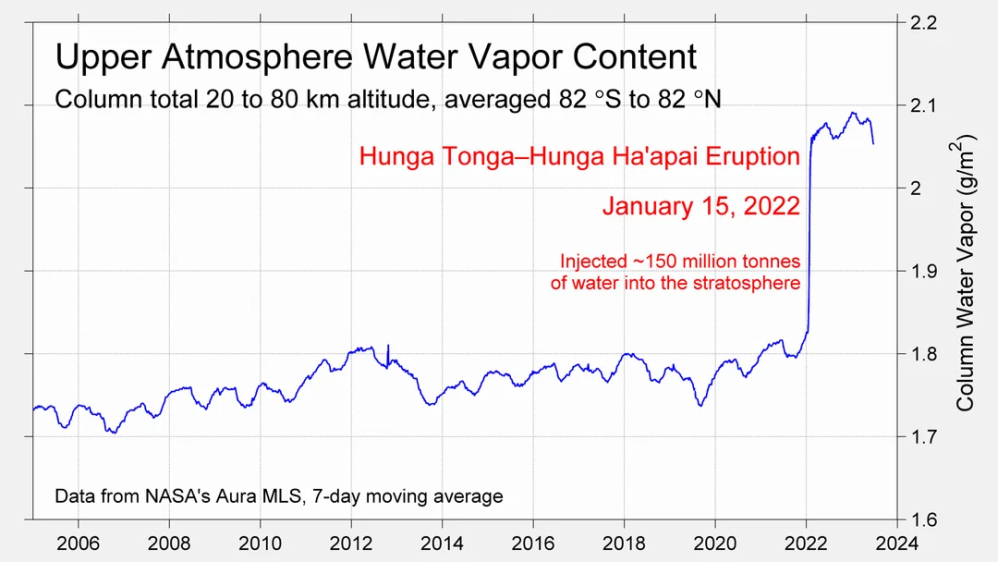
It has now shifted in the last months to an El Nino condition that warms the globe and is thought to contribute to this Spike we have seen. But there are other contributions as well.  One of the most surprising ones is that back in January of 2022 an enormous underwater volcano went off in Tonga and it put up a lot of water vapor into the upper atmosphere. It increased the upper atmosphere of water vapor by about 10 percent, and that’s a warming effect, and it may be that is contributing to why the spike is so high.
A longer view of SSTs

Open image in new tab to enlarge.

The graph above is noisy, but the density is needed to see the seasonal patterns in the oceanic fluctuations.  Previous posts focused on the rise and fall of the last El Nino starting in 2015.  This post adds a longer view, encompassing the significant 1998 El Nino and since.  The color schemes are retained for Global, Tropics, NH and SH anomalies.  Despite the longer time frame, I have kept the monthly data (rather than yearly averages) because of interesting shifts between January and July. 1995 is a reasonable (ENSO neutral) starting point prior to the first El Nino. 

The sharp Tropical rise peaking in 1998 is dominant in the record, starting Jan. ’97 to pull up SSTs uniformly before returning to the same level Jan. ’99. There were strong cool periods before and after the 1998 El Nino event. Then SSTs in all regions returned to the mean in 2001-2. 

SSTS fluctuate around the mean until 2007, when another, smaller ENSO event occurs. There is cooling 2007-8,  a lower peak warming in 2009-10, following by cooling in 2011-12.  Again SSTs are average 2013-14.

Now a different pattern appears.  The Tropics cooled sharply to Jan 11, then rise steadily for 4 years to Jan 15, at which point the most recent major El Nino takes off.  But this time in contrast to ’97-’99, the Northern Hemisphere produces peaks every summer pulling up the Global average.  In fact, these NH peaks appear every July starting in 2003, growing stronger to produce 3 massive highs in 2014, 15 and 16.  NH July 2017 was only slightly lower, and a fifth NH peak still lower in Sept. 2018.

The highest summer NH peaks came in 2019 and 2020, only this time the Tropics and SH were offsetting rather adding to the warming. (Note: these are high anomalies on top of the highest absolute temps in the NH.)  Since 2014 SH has played a moderating role, offsetting the NH warming pulses. After September 2020 temps dropped off down until February 2021.  In 2021-22 there were again summer NH spikes, but in 2022 moderated first by cooling Tropics and SH SSTs, then in October to January 2023 by deeper cooling in NH and Tropics.  

Then in 2023 the Tropics flipped from below to well above average, while NH produced a summer peak extending into September higher than any previous year.  Despite El Nino driving the Tropics January 2024 anomaly higher than 1998 and 2016 peaks, following months cooled in all regions, and the Tropics continued cooling in April, May and June along with SH dropping.  After July and August NH warming again pulled the global anomaly higher, September and October resumed cooling in all regions.

What to make of all this? The patterns suggest that in addition to El Ninos in the Pacific driving the Tropic SSTs, something else is going on in the NH.  The obvious culprit is the North Atlantic, since I have seen this sort of pulsing before.  After reading some papers by David Dilley, I confirmed his observation of Atlantic pulses into the Arctic every 8 to 10 years.

Contemporary AMO Observations

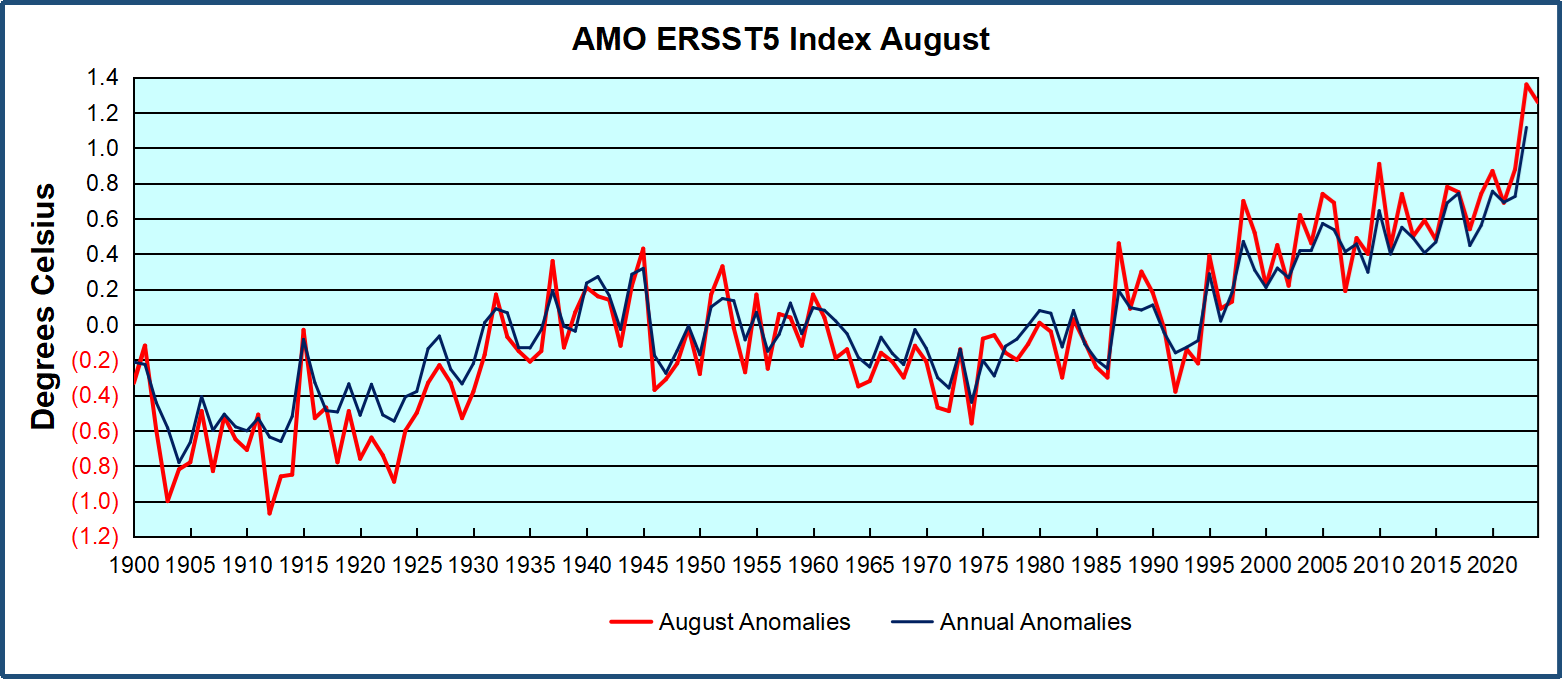
Through January 2023 I depended on the Kaplan AMO Index (not smoothed, not detrended) for N. Atlantic observations. But it is no longer being updated, and NOAA says they don’t know its future.  So I find that ERSSTv5 AMO dataset has current data.  It differs from Kaplan, which reported average absolute temps measured in N. Atlantic.  “ERSST5 AMO  follows Trenberth and Shea (2006) proposal to use the NA region EQ-60°N, 0°-80°W and subtract the global rise of SST 60°S-60°N to obtain a measure of the internal variability, arguing that the effect of external forcing on the North Atlantic should be similar to the effect on the other oceans.”  So the values represent sst anomaly differences between the N. Atlantic and the Global ocean.
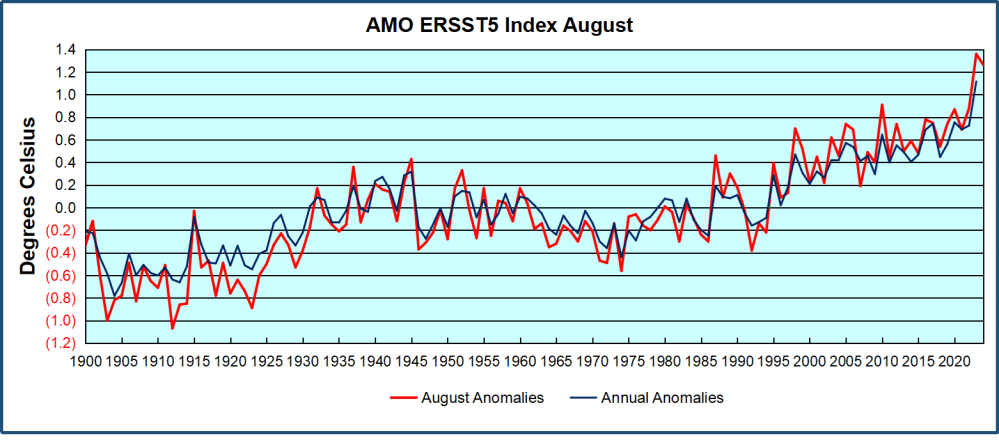
The chart above confirms what Kaplan also showed.  As August is the hottest month for the N. Atlantic, its variability, high and low, drives the annual results for this basin.  Note also the peaks in 2010, lows after 2014, and a rise in 2021. Then in 2023 the peak was holding at 1.4C before declining.  An annual chart below is informative:
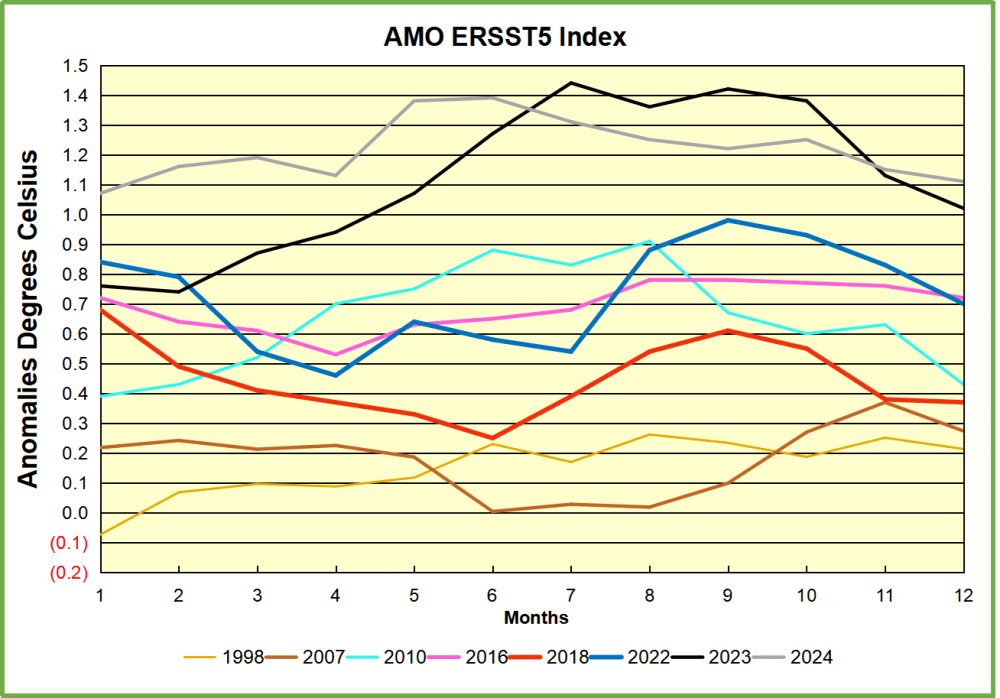
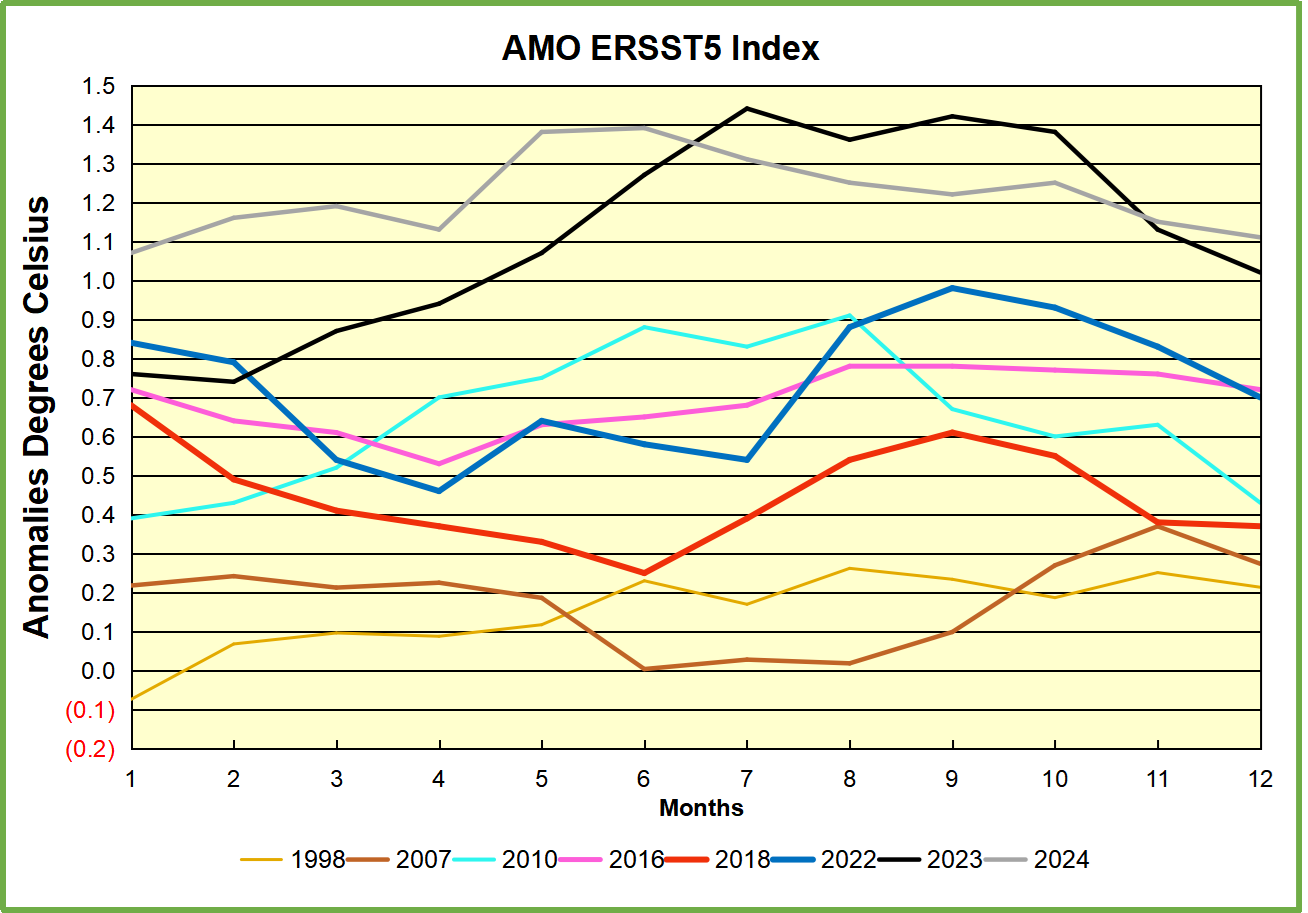
Note the difference between blue/green years, beige/brown, and purple/red years.  2010, 2021, 2022 all peaked strongly in August or September.  1998 and 2007 were mildly warm.  2016 and 2018 were matching or cooler than the global average.  2023 started out slightly warm, then rose steadily to an  extraordinary peak in July.  August to October were only slightly lower, but by December cooled by ~0.4C.

Then in 2024 the AMO anomaly started higher than any previous year, then leveled off for two months declining slightly into April.  Remarkably, May showed an upward leap putting this on a higher track than 2023, and rising slightly higher in June.  In July, August and September 2024 the anomaly declined, and despite a small rise in October, is now lower than the peak reached in 2023.

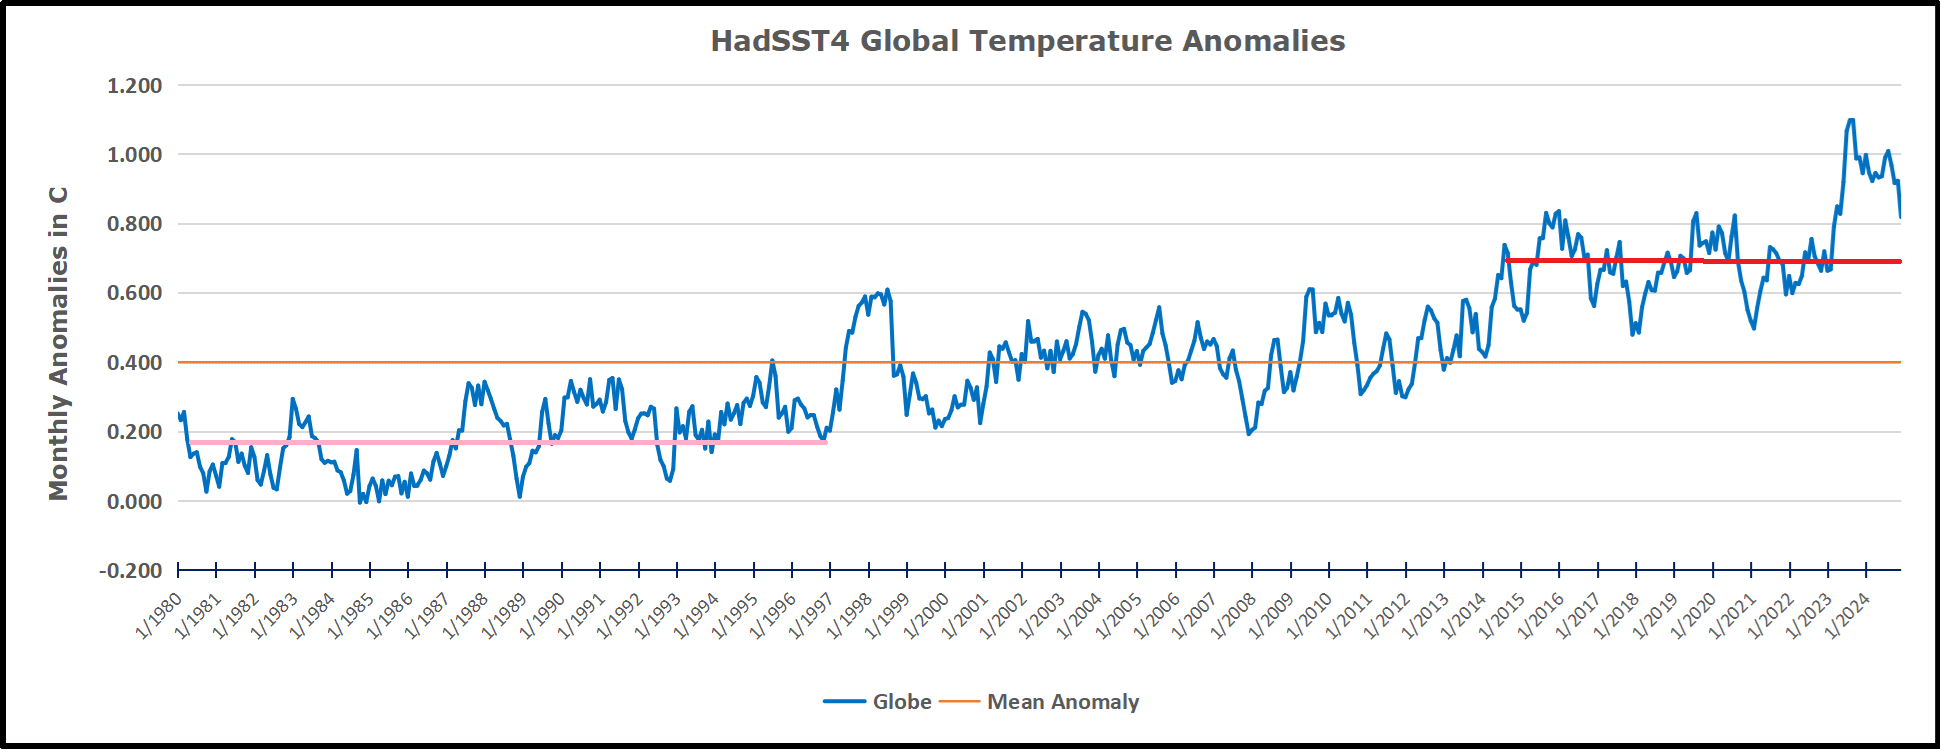
The pattern suggests the ocean may be demonstrating a stairstep pattern like that we have also seen in HadCRUT4. 
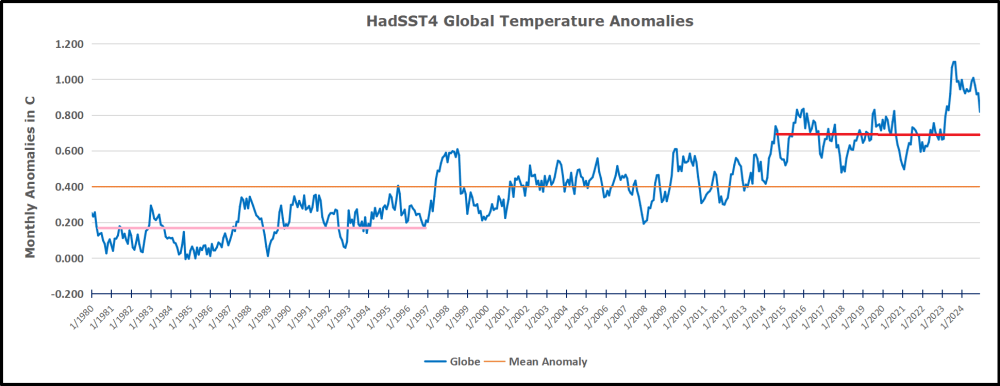
The purple line is the average anomaly 1980-1996 inclusive, value 0.18.  The orange line the average 1980-2024, value 0.39, also for the period 1997-2012. The red line is 2013-2024, value 0.67. As noted above, these rising stages are driven by the combined warming in the Tropics and NH, including both Pacific and Atlantic basins.

See Also:

2024 El Nino Collapsing

Curiosity:  Solar Coincidence?

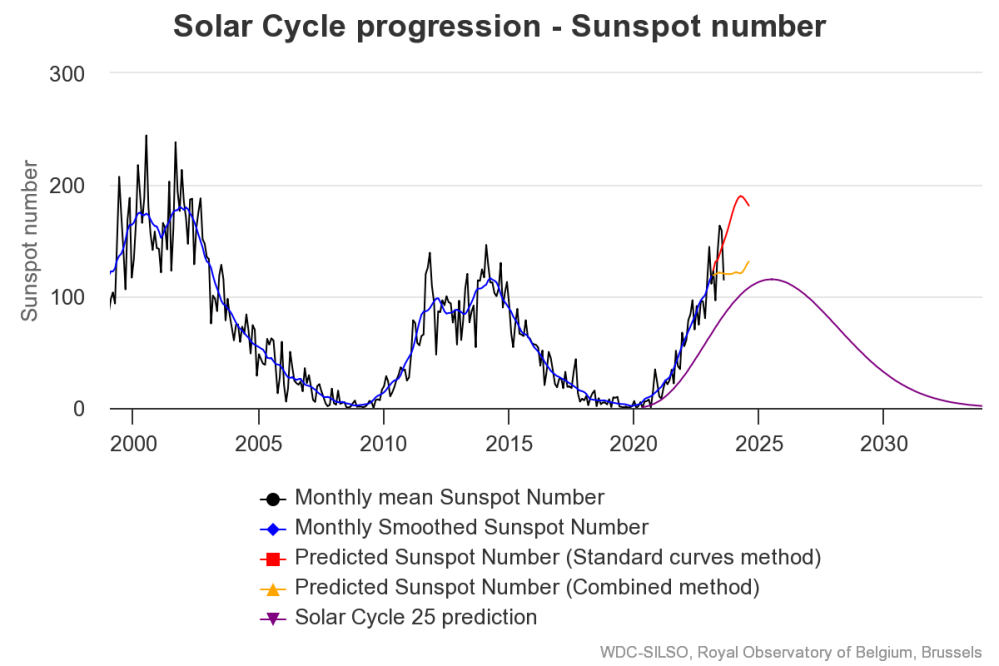
The news about our current solar cycle 25 is that the solar activity is hitting peak numbers now and higher  than expected 1-2 years in the future.  As livescience put it:  Solar maximum could hit us harder and sooner than we thought. How dangerous will the sun’s chaotic peak be?  Some charts from spaceweatherlive look familar to these sea surface temperature charts.
Summary

The oceans are driving the warming this century.  SSTs took a step up with the 1998 El Nino and have stayed there with help from the North Atlantic, and more recently the Pacific northern “Blob.”  The ocean surfaces are releasing a lot of energy, warming the air, but eventually will have a cooling effect.  The decline after 1937 was rapid by comparison, so one wonders: How long can the oceans keep this up? And is the sun adding forcing to this process?

Space weather impacts the ionosphere in this animation. Credits: NASA/GSFC/CIL/Krystofer Kim

Footnote: Why Rely on HadSST4

HadSST is distinguished from other SST products because HadCRU (Hadley Climatic Research Unit) does not engage in SST interpolation, i.e. infilling estimated anomalies into grid cells lacking sufficient sampling in a given month. From reading the documentation and from queries to Met Office, this is their procedure.

HadSST4 imports data from gridcells containing ocean, excluding land cells. From past records, they have calculated daily and monthly average readings for each grid cell for the period 1961 to 1990. Those temperatures form the baseline from which anomalies are calculated.

In a given month, each gridcell with sufficient sampling is averaged for the month and then the baseline value for that cell and that month is subtracted, resulting in the monthly anomaly for that cell. All cells with monthly anomalies are averaged to produce global, hemispheric and tropical anomalies for the month, based on the cells in those locations. For example, Tropics averages include ocean grid cells lying between latitudes 20N and 20S.

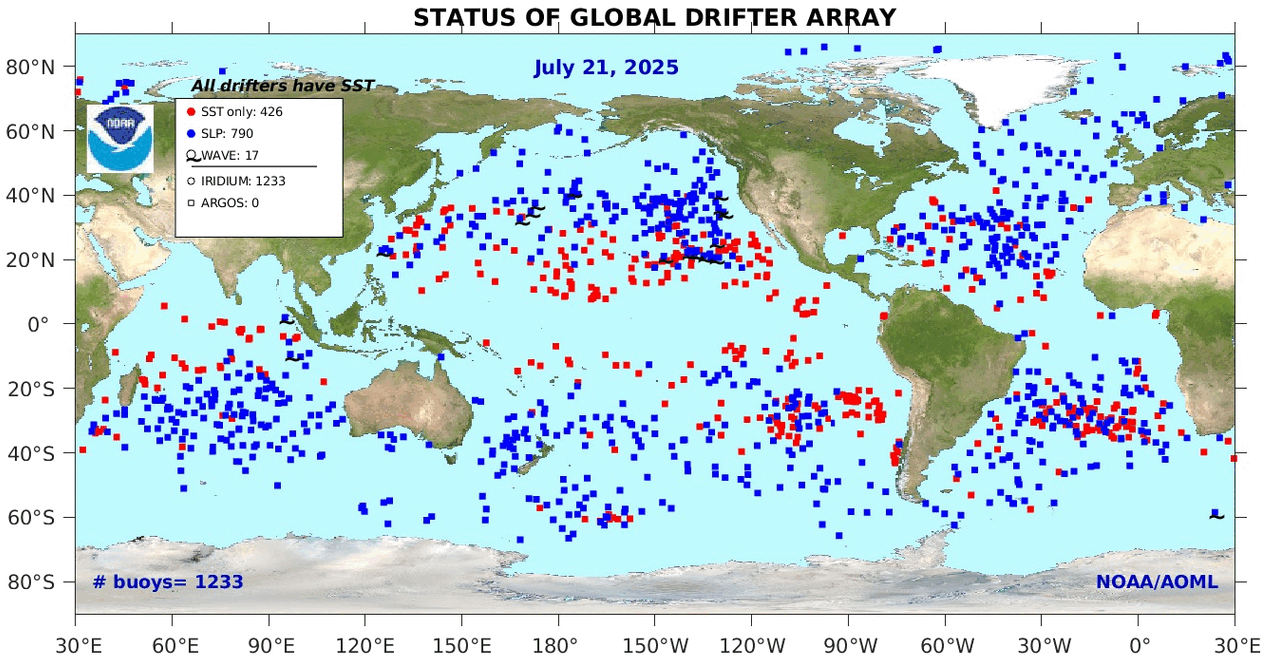
Gridcells lacking sufficient sampling that month are left out of the averaging, and the uncertainty from such missing data is estimated. IMO that is more reasonable than inventing data to infill. And it seems that the Global Drifter Array displayed in the top image is providing more uniform coverage of the oceans than in the past.

uss-pearl-harbor-deploys-global-drifter-buoys-in-pacific-ocean

USS Pearl Harbor deploys Global Drifter Buoys in Pacific Ocean


via Science Matters

https://ift.tt/Xe30fjQ

January 7, 2025 at 02:43PM