Coal Use Hits Record High in 2024 Thanks to India and China

From Legal Insurrection

As media pushes fear about record “hot” temperatures, a review of the science shows our main focus should be energy security.

Posted by Leslie Eastman 

Despite the elites deeming it a dirty fossil fuel, global coal use is set to reach an all-time high of 8.77 billion tonnes in 2024, marking the third consecutive year of record-breaking consumption. This surge is primarily driven by increased demand in Asia, particularly China, India, and Indonesia.

The elite media is trying to connect this data to the assertion of their proclamation it was the “hottest year on record‘.

World coal use is set to reach an all-time high in 2024, the International Energy Agency said Wednesday, in a year all but certain to be the hottest in recorded history.

Despite calls to halt humanity’s burning of the filthiest fossil fuel driving climate change, the energy watchdog expects global demand for coal to hit record highs for the third year in a row.

Scientists have warned that planet-warming greenhouse gases will have to be drastically slashed to limit global heating to avoid catastrophic impacts on the Earth and humanity.

Earlier in December, the European Union’s climate monitor Copernicus said 2024 was “effectively certain” to be the hottest on record — eclipsing the mark set just last year.

The pearl-clutching climate cultists are neglecting a few considerations in their hand-wringing analysis. To begin with, most nations (or at least those not led by western-civilization-hating eco-activists) will act in accordance with their own interests.

In other words, the Iron Law of Electricity is in effect.

This surge in demand for hydrocarbons to produce electricity proves once again, that electricity is the world’s most important and fastest-growing form of energy.

It also proves what I call the Iron Law of Electricity, which says “People, businesses, and countries will do whatever they have to do to get the electricity they need,” I’ve also stated it as “when forced to choose between dirty electricity and no electricity, people will choose dirty electricity every time.

But let’s consider the assertion that “it’s the hottest year on record.”

How can these “experts” be so certain? Historical temperature data is often incomplete, with vast regions lacking measurements. In 1884, for example, there was minimal to no data available for large parts of South America, Asia, Australia, the Arctic, Canada, Russia, Greenland, and all of Antarctica. This fact was actually recognized when the media tried to gin up a panic about the next Ice Age during the 1970’s.

A 1978 New York Times article highlighted the lack of data, specifically from the southern hemisphere, making it difficult to draw reliable conclusions about global temperature trends. Similarly, the Climatic Research Unit in England’s map for July 1884 exhibited significant regions with missing data, further compounding the challenge of constructing an accurate global temperature map.

Station relocations or environmental changes around stations (e.g., urban development) can alter readings. The urban “heat island effect” has been identified as a serious issue by several climate scientists.

Ocean temperatures must be considered, and there are many challenges in determining the average ocean temperature. The ocean’s immense volume makes comprehensive sampling difficult. Different areas and depths of the ocean can have drastically different temperatures. Past measurements were often limited to specific shipping routes, providing incomplete coverage. And the role of ocean currents on climate, which is important, is neglected in favor of making the life-essential gas, carbon dioxide, the main culprit in the “climate crisis” myth.

But even if this were the “hottest year on record”, would it really be only due to carbon dioxide from the burning of fossil fuels?

I would like to introduce the Bray and Eddy cycles, two significant solar cycles that have been observed to influence Earth’s climate over long periods.

The Bray cycle has a periodicity of approximately 2450 years, and lows in the cycle are associated with colder periods and glacial advances. The Eddy cycle, also called the millennial cycle band, is related to grand solar minima, which occurs approximately every 1000 years.

The cycles tend to influence climate through several mechanisms:

  • Changes in stratospheric ozone content and pressures.
  • Alterations in tropospheric weather patterns.
  • Impacts on wind patterns, ocean currents, precipitation, and global average temperature.

The interaction between these cycles can lead to more severe cold periods when their lows coincide..and warm periods when their highs match.  While the exact mechanisms are not fully understood, plenty of evidence suggests these solar cycles play a significant role in long-term climate variability.

As many at Legal Insurrection point out, correlation is not causation.

The only takeaways from the coal use data are that countries with sensible leaders are looking to the energy needs of their citizens and that climate is too complex an issue to attribute to a gas that is 0.04% of Earth’s atmosphere.


Discover more from Watts Up With That?

Subscribe to get the latest posts sent to your email.

via Watts Up With That?

https://ift.tt/5Mbz7oi

December 22, 2024 at 12:02AM

Dennis Overbye Retiring

News Note by Kip Hansen — 21 December 2024

I often poke fun, mock and criticize the science reporting in the New York Times.  It has been some time, maybe more than a decade, since I have had faith in the Times’ science desk to report straightforward,  unbiased and  plain-language explanatory science, medical and environmental news.  Gone are the days of the often very good Andy Revkin and several others (remind me of their names in the comments, please)  that tried to write rationally about the swirling controversies in science and medicine at the turn of the century.

But there was always one science journalist that could always counted on to give it to us straight – regardless of the fact that many of his topics were fantastical far-out speculations from my generation of physicists,  astronomers and philosophers of science that may or may not have ingested far too many hallucinogens in their late-1960’s university years. 

That would be:

Dennis Overbye

There is a seemingly endless list of this journalistic output at his “by line” page here.   He wrote the Out There column in the Space and Astronomy section of the Times.

Overbye gives his own “eulogy” upon retirement in a piece titled: A Solstice of the Soul.   Recommended reading for all science and astronomy folk.

In it he makes these important points about science:

“After 50 years and $10 billion, physicists finally discovered the Higgs boson (or “God particle”). It was the missing key to physicists’ best, but still unsatisfying, theory of nature yet, called the Standard Model.”

….

“Astronomers discovered that there are billions of possibly habitable planets in the galaxy.”

….

“At the same time, they have had to accept that 95 percent of the cosmos consists of invisible ‘dark matter’ that binds stars in galaxies and a ‘dark energy’ that pushes those same galaxies apart ever faster. Nobody knows what this dark stuff is.”

….

“I came of age in the Sputnik era, when science and space exploration suddenly became a national priority in the United States. …. Scientists were potential saviors and heroes; everything was possible. Later, giant particle accelerators were built to explore the mysteries of inner space. The Berlin Wall fell. The fruits of innovation flowed: the transistor, the internet, CT scans and MRIs, global positioning systems, Nobel Prizes.”

….

“The political response to Covid has cast doubt on the very concept of public health; the political response to climate change has cast doubt on the concept of scientific expertise.”

….

“Artificial intelligence has become frighteningly smart. Silicon Valley has led us to new realms of loneliness, squinting at tiny screens for fragile intimations of community.”

….

“And yet science, proceeding on skepticism, not certainty, is arguably the most successful human activity of all time. Its truths are temporary; progress, the saying goes, comes only at the funerals of philosophers and cosmologists.”

….

“We don’t know why there is something instead of nothing at all. Or why God plays dice, as Einstein put it as he mulled the randomness implicit in quantum mechanics, the house rules of the subatomic realm.”

….

“John Archibald Wheeler, the physicist who pioneered the study of black holes, liked to say, “We will first understand how simple the universe is when we realize how strange it is”.  …. 

“Going forward” Overbye says, “my money is on confusion.”

….

Fare well, Dennis.   But, I’m sure that you will continue writing and publishing in the NY Times, despite official retirement.  I sure hope so….

# # # # #

Author’s Comment:

Love ‘im or hate ‘im, he set the bar, sometimes too high, for his fellow journalists at the Times.  I, for one, will miss his columns.

Don’t fret, he won’t be able to quit writing.  There are several authors here that will attest to the fact that once it is in you blood, you can’t stop, even if you are determined to do so.  I am a successful quitter: I quit drugs, quit alcohol, quit tobacco even!  I have tried to quit writing … more than once, but it has done me little good – I’ve slowed down but can’t give it up.

By the way, we need more good writers here …. more good journalistic plain language explanations the basics of science that affect climate, exposés of media-as-propaganda, debunking of the endlessly repeated Climate Crisis Talking Points (all which are false) and just plain interesting things about science and nature.  Chip in, use the Submit a Story link.  

Thanks for reading.

# # # # #


Discover more from Watts Up With That?

Subscribe to get the latest posts sent to your email.

via Watts Up With That?

https://ift.tt/1JmwZqc

December 21, 2024 at 08:06PM

Record Sea Ice Caused By Global Warming

In 2014, NOAA explained that record high levels of Antarctic sea ice were caused by global warming. “So as counterintuitive as expanding winter Antarctic sea ice may appear on a warming planet, it may actually be a manifestation of recent … Continue reading →

via Real Climate Science

https://ift.tt/saJ1e2n

December 21, 2024 at 06:28PM

2024 Natural Climate Factors: Snow

Previously I posted an explanation by Dr. Judah Cohen regarding a correlation between autumn Siberian snow cover and the following winter conditions, not only in the Arctic but extending across the Northern Hemisphere. More recently, in looking into Climate Model Upgraded: INMCM5, I noticed some of the scientists were also involved in confirming the importance of snow cover for climate forecasting. Since the poles function as the primary vents for global cooling, what happens in the Arctic in no way stays in the Arctic. This post explores data suggesting changes in snow cover drive some climate changes.

The Snow Cover Climate Factor

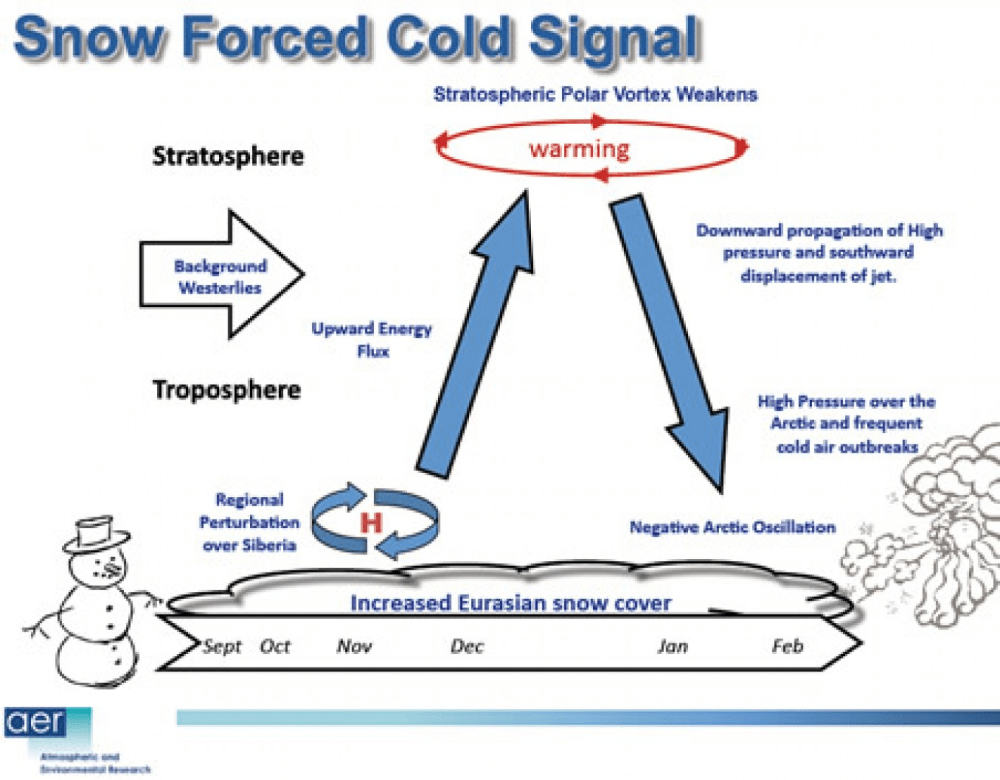
The diagram represents how Dr. Judah Cohen pictures the Northern Hemisphere wintertime climate system.  He leads research regarding Arctic and NH weather patterns for AER.

cohen-schematic2

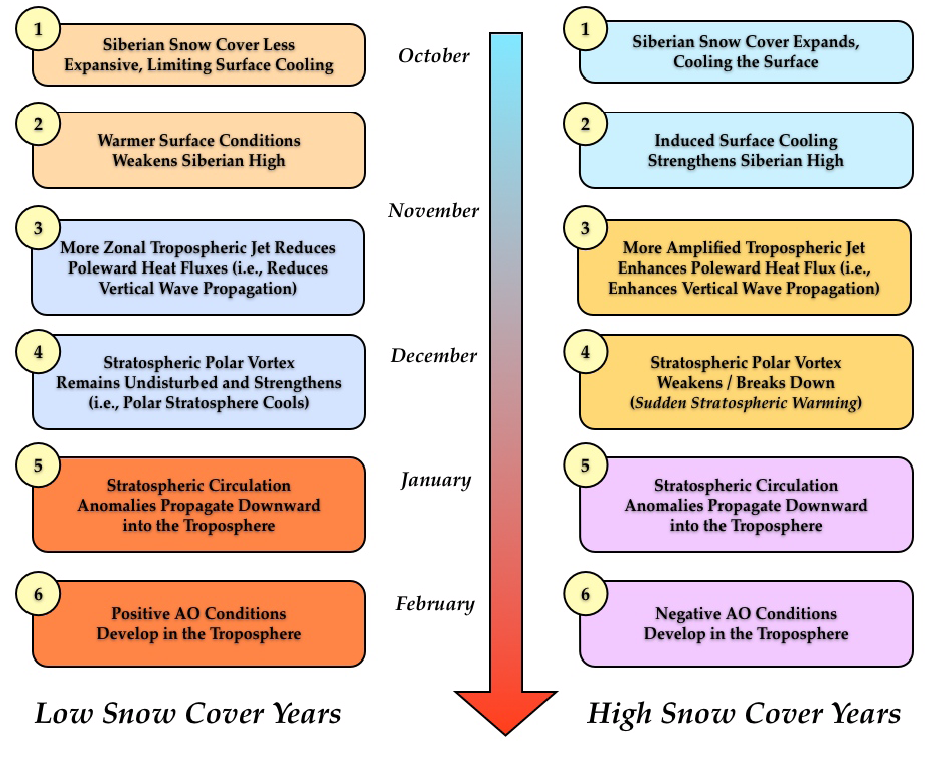
Dr. Cohen explains the mechanism in this diagram.

Conceptual model for how fall snow cover modifies winter circulation in both the stratosphere and the troposphere–The case for low snow cover on left; the case for extensive snow cover on right.

1. Snow cover increases rapidly in the fall across Siberia, when snow cover is above normal diabatic cooling helps to;
2. Strengthen the Siberian high and leads to below normal temperatures.
3. Snow forced diabatic cooling in proximity to high topography of Asia increases upward flux of energy in the troposphere, which is absorbed in the stratosphere.
4. Strong convergence of WAF (Wave Activity Flux) indicates higher geopotential heights.
5. A weakened polar vortex and warmer down from the stratosphere into the troposphere all the way to the surface.
6. Dynamic pathway culminates with strong negative phase of the Arctic Oscillation at the surface.

From Eurasian Snow Cover Variability and Links with Stratosphere-Troposphere
Coupling and Their Potential Use in Seasonal to Decadal Climate Predictions by Judah Cohen.

Observations of the Snow Climate Factor

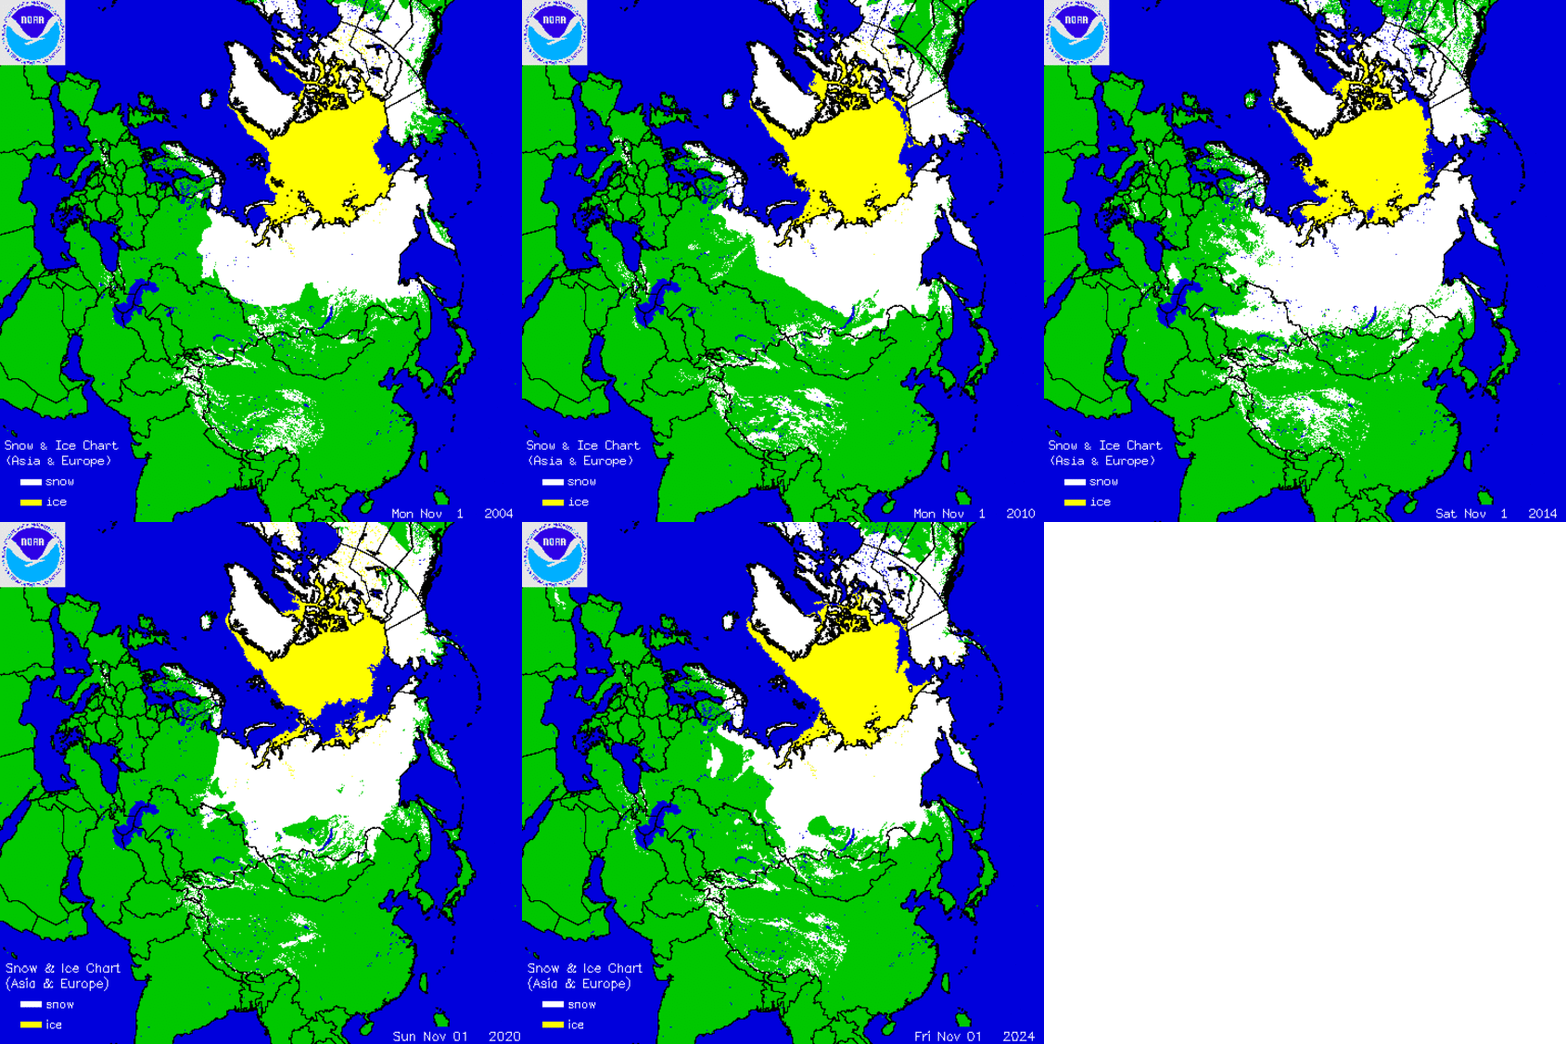
The animation at the top shows from remote sensing that Eurasian snow cover fluctuates significantly from year to year, taking the end of October as a key indicator.

For more than five decades the IMS snow cover images have been digitized to produce a numerical database for NH snow cover, including area extents for Eurasia. The NOAA climate data record of Northern Hemisphere snow cover extent, Version 1, is archived and distributed by NCDC’s satellite Climate Data Record Program. The CDR is forward processed operationally every month, along with figures and tables made available at Rutgers University Global Snow Lab.

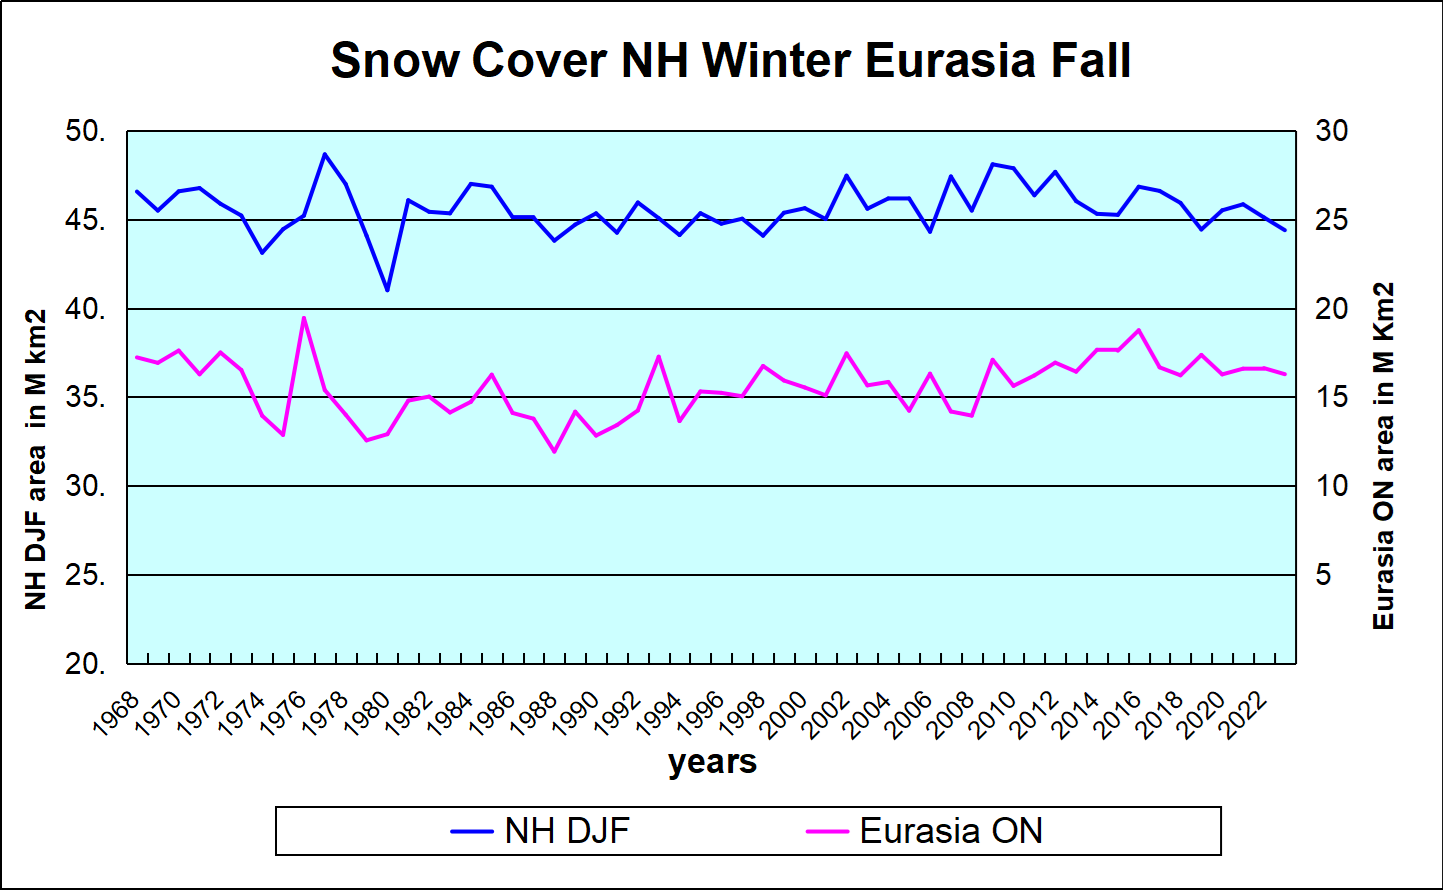
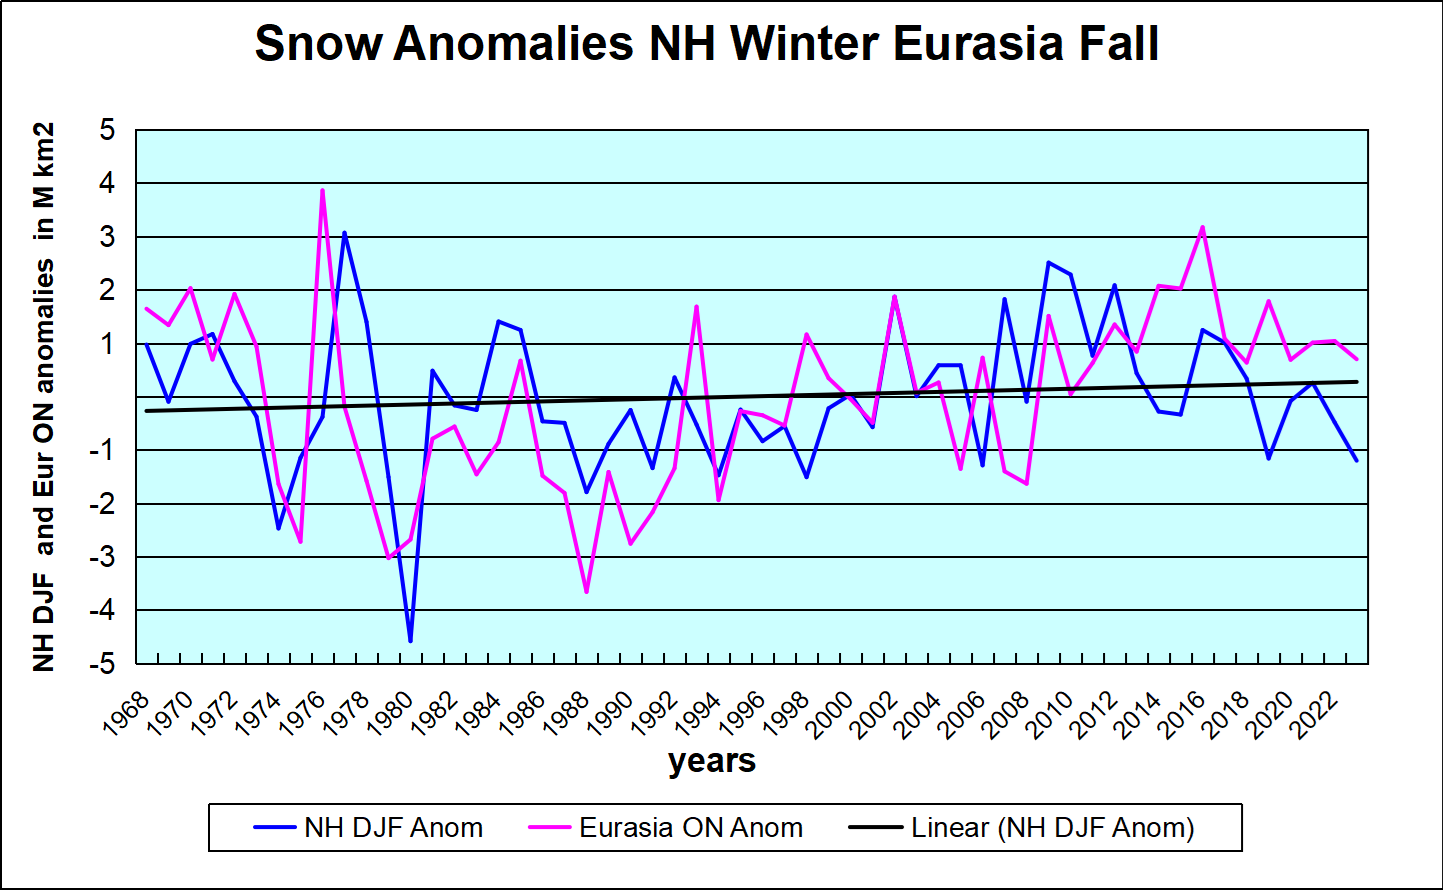
This first graph shows the snow extents of interest in Dr. Cohen’s paradigm. The Autumn snow area in Siberia is represented by the annual Eurasian averages of the months of October and November (ON). The following NH Winter is shown as the average snow area for December, January and February (DJF). Thus the year designates the December of that year plus the first two months of the next year.


Notes: NH snow cover minimum was 1981, trending upward since.  Siberian autumn snow cover was lowest in 1989, increasing since then.  Autumn Eurasian snow cover is about 1/3 of Winter NH snow area. Note also that fluctuations are sizable and correlated.


The second graph presents annual anomalies for the two series, each calculated as the deviation from the mean of its entire time series. Strikingly, the Eurasian Autumn flux is on the same scale as total NH flux, and closely aligned. While NH snow cover declined a few years prior to 2016, Eurasian snow has trended upward afterward.  If Dr. Cohen is correct, NH snowfall will follow. The linear trend is slightly positive, suggesting that fears of children never seeing snowfall have been exaggerated. The Eurasian trend line (not shown) is almost the same.

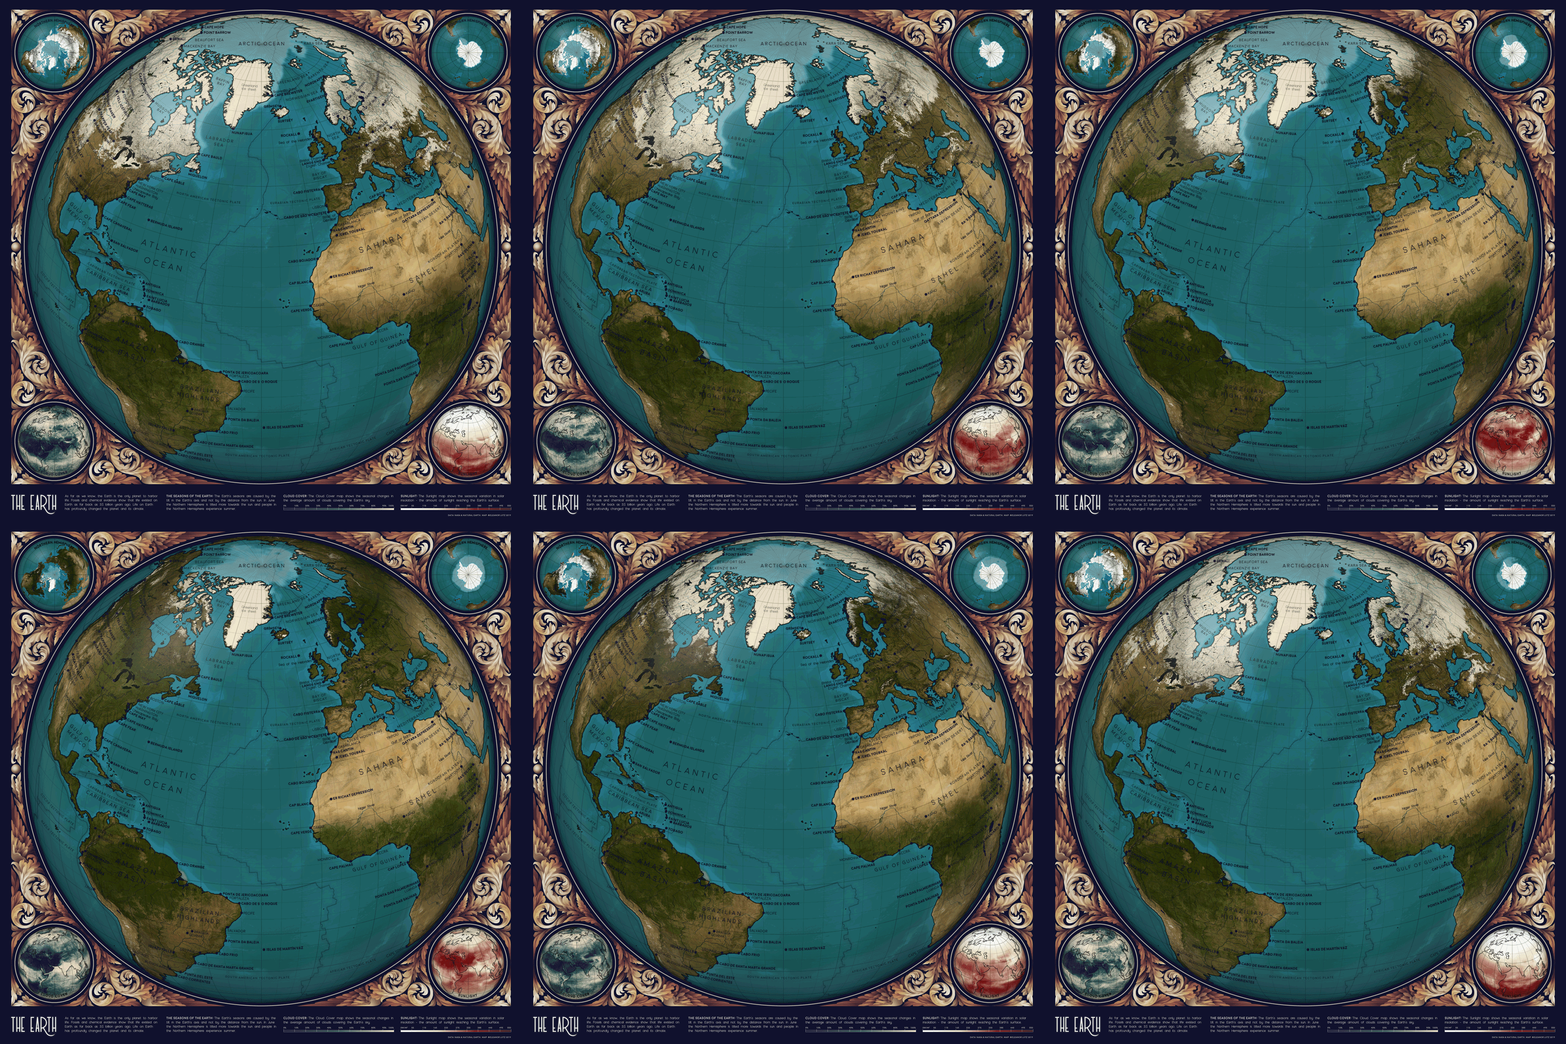
Illustration by Eleanor Lutz shows Earth’s seasonal climate changes. If played in full screen, the four corners present views from top, bottom and sides. It is a visual representation of scientific datasets measuring ice and snow extents.


via Science Matters

https://ift.tt/Qo8Z4XC

December 21, 2024 at 05:14PM