Aussie AEMO to use Voltage Spikes to Force Disconnect Rooftop Solar

First published JoNova: “… AEMO said the ever growing output from solar was posing an increasing threat to the safety and security of the grid …”

AEMO says emergency powers to switch off solar needed in every state amid ‘system collapse’ fears

By energy reporter Daniel Mercer
Topic:Energy Industry
Mon 2 Dec

The body responsible for keeping the lights on in Australia’s biggest electricity grids wants emergency powers to switch off or throttle rooftop solar in every state to help cope with the daily flood of output from millions of systems.

In a report released on Monday morning, the Australian Energy Market Operator said “emergency backstop” powers were urgently needed to ensure solar installations could be turned down — or off — in extreme circumstances.

…

AEMO said the ever growing output from solar was posing an increasing threat to the safety and security of the grid because it was pushing out all other forms of generation that were needed to help keep the system stable.

And it warned that unless it had the power to reduce — or curtail — the amount of rooftop solar times, more drastic and damaging measures would need to be taken.

These could include increasing the voltage levels in parts of the poles-and-wires network to “deliberately” trip or curtail small-scale solar in some areas.

…

Read more: https://www.abc.net.au/news/2024-12-02/aemo-demands-emergency-backstop-to-switch-off-solar/104670332

The Australian Energy Market Operator (AEMO) is the industry body responsible for the stability of Australia’s East Coast electricity grid.

From the AEMO website;

Minimum operational demand

02/12/2024

The following quotes can be attributed to AEMO’s Executive General Manager – Operations, Michael Gatt.

Australia’s electricity system was originally designed for power to flow from large power stations through a network of substations and power lines into homes and businesses.

Today, electricity from millions of rooftop solar systems feed back into the grid, which can at times generate enough power to meet half of total demand across the National Electricity Market.

As the market operator, we’re aware that high contributions of rooftop solar coinciding with certain system conditions needs to be carefully managed to ensure electricity reliability and grid security while managing power system risks.

For several years, AEMO has flagged these emerging risks and with the support of state governments and network operators are developing appropriate emergency solutions.

AEMO’s ‘Supporting secure operation with high levels of distributed resources’ report provides stakeholders with a status assessment on some of the new capabilities required to securely operate the NEM in periods with high levels of generation from rooftop solar and low demand.

AEMO does not want to directly control people’s rooftop solar.

In rare circumstances AEMO may need to take action to secure the grid, such as directing off grid-scale generation, to solve these emergency events which often occur at the same time as unplanned generation and transmission outages.

However, after all these actions have been exhausted, the temporary management of rooftop solar by network operators under state government solar management programs may still be required although we expect this may only occur in very rare circumstances.

These actions assist in keeping the power system secure, while also enabling the growth of rooftop solar installations.

AEMO is supporting the continued uptake of rooftop solar, residential batteries and electric vehicles while maintaining reliable electricity support through a secure grid.

We’re doing this by contributing to new market designs, trials and research, which will continue through the National CER Roadmap, approved by Australia’s Energy Ministers in July.

The CER Roadmap sets out an overarching vision and plan to unlock CER at scale and identifies measures to “unleash the full potential of CER” by establishing the required mechanisms, tools and systems.

This includes measures to support ongoing power system security, particularly the requirement for backstop mechanisms to be in place by the end of 2025 for emergency response to ensure operational security when required.

It also includes reforms to increase the opportunities for market participation of CER, including through enhanced coordination, allowing customers to respond to market-based incentives which will also help meet the challenges of low operational demand.

Ends…

Background

State rooftop solar management programs: Queensland, South Australia, Western Australiaand Victoria.

Read more: https://aemo.com.au/newsroom/media-release/minimum-operational-demand

Spiking grid voltage, deliberately spiking grid voltage to trip safety systems seems insanely dangerous. Even a brief voltage excursion could start house fires.

Electronic devices are designed to run within a narrow band of voltage and frequency conditions. While some devices such as laptops and TVs are usually very tolerant of large deviations from the expected voltage band, other devices such as large electric motors, especially appliance motors such as clothes washing machine motors or electric clothes dryers, they might not be so tolerant.

In addition a voltage spike sufficient to trip solar panels could also trip house breakers, leading to food spoilage in refrigerators and freezers.

It is time to bring this insane rooftop solar experiment to an end. It clearly isn’t working, given the energy grid operator has suggested deliberately sabotaging grid voltage might be an acceptable emergency protocol to disconnect rooftop solar from the grid.

via Watts Up With That?

https://ift.tt/YbrkFeQ

December 4, 2024 at 02:46AM

THE UK PUBLIC START TO QUESTION COUNCILS ON “CLIMATE EMERGENCY” MOTIONS

 The following short video shows members of the public attending a council meeting to challenge councillors on their "climate emergency" stance, and finds they are now considering taking a fresh look at it. 

Is there a Climate EMERGENCY in Colchester?

via climate science

https://ift.tt/uDPWnKZ

December 4, 2024 at 01:55AM

Interesting:

New study reveals how monitoring atmospheric electric fields can enhance the prediction of severe weather events. The researchers found significant electric field changes during heavy precipitation by analyzing data from southern Israel. These findings suggest that electric field measurements can serve as early indicators for extreme weather, offering vital nowcasting capabilities, particularly in regions prone to flash floods and sudden shifts in weather.

 A new study led by Dr. Roy Yaniv from the Institute of Earth Sciences at The Hebrew University of Jerusalem and Sheba Medical Center, in collaboration with Dr. Assaf Hochman from The Hebrew University and Prof. Yoav Yair from Reichmann University, has made significant advances in understanding how atmospheric electric field measurements can help predict severe weather events. By closely examining low-pressure winter weather systems, known as ‘Cyprus Lows,’ in the arid Negev Desert of southern Israel, this research reveals new insights into the role of the electric field in anticipating heavy precipitation.

Focusing on ‘wet’ Cyprus Lows—situations where rain falls as a cold front moves through—researchers observed substantial increases in the Potential Gradient of the electric field. Minute-by-minute data showed Potential Gradient values rising sharply from typical fair-weather levels (around 100-200 volts per meter) to hundreds and even thousands of volts per meter during rainfall. These surges occurred as convective clouds passed overhead, indicating that different cloud types produce unique electric field patterns. The study also highlighted that factors beyond rain intensity, such as cloud structure and the electrical charge of rain droplets, play roles in these electric fluctuations.

Through these findings, the researchers identified how electric field variations correlate with specific weather conditions. This enhanced understanding of electric field responses to weather events could significantly improve nowcasting systems for predicting extreme weather, particularly in regions prone to flash floods and sudden weather changes. In Israel, situated between desert and Mediterranean climates, slight shifts in a low-pressure system’s location can lead to dramatic changes in local weather. Consequently, monitoring electric field dynamics may provide early warning signs of severe weather, enhancing community preparedness in a changing climate.

“This research demonstrates how electric field variations can serve as indicators of shifting weather patterns, allowing us to anticipate severe weather events in real-time,” said Dr. Roy Yaniv. “The ability to identify these changes early is especially crucial in vulnerable regions like Israel, where even minor shifts in climate conditions can lead to major local impacts.”

This study highlights the importance of incorporating electric field observations into weather monitoring systems, particularly in arid and semi-arid regions that are increasingly vulnerable to the impacts of climate change.


via Watts Up With That?

https://ift.tt/MeGyaOU

December 3, 2024 at 08:04PM

Global Big Chill UAH November 2024

The post below updates the UAH record of air temperatures over land and ocean. Each month and year exposes again the growing disconnect between the real world and the Zero Carbon zealots.  It is as though the anti-hydrocarbon band wagon hopes to drown out the data contradicting their justification for the Great Energy Transition.  Yes, there was warming from an El Nino buildup coincidental with North Atlantic warming, but no basis to blame it on CO2.  

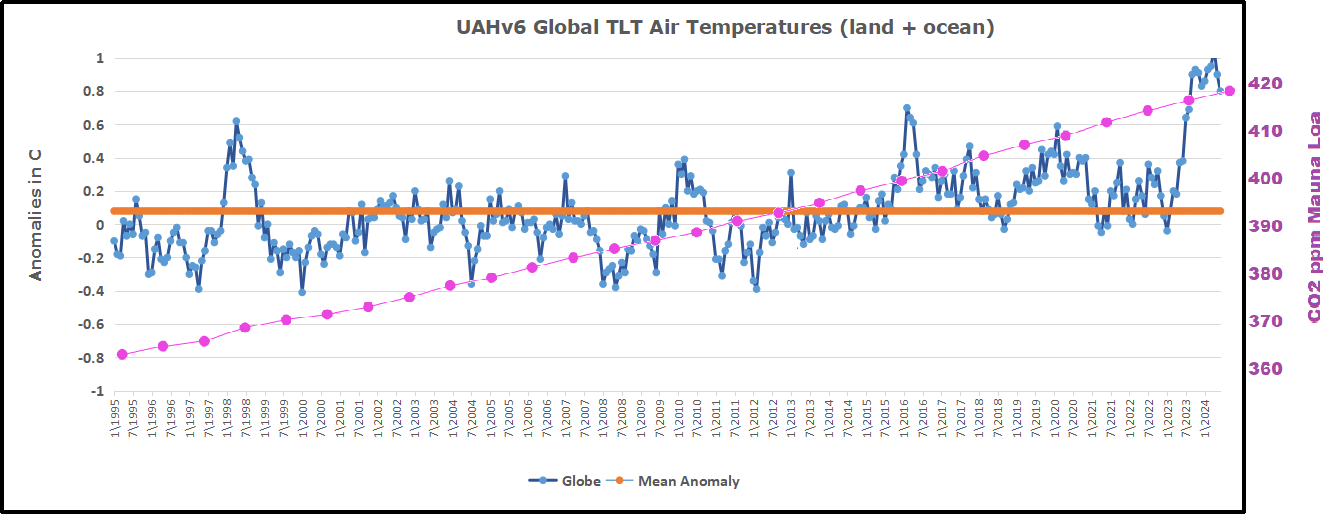
As an overview consider how recent rapid cooling  completely overcame the warming from the last 3 El Ninos (1998, 2010 and 2016).  The UAH record shows that the effects of the last one were gone as of April 2021, again in November 2021, and in February and June 2022  At year end 2022 and continuing into 2023 global temp anomaly matched or went lower than average since 1995, an ENSO neutral year. (UAH baseline is now 1991-2020). Now we have had an usual El Nino warming spike of uncertain cause, unrelated to steadily rising CO2 and now dropping rapidly.

For reference I added an overlay of CO2 annual concentrations as measured at Mauna Loa.  While temperatures fluctuated up and down ending flat, CO2 went up steadily by ~60 ppm, a 15% increase.

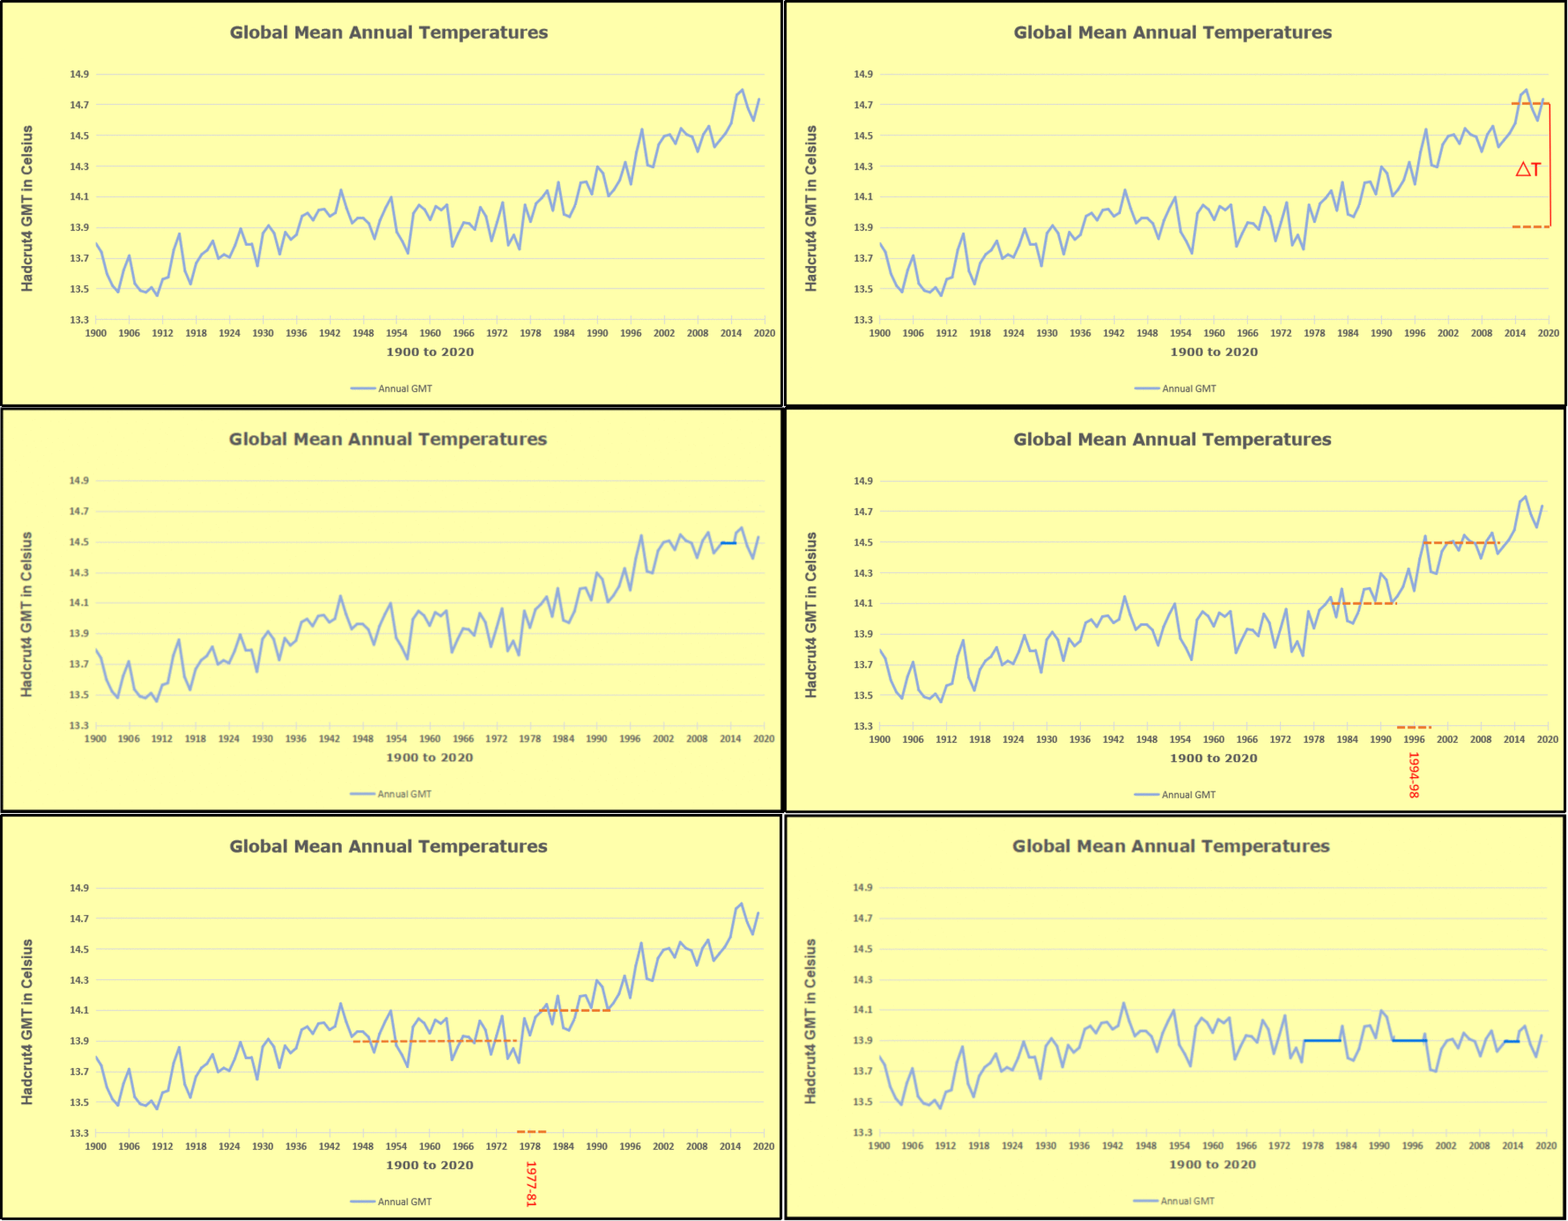
Furthermore, going back to previous warmings prior to the satellite record shows that the entire rise of 0.8C since 1947 is due to oceanic, not human activity.

gmt-warming-events

The animation is an update of a previous analysis from Dr. Murry Salby.  These graphs use Hadcrut4 and include the 2016 El Nino warming event.  The exhibit shows since 1947 GMT warmed by 0.8 C, from 13.9 to 14.7, as estimated by Hadcrut4.  This resulted from three natural warming events involving ocean cycles. The most recent rise 2013-16 lifted temperatures by 0.2C.  Previously the 1997-98 El Nino produced a plateau increase of 0.4C.  Before that, a rise from 1977-81 added 0.2C to start the warming since 1947.

Importantly, the theory of human-caused global warming asserts that increasing CO2 in the atmosphere changes the baseline and causes systemic warming in our climate.  On the contrary, all of the warming since 1947 was episodic, coming from three brief events associated with oceanic cycles. And now in 2024 we have seen an amazing episode with a temperature spike driven by ocean air warming in all regions, along with rising NH land temperatures, now oscillating near its peak.

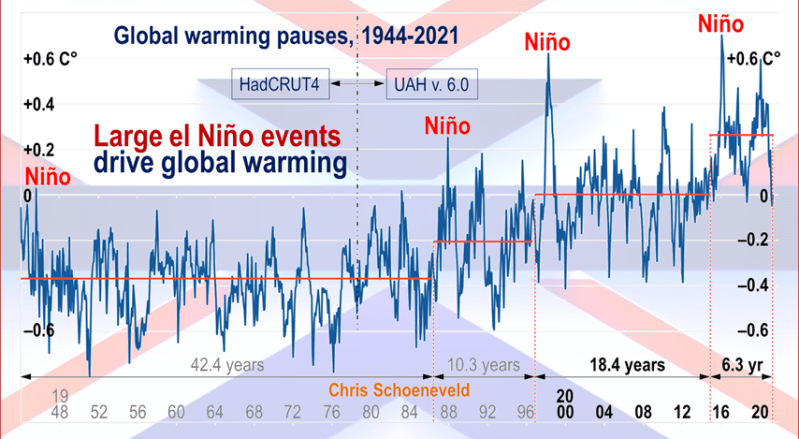
Chris Schoeneveld has produced a similar graph to the animation above, with a temperature series combining HadCRUT4 and UAH6. H/T WUWT

image-8


mc_wh_gas_web20210423124932

See Also Worst Threat: Greenhouse Gas or Quiet Sun?

November 2024 Global Big Chill Led by SH and Tropics banner-blog

With apologies to Paul Revere, this post is on the lookout for cooler weather with an eye on both the Land and the Sea.  While you heard a lot about 2020-21 temperatures matching 2016 as the highest ever, that spin ignores how fast the cooling set in.  The UAH data analyzed below shows that warming from the last El Nino had fully dissipated with chilly temperatures in all regions. After a warming blip in 2022, land and ocean temps dropped again with 2023 starting below the mean since 1995.  Spring and Summer 2023 saw a series of warmings, continuing into October, followed by cooling. 

UAH has updated their TLT (temperatures in lower troposphere) dataset for October 2024. Due to one satellite drifting more than can be corrected, the dataset has been recalibrated and retitled as version 6.1 Graphs here contain this updated 6.1 data.  Posts on their reading of ocean air temps this month are ahead of the update from HadSST4.  I posted last month on SSTs Ocean Cools Further October 2024. These posts have a separate graph of land air temps because the comparisons and contrasts are interesting as we contemplate possible cooling in coming months and years.

Sometimes air temps over land diverge from ocean air changes. In July 2024 all oceans were unchanged except for Tropical warming, while all land regions rose slightly. In August we saw a warming leap in SH land, slight Land cooling elsewhere, a dip in Tropical Ocean temp and slightly elsewhere.  September showed a dramatic drop in SH land, overcome by a greater NH land increase. In October, ocean and land temps in both NH and Tropics dropped, pulling the global anomaly down. Now in November there was cooling everywhere, except only NH land temps.

Note:  UAH has shifted their baseline from 1981-2010 to 1991-2020 beginning with January 2021.   v6.1 data was recalibrated also starting with 2021. In the charts below, the trends and fluctuations remain the same but the anomaly values changed with the baseline reference shift.

Presently sea surface temperatures (SST) are the best available indicator of heat content gained or lost from earth’s climate system.  Enthalpy is the thermodynamic term for total heat content in a system, and humidity differences in air parcels affect enthalpy.  Measuring water temperature directly avoids distorted impressions from air measurements.  In addition, ocean covers 71% of the planet surface and thus dominates surface temperature estimates.  Eventually we will likely have reliable means of recording water temperatures at depth.

Recently, Dr. Ole Humlum reported from his research that air temperatures lag 2-3 months behind changes in SST.  Thus cooling oceans portend cooling land air temperatures to follow.  He also observed that changes in CO2 atmospheric concentrations lag behind SST by 11-12 months.  This latter point is addressed in a previous post Who to Blame for Rising CO2?

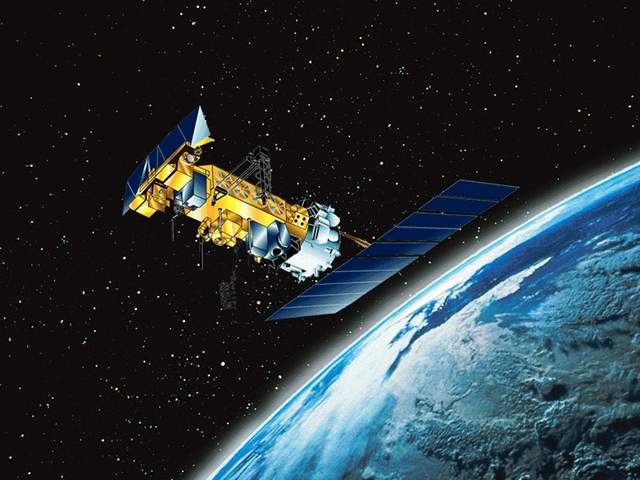
After a change in priorities, updates are now exclusive to HadSST4.  For comparison we can also look at lower troposphere temperatures (TLT) from UAHv6.1 which are now posted for October.  The temperature record is derived from microwave sounding units (MSU) on board satellites like the one pictured above. Recently there was a change in UAH processing of satellite drift corrections, including dropping one platform which can no longer be corrected. The graphs below are taken from the revised and current dataset.

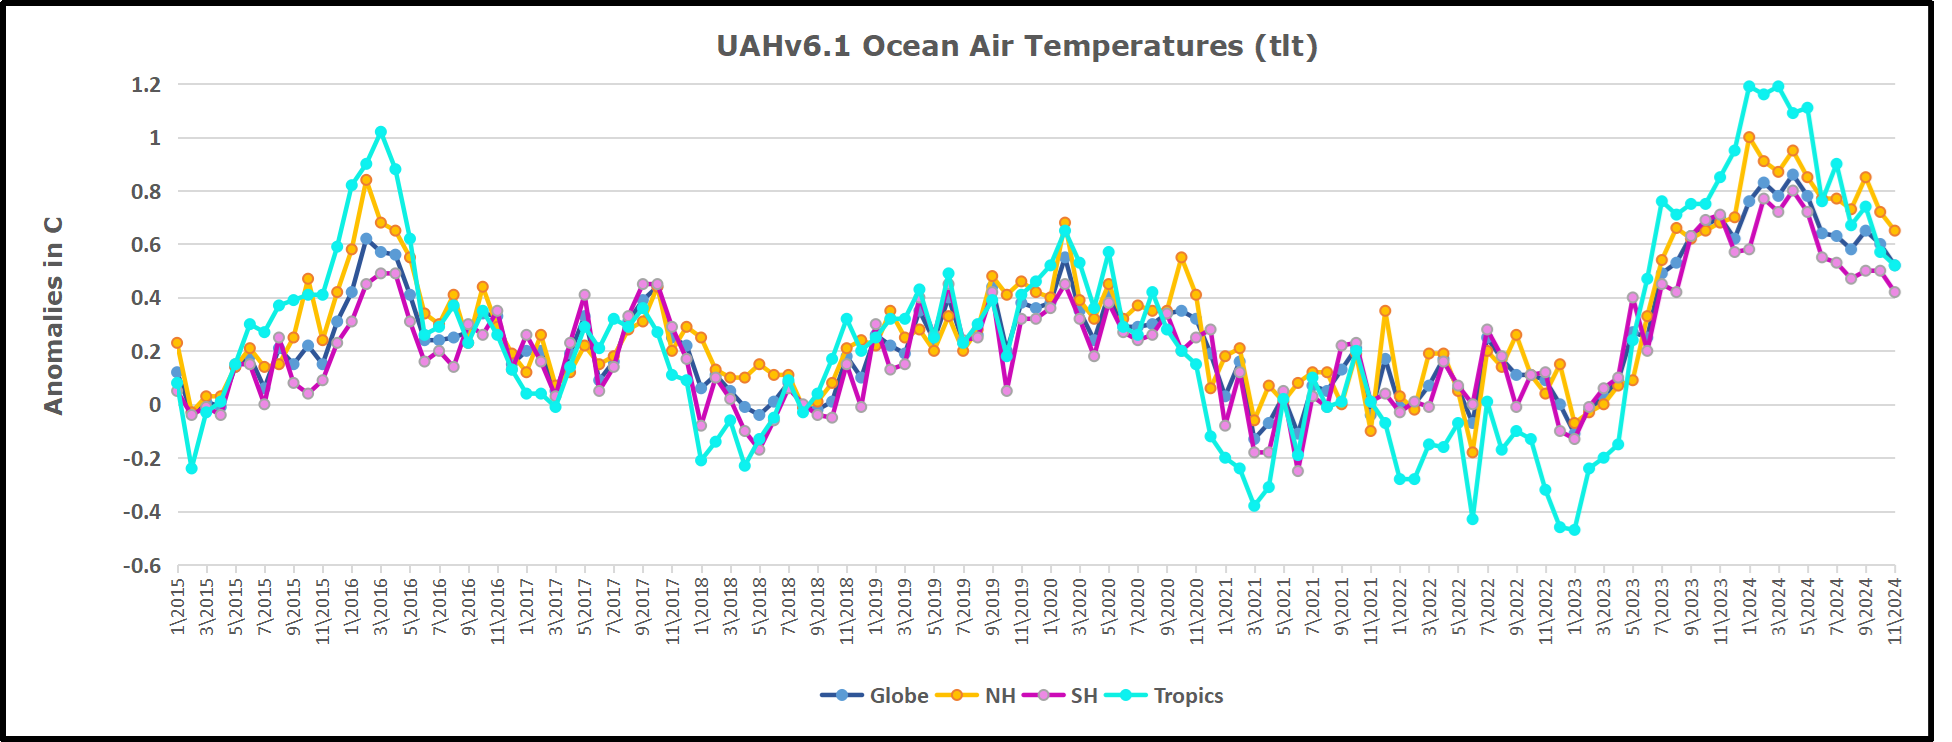
The UAH dataset includes temperature results for air above the oceans, and thus should be most comparable to the SSTs. There is the additional feature that ocean air temps avoid Urban Heat Islands (UHI).  The graph below shows monthly anomalies for ocean air temps since January 2015.

In 2021-22, SH and NH showed spikes up and down while the Tropics cooled dramatically, with some ups and downs, but hitting a new low in January 2023. At that point all regions were more or less in negative territory. 

After sharp cooling everywhere in January 2023, there was a remarkable spiking of Tropical ocean temps from -0.5C up to + 1.2C in January 2024.  The rise was matched by other regions in 2024, such that the Global anomaly peaked at 0.95C in May, Since then the Tropics and the Global anomaly have cooled down to 0.5C, as well as SH dropping down to 0.4C in November.

Land Air Temperatures Tracking in Seesaw Pattern

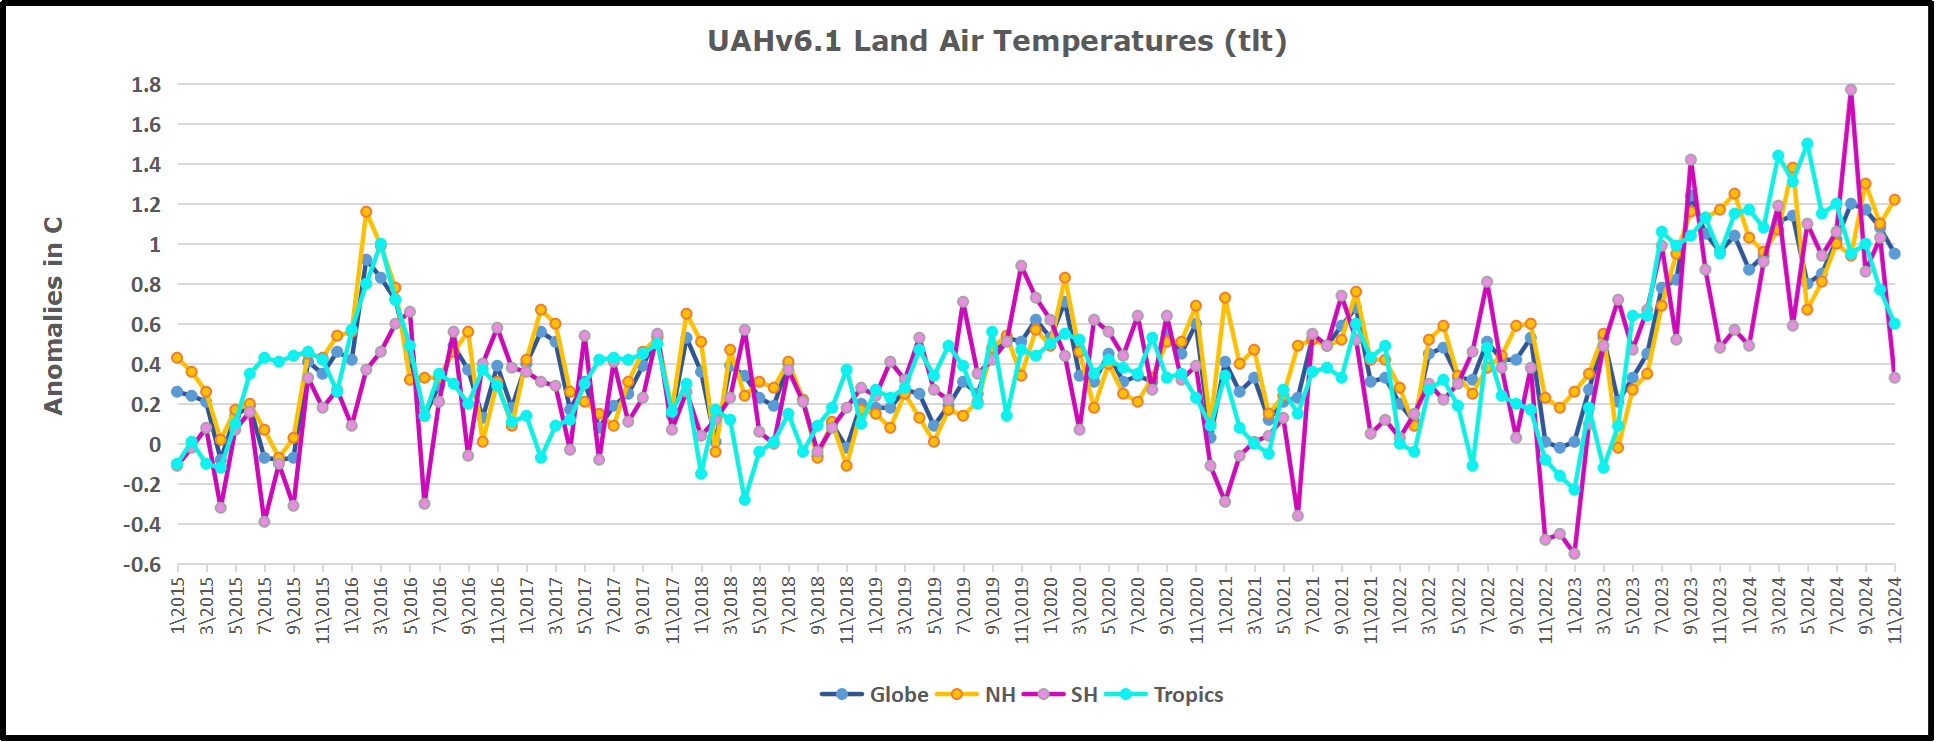
We sometimes overlook that in climate temperature records, while the oceans are measured directly with SSTs, land temps are measured only indirectly.  The land temperature records at surface stations sample air temps at 2 meters above ground.  UAH gives tlt anomalies for air over land separately from ocean air temps.  The graph updated for November is below.


Here we have fresh evidence of the greater volatility of the Land temperatures, along with extraordinary departures by SH land.  The seesaw pattern in Land temps is similar to ocean temps 2021-22, except that SH is the outlier, hitting bottom in January 2023. Then exceptionally SH goes from -0.6C up to 1.4C in September 2023 and 1.8C in  August 2024, with a large drop in between.  Now in November, SH and the Tropics have pulled the Global Land anomaly further down despite a bump in NH land temps.

The Bigger Picture UAH Global Since 1980

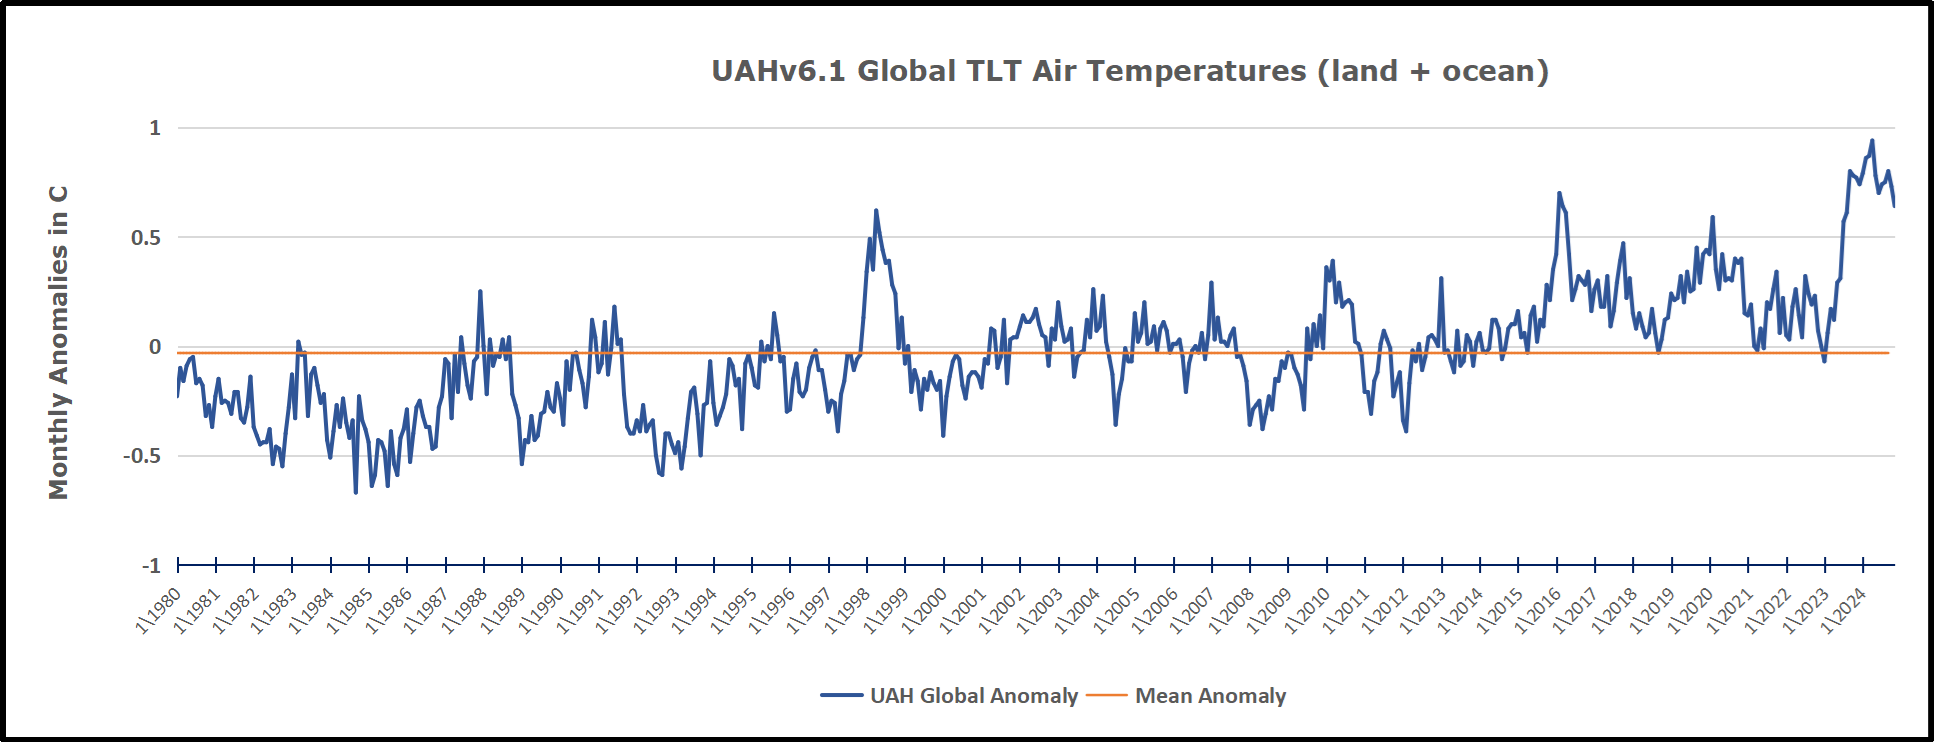
The chart shows monthly Global Land and Ocean anomalies starting 01/1980 to present.  The average monthly anomaly is -0.03, for this period of more than four decades.  The graph shows the 1998 El Nino after which the mean resumed, and again after the smaller 2010 event. The 2016 El Nino matched 1998 peak and in addition NH after effects lasted longer, followed by the NH warming 2019-20.   An upward bump in 2021 was reversed with temps having returned close to the mean as of 2/2022.  March and April brought warmer Global temps, later reversed

With the sharp drops in Nov., Dec. and January 2023 temps, there was no increase over 1980. Then in 2023 the buildup to the October/November peak exceeded the sharp April peak of the El Nino 1998 event. It also surpassed the February peak in 2016. In 2024 March and April took the Global anomaly to a new peak of 0.94C.  The cool down started with May dropping to 0.9C, and in June a further decline to 0.8C.  October went down to 0.7C and now in November dropped to 0.6C

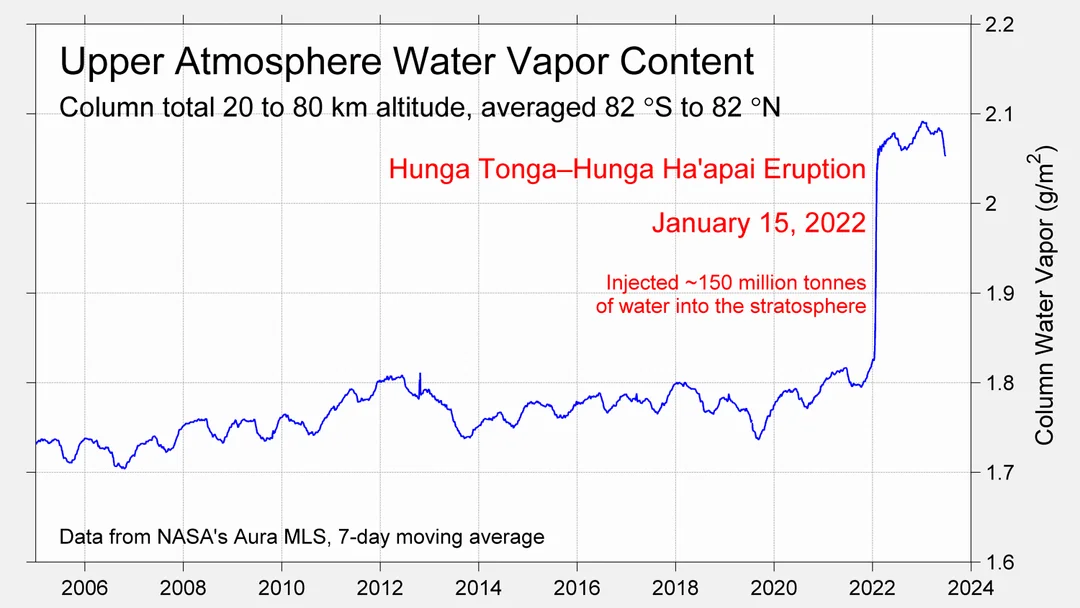
The graph reminds of another chart showing the abrupt ejection of humid air from. Hunga Tonga eruption.

TLTs include mixing above the oceans and probably some influence from nearby more volatile land temps.  Clearly NH and Global land temps have been dropping in a seesaw pattern, nearly 1C lower than the 2016 peak.  Since the ocean has 1000 times the heat capacity as the atmosphere, that cooling is a significant driving force.  TLT measures started the recent cooling later than SSTs from HadSST4, but are now showing the same pattern. Despite the three El Ninos, their warming had not persisted prior to 2023, and without them it would probably have cooled since 1995.  Of course, the future has not yet been written.


via Science Matters

https://ift.tt/3BANlR4

December 3, 2024 at 04:10PM