UAH v6.1 Global Temperature Update for November, 2024: +0.64 deg. C

From Dr Roy Spencer’s Global Warming Blog

by Roy W. Spencer, Ph. D.

Metop-C Satellite Added to Our Processing

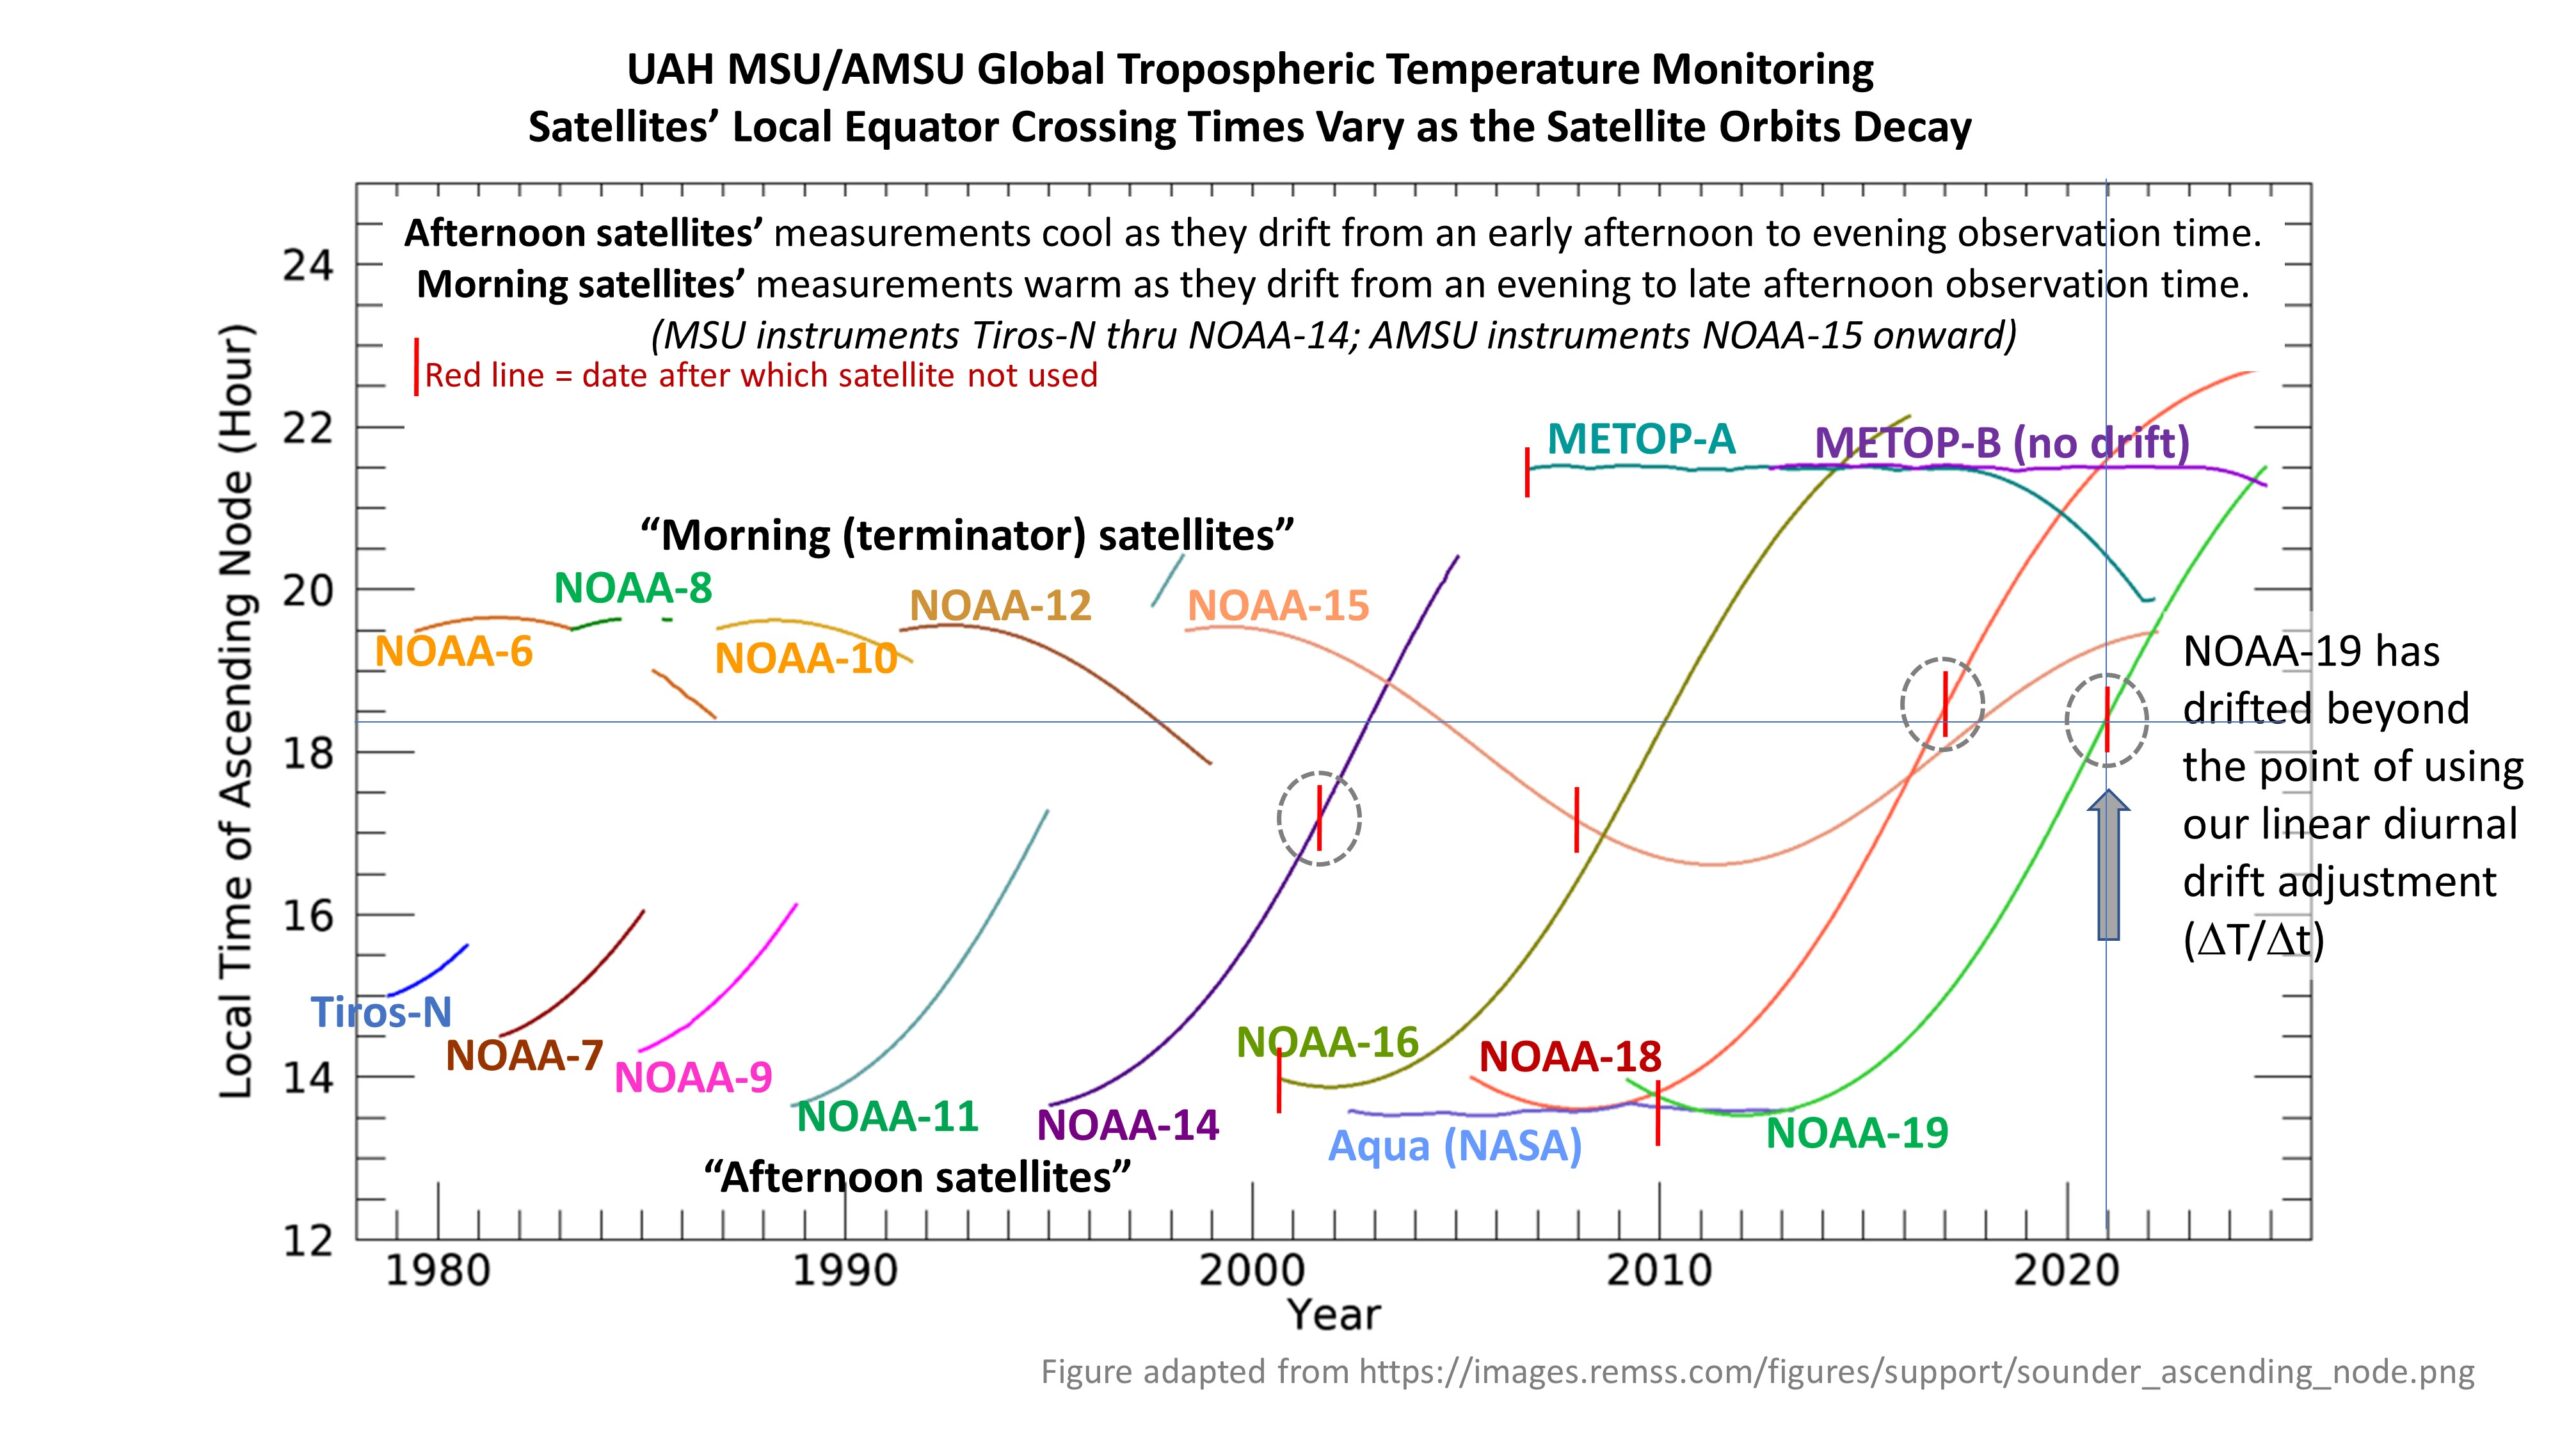
With this update, we have added Metop-C to our processing, so along with Metop-B we are back to having two satellites in the processing stream. The Metop-C data record begins in July of 2019. Like Metop-B, Metop-C was designed to use fuel to maintain its orbital altitude and inclination, so (until fuel reserves are depleted) there is no diurnal drift adjustment needed. Metop-B is beginning to show some drift in the last year or so, but it’s too little at this point to worry about any diurnal drift correction.

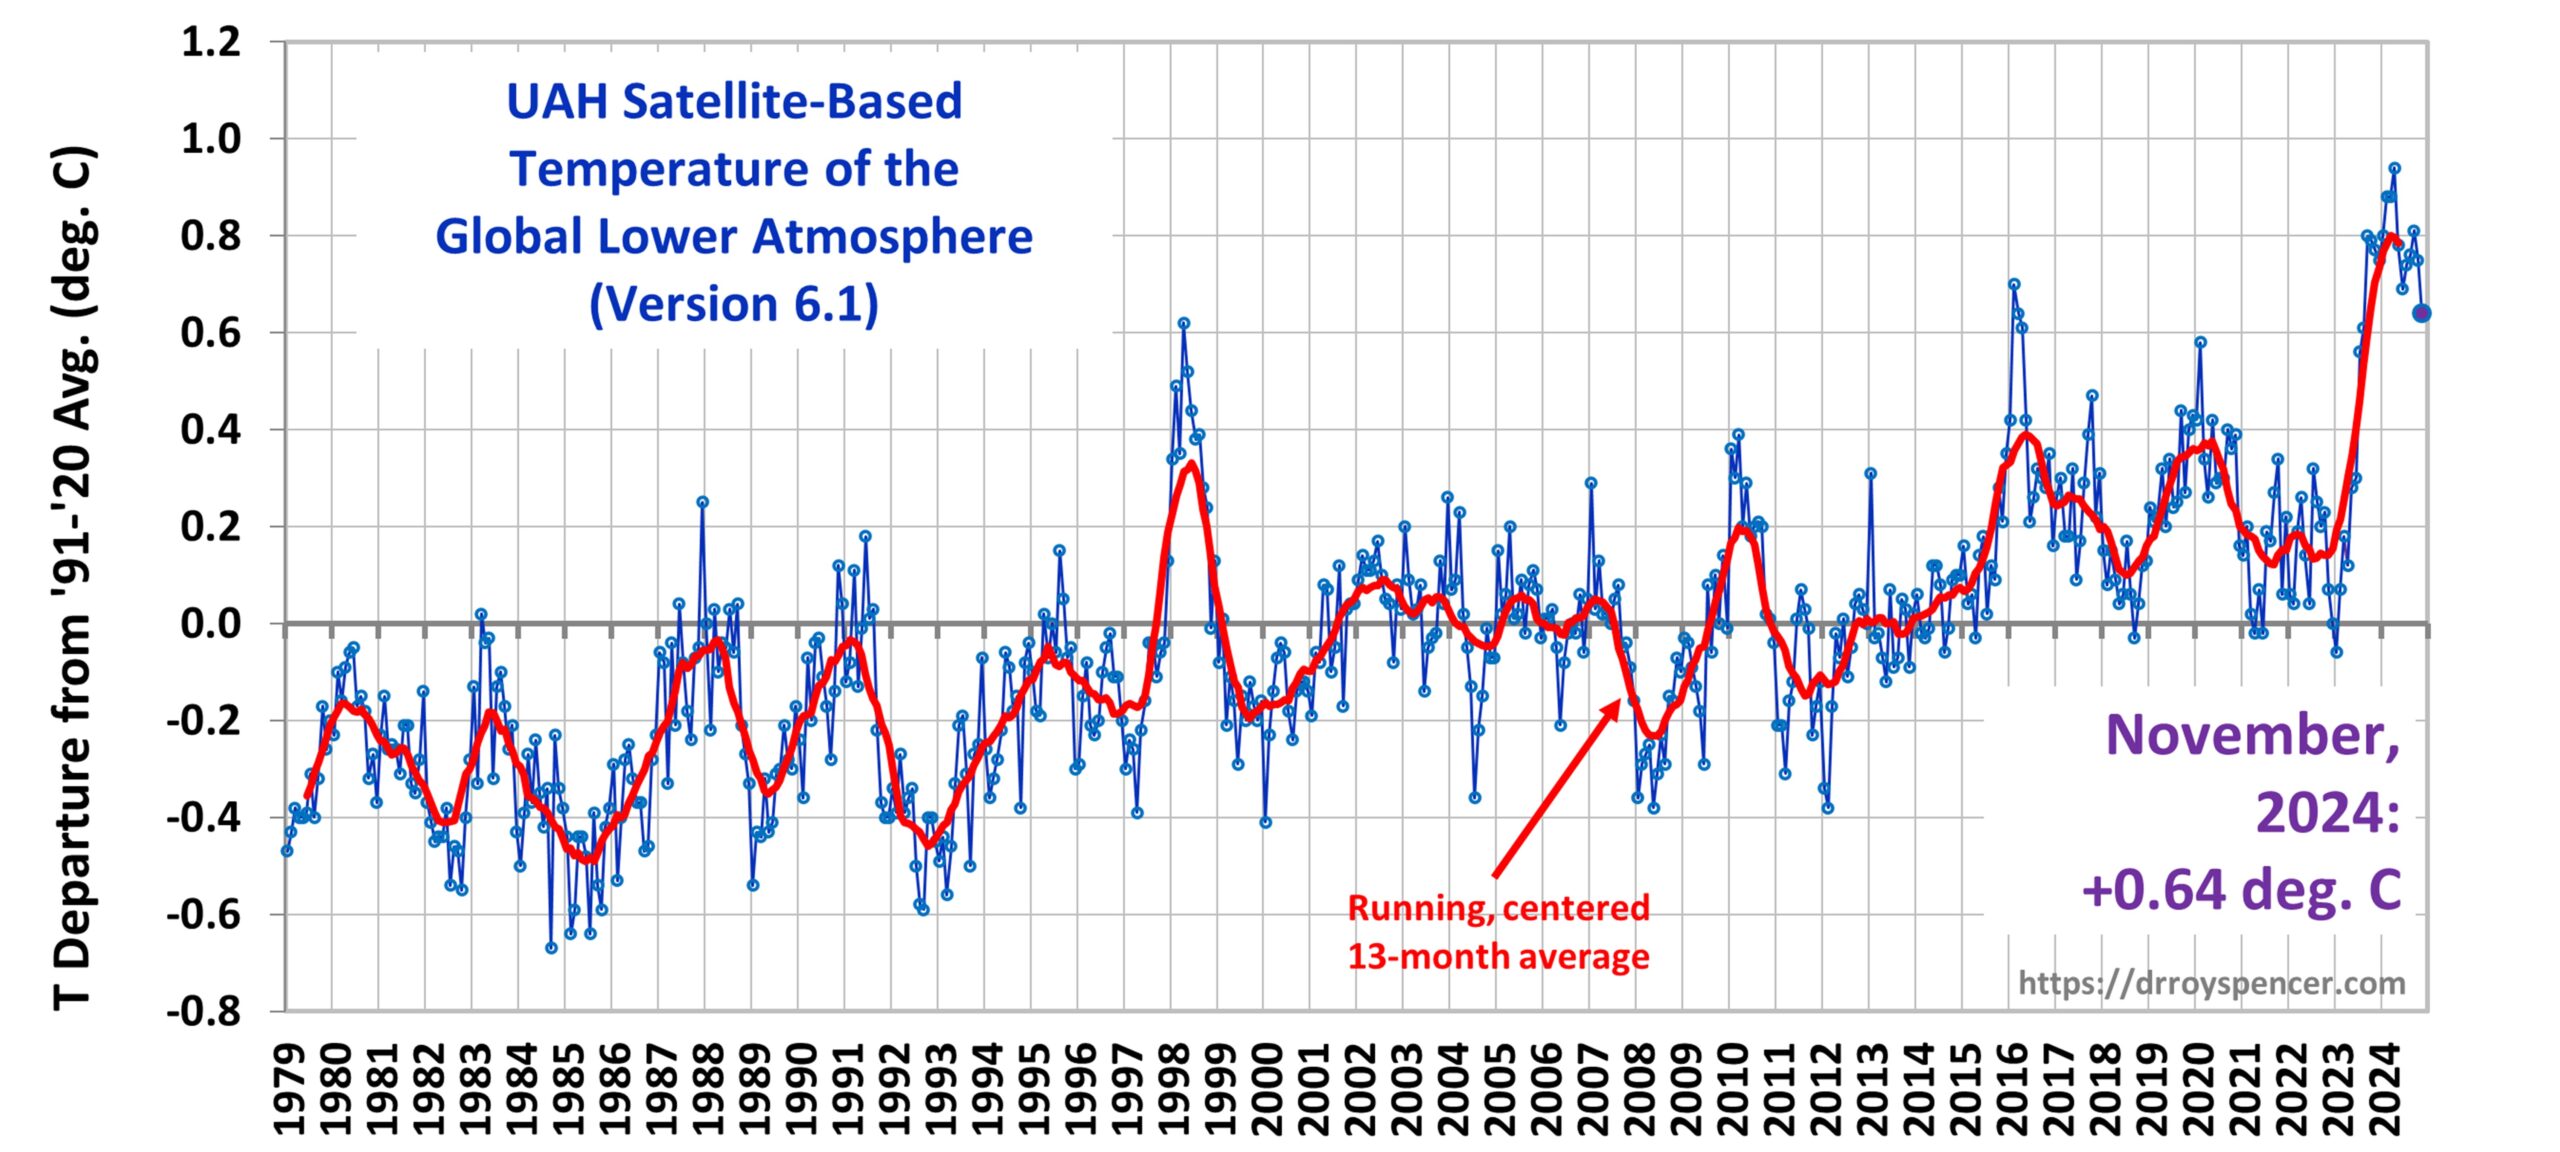
The Version 6.1 global average lower tropospheric temperature (LT) anomaly for November, 2024 was +0.64 deg. C departure from the 1991-2020 mean, down from the October, 2024 anomaly of +0.75 deg. C.

The Version 6.1 global area-averaged temperature trend (January 1979 through November 2024) remains at +0.15 deg/ C/decade (+0.21 C/decade over land, +0.13 C/decade over oceans).

The following table lists various regional Version 6.1 LT departures from the 30-year (1991-2020) average for the last 23 months (record highs are in red). Note the tropics have cooled by 0.72 deg. C in the last 8 months, consistent with the onset of La Nina conditions.

YEAR MO GLOBE NHEM. SHEM. TROPIC USA48 ARCTIC AUST
2023 Jan -0.06 +0.07 -0.19 -0.41 +0.14 -0.10 -0.45
2023 Feb +0.07 +0.13 +0.01 -0.13 +0.64 -0.26 +0.11
2023 Mar +0.18 +0.22 +0.14 -0.17 -1.36 +0.15 +0.58
2023 Apr +0.12 +0.04 +0.20 -0.09 -0.40 +0.47 +0.41
2023 May +0.28 +0.16 +0.41 +0.32 +0.37 +0.52 +0.10
2023 June +0.30 +0.33 +0.28 +0.51 -0.55 +0.29 +0.20
2023 July +0.56 +0.59 +0.54 +0.83 +0.28 +0.79 +1.42
2023 Aug +0.61 +0.77 +0.45 +0.78 +0.71 +1.49 +1.30
2023 Sep +0.80 +0.84 +0.76 +0.82 +0.25 +1.11 +1.17
2023 Oct +0.79 +0.85 +0.72 +0.85 +0.83 +0.81 +0.57
2023 Nov +0.77 +0.87 +0.67 +0.87 +0.50 +1.08 +0.29
2023 Dec +0.75 +0.92 +0.57 +1.01 +1.22 +0.31 +0.70
2024 Jan +0.80 +1.02 +0.58 +1.20 -0.19 +0.40 +1.12
2024 Feb +0.88 +0.95 +0.81 +1.17 +1.31 +0.86 +1.16
2024 Mar +0.88 +0.96 +0.80 +1.26 +0.22 +1.05 +1.34
2024 Apr +0.94 +1.12 +0.77 +1.15 +0.86 +0.88 +0.54
2024 May +0.78 +0.77 +0.78 +1.20 +0.05 +0.22 +0.53
2024 June +0.69 +0.78 +0.60 +0.85 +1.37 +0.64 +0.91
2024 July +0.74 +0.86 +0.62 +0.97 +0.44 +0.56 -0.06
2024 Aug +0.76 +0.82 +0.70 +0.75 +0.41 +0.88 +1.75
2024 Sep +0.81 +1.04 +0.58 +0.82 +1.32 +1.48 +0.98
2024 Oct +0.75 +0.89 +0.61 +0.64 +1.90 +0.81 +1.09
2024 Nov +0.64 +0.88 +0.41 +0.54 +1.12 +0.79 +1.00

The full UAH Global Temperature Report, along with the LT global gridpoint anomaly image for November, 2024, and a more detailed analysis by John Christy, should be available within the next several days here.

The monthly anomalies for various regions for the four deep layers we monitor from satellites will be available in the next several days at the following locations:

Lower Troposphere

Mid-Troposphere

Tropopause

Lower Stratosphere

via Watts Up With That?

https://ift.tt/4ANhTHq

December 3, 2024 at 08:05AM

The 2025 Josh Calendar is Now Available

UPDATE: There’s a 30% discount available for the print version form Lulu but the coupon expires at midnight tonight, December 3rd, most likely UK time.

Coupon Code: HOLIDAY30

Hello All,

I am doing the calendar slightly differently this year.

In the last few months my brilliant local printer has closed and any printing I oversee will be done by the head office which is miles away. This has meant some additional costs and issues with delivery. So I have decided to produce a smaller number of calendars for my much appreciated Donors (all who donate £60 per year get a free calendar – see here)

For all those who are unable to donate that amount there is an alternative. You can buy a copy printed by Lulu here. It is a slightly different size and format (US Letter) but I am hoping it will be ok – I have no control over the printing or delivery but it should be a good way of making the calendar available globally.

All the best

Josh 

Web: cartoonsbyjosh.com

X: @cartoonsbyjosh

via Watts Up With That?

https://ift.tt/pyrtROv

December 3, 2024 at 05:19AM

30 Years Ago Today: The great Tony Snow covers Milloy’s breakout report on EPA’s abuse of science

You can read the report here. Below is the summary of key EPA science policy.

via JunkScience.com

https://ift.tt/8vKI5br

December 3, 2024 at 05:07AM

UAH v6.1 Global Temperature Update for November, 2024: +0.64 deg. C

Metop-C Satellite Added to Our Processing

With this update, we have added Metop-C to our processing, so along with Metop-B we are back to having two satellites in the processing stream. The Metop-C data record begins in July of 2019. Like Metop-B, Metop-C was designed to use fuel to maintain its orbital altitude and inclination, so (until fuel reserves are depleted) there is no diurnal drift adjustment needed. Metop-B is beginning to show some drift in the last year or so, but it’s too little at this point to worry about any diurnal drift correction.

The Version 6.1 global average lower tropospheric temperature (LT) anomaly for November, 2024 was +0.64 deg. C departure from the 1991-2020 mean, down from the October, 2024 anomaly of +0.75 deg. C.

The Version 6.1 global area-averaged temperature trend (January 1979 through November 2024) remains at +0.15 deg/ C/decade (+0.21 C/decade over land, +0.13 C/decade over oceans).

The following table lists various regional Version 6.1 LT departures from the 30-year (1991-2020) average for the last 23 months (record highs are in red). Note the tropics have cooled by 0.72 deg. C in the last 8 months, consistent with the onset of La Nina conditions.

YEAR MO GLOBE NHEM. SHEM. TROPIC USA48 ARCTIC AUST
2023 Jan -0.06 +0.07 -0.19 -0.41 +0.14 -0.10 -0.45
2023 Feb +0.07 +0.13 +0.01 -0.13 +0.64 -0.26 +0.11
2023 Mar +0.18 +0.22 +0.14 -0.17 -1.36 +0.15 +0.58
2023 Apr +0.12 +0.04 +0.20 -0.09 -0.40 +0.47 +0.41
2023 May +0.28 +0.16 +0.41 +0.32 +0.37 +0.52 +0.10
2023 June +0.30 +0.33 +0.28 +0.51 -0.55 +0.29 +0.20
2023 July +0.56 +0.59 +0.54 +0.83 +0.28 +0.79 +1.42
2023 Aug +0.61 +0.77 +0.45 +0.78 +0.71 +1.49 +1.30
2023 Sep +0.80 +0.84 +0.76 +0.82 +0.25 +1.11 +1.17
2023 Oct +0.79 +0.85 +0.72 +0.85 +0.83 +0.81 +0.57
2023 Nov +0.77 +0.87 +0.67 +0.87 +0.50 +1.08 +0.29
2023 Dec +0.75 +0.92 +0.57 +1.01 +1.22 +0.31 +0.70
2024 Jan +0.80 +1.02 +0.58 +1.20 -0.19 +0.40 +1.12
2024 Feb +0.88 +0.95 +0.81 +1.17 +1.31 +0.86 +1.16
2024 Mar +0.88 +0.96 +0.80 +1.26 +0.22 +1.05 +1.34
2024 Apr +0.94 +1.12 +0.77 +1.15 +0.86 +0.88 +0.54
2024 May +0.78 +0.77 +0.78 +1.20 +0.05 +0.22 +0.53
2024 June +0.69 +0.78 +0.60 +0.85 +1.37 +0.64 +0.91
2024 July +0.74 +0.86 +0.62 +0.97 +0.44 +0.56 -0.06
2024 Aug +0.76 +0.82 +0.70 +0.75 +0.41 +0.88 +1.75
2024 Sep +0.81 +1.04 +0.58 +0.82 +1.32 +1.48 +0.98
2024 Oct +0.75 +0.89 +0.61 +0.64 +1.90 +0.81 +1.09
2024 Nov +0.64 +0.88 +0.41 +0.54 +1.12 +0.79 +1.00

The full UAH Global Temperature Report, along with the LT global gridpoint anomaly image for November, 2024, and a more detailed analysis by John Christy, should be available within the next several days here.

The monthly anomalies for various regions for the four deep layers we monitor from satellites will be available in the next several days at the following locations:

Lower Troposphere

Mid-Troposphere

Tropopause

Lower Stratosphere

via Roy Spencer, PhD.

https://ift.tt/iwMCf0W

December 3, 2024 at 04:46AM