Why They Lie About Nuclear Power

Cliff Reece reports on the reasons for anti-nuclear distortions in his Spectator Australia article  Australia is already a successful nuclear nation.  Excerpts in italics with my bolds and added images. H/T John Ray

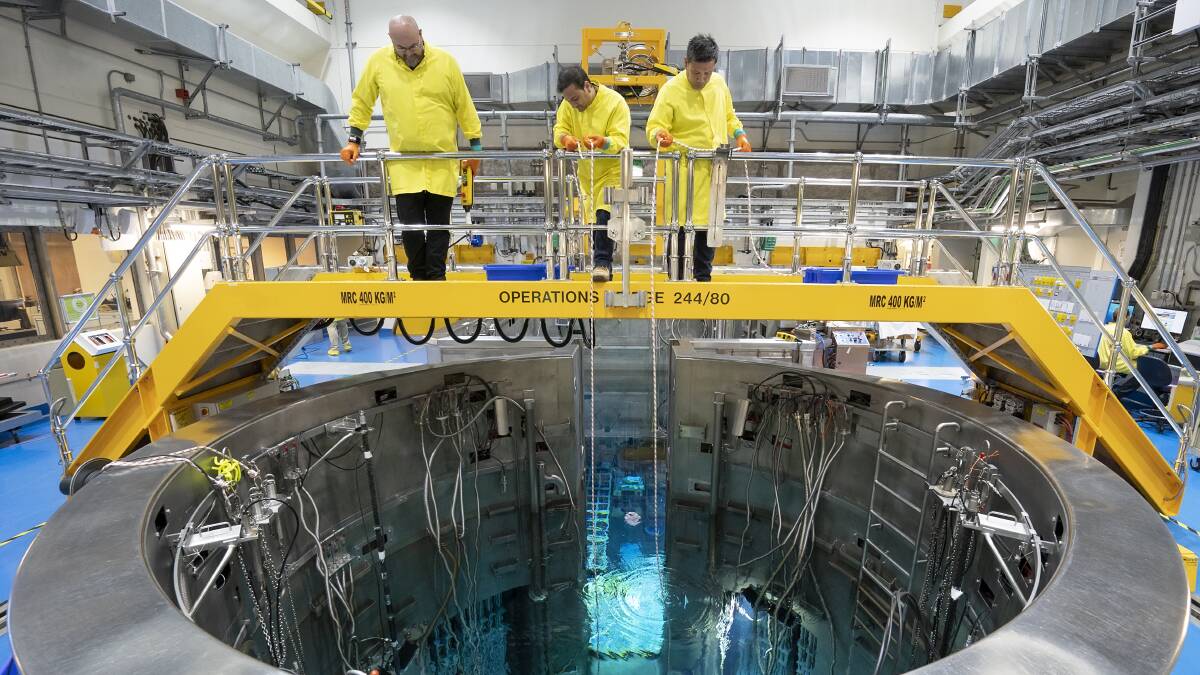
ANSTO – the Australian Nuclear Science and Technology Organisation – recently celebrated 70 years since Australia’s nuclear age began in Sydney.  ANSTO is the home of Australia’s most significant landmark and national infrastructure for research. Thousands of scientists from industry and academia benefit from gaining access to state-of-the-art instruments every year.

Thousands of visitors, including many schoolchildren, have safely toured the site at Lucas Heights, which is located 40km southwest of the Sydney CBD. They had the opportunity to learn a great deal about nuclear science as a result of that experience.

I recently became one of those visitors when I was invited to a 3-hour escorted tour of their facilities. As former Executive Director of the National Safety Council of Australia (NSW/ACT) I was particularly interested in their WHS procedures as well as the management of waste, as the latter could impact on the wider community if poorly managed.

What impressed me most was seeing just how advanced we are as a nuclear nation. Despite being relatively small in scale compared to a full civil nuclear energy plant, it has much the same range of issues and complexities to deal with. And it certainly appears to successfully do so at both their Sydney and Melbourne campuses.

The obvious question is, why is the Albanese Labor-Greens government, together with the Teals, opposed to extending our obvious expertise into producing nuclear energy on a commercial scale, as proposed by Opposition Leader Peter Dutton’s LNP?
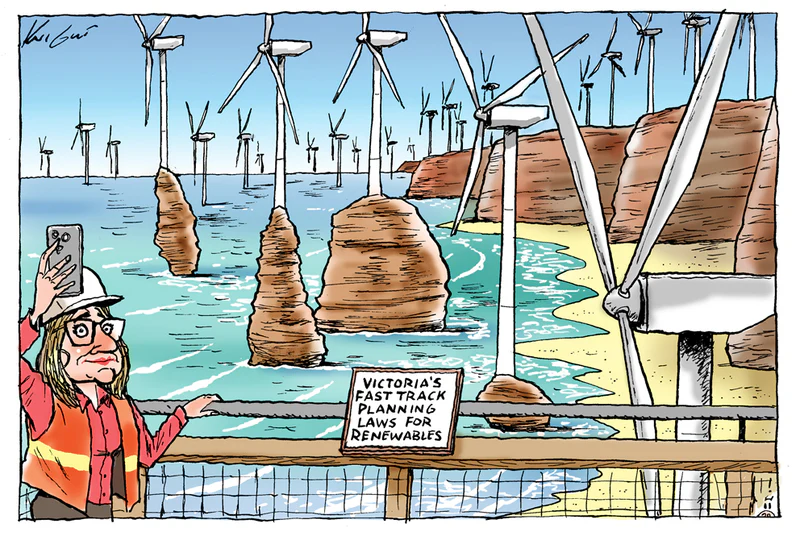
As you’d expect, there are a number of reasons for both their reluctance to accept nuclear despite it being cheap, reliable and emissions-free and their manic obsession with unreliable, hugely expensive, and environmentally/socially disastrous wind, solar, and battery renewables.

Political factors play a major part. The Greens and Teals are
directly opposed to nuclear, but for different reasons.

The Greens have shown beyond doubt that they want to disrupt society across as many issues as possible. They are doing this on a regular basis – even appearing to stand with crowds that hold sympathies toward recognised terrorist groups.

People who think the Greens are still a well-meaning environmental group like they were under Bob Brown are fooling themselves – they are not!

In the case of the Teals, they started life as political entities via funding from Climate 200, whose primary financial supporters are deeply entrenched in the lucrative and heavily taxpayer-subsidised renewables industry.  The Teals are ignorant pawns in the high-stakes game of climate change and the hysterical pursuit of ‘saving the planet’.

There is a lot of money involved in this issue and ordinary Australians are being played by the so-called elites, including left-wing mainstream media such as the ABC.

A good example is the almost total lack of media reporting on the very recent and hugely important US Department of Energy’s Nuclear Lift-off Report that includes significant findings:

The system cost of electricity with nuclear and renewables combination is 30 per cent lower than just renewables.

The jobs from nuclear are 50 per cent higher paying than solar or wind.

⁠⁠Nuclear provides the lowest emissions, is the most reliable form of energy production, has the lowest land use requirement, and lowest material usage.

The report also outlines a pathway for the USA to reach their ambition to triple their nuclear energy capacity by 2050, in direct contradiction of our government’s refusal to even legalise nuclear energy.

It also directly contradicts the policy position of the Albanese government.  The report debunks repeated claims that nuclear is ‘too expensive’ and will ‘increase power bills’ and outlines various other benefits of nuclear energy.

The DoE report could not disagree more with Australian anti-nuclear campaigners and the Albanese Labor-Greens government, Teals, and other sources of ignorance.

Their report also completely debunks the much-criticised report produced by CSIRO GenCost that our Minister for Climate Change and Energy, Chris Bowen, refers to constantly as his renewables crusade ‘Bible’.   This is despite the fact that the CSIRO GenCost report totally failed to accurately estimate the likely total cost of renewables compared to nuclear.

It also used in its modelling a 30-year life for a nuclear plant instead of the far more accurate 80 years. This created a false financial outcome by not comparing the total cost of nuclear with renewables over an 80-year period.

It also totally neglected the fact that waste management costs for renewables will be many times greater than for nuclear. There will be the need to replace wind turbines and solar panels three or four times during an 80-year period.  And who is going to be responsible for dismantling and disposing of the millions of components – some of which have toxic ingredients?

Many people, including some of our top scientists and engineers, believe that the CSIRO GenCost report was simply designed to support the Albanese government’s narrative as depicted in their childish three-eyed fish media splash some months ago.

‘Reckless’: Labor’s nuclear memes ‘undermine AUKUS subs deal’ Labor MPs have been accused of undermining the AUKUS submarine deal with ‘reckless’ anti-nuclear propaganda, as the Coalition calls on Anthony Albanese to rule out a scare campaign. Source: The Courier Mail

We need a government that protects our borders, controls immigration, decreases our cost-of-living, and helps young people to buy their own homes.  It’s becoming clearer on a daily basis that none of that will happen under the current Labor-Greens government.

One major impediment to reducing living expenses is the rising cost of energy.  Renewables alone will continue to increase the cost of electricity and that will in turn increase the prices paid at our shops and for commercial or residential electricity usage.

Nuclear energy will add to the range of resources available to us – as it has done in many other countries. Nuclear power plants operate in 32 countries and generate about a tenth of the world’s electricity. Most are in Europe, North America, and East Asia. The United States is the largest producer of nuclear power, while France has the largest share of electricity generated by nuclear power, at about 70 per cent.

The only way we are going to catch up with the rest of the world in relation to nuclear energy production is to replace our current government with Peter Dutton’s Liberal-National Coalition.  That might be hard to accept for some people – but it’s an undeniable fact.


via Science Matters

https://ift.tt/Vr6Yl4N

October 24, 2024 at 09:27AM

Chris Martz Asks Climate Fundamentalists Ten Fundamental Questions

https://twitter.com/ChrisMartzWX/status/1848359716180869290

Let’s do this again. . .

Here are 10 fundamental questions that climate pant-soilers never answer.

➊ You claim that the Earth is overheating. That it’s “too hot.” So, what is the correct global mean surface temperature (GMST) for life on Earth and why? 🌡️

Please provide a numerical answer. Use units and round it to the nearest tenth of a degree Celsius. Then, explain why that value is ideal and cite evidence to justify your answer.

➋ What is the correct atmospheric CO₂ level for life on Earth?

What is best to optimize our agricultural productivity? 🌽

What CO₂ level will make da weatha less scary? 🌪️

Give your answer as an exact value as a mole fraction or volume percentage, and then explain why that value is ideal.

➌ What exactly makes CO₂ “pollution”?

The EPA considers CO₂ to be a pollutant, legally speaking, under the Clean Air Act, and their scientific justification is simply that, it “…𝑐𝑜𝑛𝑡𝑟𝑖𝑏𝑢𝑡𝑒𝑠 𝑡𝑜 𝑔𝑟𝑒𝑒𝑛ℎ𝑜𝑢𝑠𝑒 𝑔𝑎𝑠 𝑝𝑜𝑙𝑙𝑢𝑡𝑖𝑜𝑛 𝑡ℎ𝑎𝑡 𝑡ℎ𝑟𝑒𝑎𝑡𝑒𝑛𝑠 𝑝𝑢𝑏𝑙𝑖𝑐 ℎ𝑒𝑎𝑙𝑡ℎ 𝑎𝑛𝑑 𝑤𝑒𝑙𝑓𝑎𝑟𝑒.”

🔗https://epa.gov/climate-change/endangerment-and-cause-or-contribute-findings-greenhouse-gases-under-section-202a

That’s pretty ambiguous.

Because by that measure, water vapor should also be classified as a “pollutant” because it’s also a “greenhouse gas” (GHG) — it’s also the most abundant and potent GHG; it absorbs a wider spectrum of IR wavelengths than CO₂. 🌈

So, what actually makes CO₂ pollution?

➍ Why are temperature departures from 1850-1900 climate conditions deemed as the human welfare control knob given that the overall human condition has never been better than it is today? How is was climate during the end of the Little Ice Age — the coldest period in the last 10,000-years — preferable to today’s? On what account was the weather more benign? By what measure? Be specific. Tell me how the climate was supposedly less dangerous in the 17-19th centuries.

➎ The Inflation Reduction Act (IRA) that President Biden signed into law in 2022 was popularized as the “biggest climate bill in history,” but ever since the bill was signed, climate alarmists insist climate change has only gotten worse.

Why are we not seeing the bill work its magic? 🎩 🪄

🔗https://axios.com/2024/07/21/biden-legacy-election-2024

➏ If we spend $75 trillion to decarbonize the economy by 2050, by how much will it reduce the GMST by the end of the century? Please provide your answer to the nearest tenth of a degree Celsius and show your calculations.

What does the perfect climate look like? How will we know when we get there? By what measure?

➐ The estimated cost of net zero by the year 2050 in the U.S. is $75 trillion ($3 trillion per year), according to Treasury Secretary Janet Yellen. 💰

🔗https://politico.com/news/2024/07/27/yellen-amazon-climate-change-00171522

That’s a hefty price tag. 🏷️

And with ~260 million adult taxpayers, it would cost each of us $288,461.54 to get to “net zero emissions” by the target date. That’s 3-6-years’ worth of peoples’ salaries.

Are you willing to shell out that money, or do you just expect that everyone else will foot the bill for you? 🤔

Secondly, if you don’t know the answer to question six, then are we supposed to just spend that $75 trillion and see what happens? 🤨

➑ If “combating climate change” is a global concerted effort, why do China and India get a free pass to continue emitting carbon dioxide without bound?

➒ Why are you so vehemently opposed to the deployment of nuclear power? It is the safest, most sustainable “carbon-free” energy technology and without the compliance regulations, isn’t expensive when compared to solar PV and wind, which are inefficient, intermittent, costly add-ons to existing electricity generation sources.

➓ If humans are a parasite to the Earth since we are destroying it, why then are you worried that climate change could wipe us all out? Wouldn’t that be better for Earth? Why don’t you be the change you want to see and “net zero” yourself?

I guarantee not one person will give me a coherent point-by-point answer.

via Watts Up With That?

https://ift.tt/ZWIrT4o

October 24, 2024 at 08:01AM

New Study: The Southeastern United States Has Been Cooling For The Last 120 Years

Scientists highlight yet another region that anthropogenic CO2 emissions have failed to do their “global warming” thing.

Reconstructed and observed temperature trends reveal 120 years (1901-2022) of cooling across the southeastern US (King et al., 2024).
Image Source: King et al., 2024
Over 100 years (1901-2015) of net cooling is also evident across the entire US according to 1,407 long-term temperature stations (Partridge et al., 2018).
Image Source: Partridge et al., 2018
 

via NoTricksZone

https://ift.tt/mKeLtNZ

October 24, 2024 at 07:31AM

KEW Gardens DCNN 5260 – Open to question. (plus further notes on St James Park London.)

Above image from Google Earth Pro dated 5/7/2018

Above image from 6 years later in July 2024.

Spot the difference?

{51.48196 -0.29433 Met Office CIMO Assessment varies over time + “Excellent” Records from 1/1/1910}

Firstly, the Kew Gardens site from 1910 to date should not be confused with a separate site named just “Kew” and located at the site variously known as “Kew Observatory” or the “King’s Observatory” which existed from 1/1/1857 to 31/12/1980.

If you have spotted any significant difference between the two above site images, please let me know in the comments below. For my part, I cannot immediately see any change either in the site or its immediate surroundings. However, evidence supplied under Freedom of Information request from the Met Office, clearly shows that they have considered there have been highly significant recent changes.

In 2021 the Met Office assessed the site as CIMO Class 4 with an error margin due to siting of 2°C. (note another “flagship site” at RHS Wisley was deemed similarly inaccurate)

The 2022 Classification was the same lowly ranked status.

But, in just the same way as the Edenbridge (Bough Beech) site was alleged to have seen a significant (but incorrectly adjudged) improvement, the Kew site suddenly achieved Class 2 status in 2023. RHS Wisley retained its previous poor status.

So what is the real status of Kew, why the sudden upgrade and is any of this really relevant?

Well regarding the latter question, it clearly seems to be crucially relevant to the Met Office and its close associates. ” Why is Heathrow so hot?“

“Prof Williams explains……….(Heathrow) airport is based in London, which is also very built-up, and so the urban heat island also affects surrounding areas.If you compare Heathrow to nearby Kew – which is eight miles away – there is hardly any temperature difference between the two.”

{N.B. the straight line distance is actually 6.4 miles from screen to screen)

This statement made in 2022 equates Heathrow data (bizarrely classed as CIMO Class 3 – to be reviewed soon ) to being accurate because it agrees with another site (then rated as CIMO Class 4) and even closer to one of the world’s openly acknowledged most intense Urban Heat Island. It is often said that whilst “great minds think alike” it could be better argued that validating Heathrow by using Class 4 Kew (and also Class 5 Northolt on other occasions) is more akin to “fools seldom differ”. It would appear the uprating of Kew could possibly be motivated by non-meteorological pressures.

A reminder of CIMO Class 2.

Superficially it might look as if Kew should be Class 2 until viewed with regard to shading and the changing uses of the immediate vicinity not dissimilar to Oxford.

The large trees surrounding the screen naturally create extensive early morning and late evening shade. And then there are significant (to say the least) “seasonal structures” regularly deployed in the immediate vicinity as the above “helter-skelter” demonstrates. Again this may be a “flagship” site but the Met Office do not seem able to restrict activity in the immediate vicinity highly likely to affect readings. This exposure to occasional extraneous events, however, rarely seems to concern the Met Office who often proclaim “records” at sites otherwise known to be affected by public events. The 1990 Cheltenham “record” taken during an event held in Montpelier Park is one such example and the subject of a future post.

Adding in the obvious and fully acknowledged urban heat island effect, being directly under a major flight landing path, with extensive surrounding areas under very large glass structures and with various fairs and events held on this area it is difficult to justify Class 2. The original Class 4 assessment seems much more appropriate.

*****A Footnote regarding St James’ Park*********

I recently reviewed the St James’ Park London site

The Met Office have since replied to my inquiry regarding their “UNSATISFACTORY” rating of the site and what actions they were taking to remedy the situation. This is their response

“Dear Mr Sanders, thank you for your enquiry.

With regard to the observation site at St James Park, London, vandalism was reported by the park staff in March 2024, and a formal inspection was therefore made on 28th March 2024. The inspector reported the Screen had been damaged as a result of vandalism and the site was graded Unsatisfactory pending repair.

The screen was replaced on 4th April 2024 by a member of our field engineering staff and the screen can be considered Satisfactory since this repair date. However, the grade on our database will get an update when the site is next formally inspected in 2025.

Kind regards,

Weather Desk”

In my review I commented on the screen being insecure and prone to “rascality”. It is very unfortunate that such vandalism occurs but in this case with such minimal (almost non-existent) security and in such a public place it is sadly almost inevitable that these things will occur. I would suggest Kew may be equally susceptible.

via Tallbloke’s Talkshop

https://ift.tt/C7UzT49

October 24, 2024 at 05:41AM