Trends In Atlantic Cat 5 Huricanes

By Paul Homewood

.

 Graphic showing the increasing number of category three, four and five hurricanes in the North Atlantic

https://www.bbc.co.uk/news/world-us-canada-42251921

.

You will recall this graph from the latest piece of BBC disinformation about hurricanes. As I wrote the other day:

“The apparent increase in major Atlantic hurricanes since 1920 is due to the fact that we now have satellites to observe them in mid-ocean. This is why there is a step change in the 1990s.”


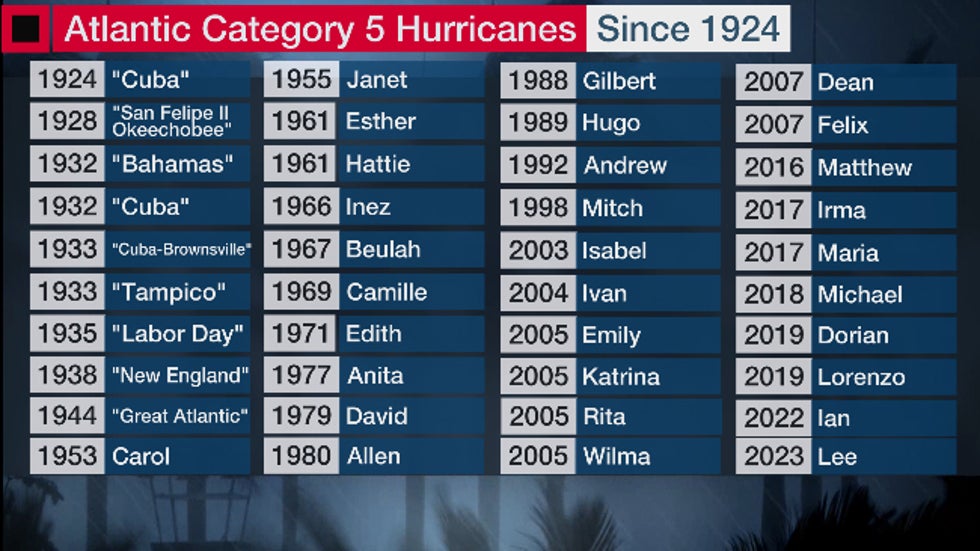
This is the full list:
 

https://s.w-x.co/util/image/w/cat5-1924-2023-list.jpg?v=ap&w=980&h=551

.

BBC customers would see that graph and naturally assume that hurricanes are getting stronger, (despite that weaselly qualification at the bottom). But prior to satellites and robust hurricane hunter aircraft, most Cat 5 hurricanes could only be identified as such at or close to landfall. And if we only plot these storms, we get a completely different picture:

image

https://en.wikipedia.org/wiki/List_of_Category_5_Atlantic_hurricanes

If anything, Cat 5 hurricanes were much more frequent at times in the past – notably the 1930s.

Since Dean and Felix in 2007, the only year with two Cat 5s, there have been just three – Irma, Michael and Dorian, in 2017, 2018 and 2019 respectively. Put another way, there have been just three in the past seventeen years.

This completely destroys the BBC’s deliberately misleading chart.

Andrew Hagen and Chris Landsea are two of the leading hurricane researchers in the US. Back in 2012, they published this paper, which looked at the issues surrounding the impact of changes in how we monitor hurricanes:

image

ABSTRACT
An investigation is conducted to determine how improvements in observing capabilities and technology may
have affected scientists’ ability to detect and monitor Saffir–Simpson Hurricane Wind Scale Category 5 hurricanes
in the Atlantic Ocean basin during the mid-twentieth century. Previous studies state that there has been an increase
in the number of intense hurricanes and attribute this increase to anthropogenic global warming. Other studies
claim that the apparent increased hurricane activity is an artifact of better observational capabilities and improved
technology for detecting these intense hurricanes. The present study focuses on the 10 most recent Category 5
hurricanes recorded in the Atlantic, from Hurricane Andrew (1992) through Hurricane Felix (2007). These 10
hurricanes are placed into the context of the technology available in the period of 1944–53, the first decade of
aircraft reconnaissance. A methodology is created to determine how many of these 10 recent Category 5 hurricanes
likely would have been recorded as Category 5 if they had occurred during this period using only the observations
that likely would have been available with existing technology and observational networks. Late-1940s and early-
1950s best-track intensities are determined for the entire lifetime of these 10 recent Category 5 hurricanes. It is
found that likely only 2 of these 10—both Category 5 landfalling hurricanes—would have been recorded as Cat-
egory 5 hurricanes if they had occurred during the late-1940s period. The results suggest that intensity estimates for
extreme tropical cyclones prior to the satellite era are unreliable for trend and variability analysis

https://journals.ametsoc.org/view/journals/clim/25/13/jcli-d-11-00420.1.xml?tab_body=pdf

Their map is particularly relevant – (RMW is Radius of Maximum Wind):

image

Apart from Andrew and Mitch, all hit Cat 5 speeds well away from land.

And they conclude that only those two of the ten hurricanes would have been classified as Cat 5s using 1940s technologies – Andrew, which hit Florida as Cat 5; and Mitch, which passed close to the north coast of Honduras.

Using 1950s methods, Felix would also have made Cat 5.

It is also worth noting that even though these three would have been called Cat 5s, the wind speeds estimated for 1940s technology were still less than officially recorded now. Mitch, for instance, is officially 15kts higher than the 1940s estimate.

image

Hagen & Landsea explain all of this very succinctly:

image

Note that Cat 4 hurricanes also have been understated in the past.

I have already complained to the BBC about their article, and in particular the graph. Will they ignore what the real hurricane scientists say?

I think we all know the answer to that!

via NOT A LOT OF PEOPLE KNOW THAT

https://ift.tt/UqcdHwu

October 23, 2024 at 12:14PM

Is Paleoclimate Cyclic? It’s a Mystery to Me

By Kirby Schlaht

Is paleoclimate cyclic?

Does the climate model below (Fig 6) represent a real climate cycle that actually repeats every 675 million years? If so, might the galactic spiral structure with its accompanying cosmic radiation be responsible? Is the spiral structure of the Milky Way “stable”, such that we will encounter the same spiral arms and inter-arm regions over and over as we orbit the gravitational center of the galaxy?

The Story of Climate Change is based on the concept of atmospheric ionization by high energy cosmic rays initiating aerosol and cloud formation. This results in a warming or cooling planet Earth. This cloud albedo effect (Svensmark) is the first leg upon which The Story of Climate Change rests (https://thestoryofclimatechange.substack.com). Galactic cosmic rays, mostly high energy protons, play the central role in this process by ionizing atmospheric gases as they descend into the lower troposphere. Radio observations of exo-galaxies indicate that cosmic rays are galactic plane polarized and are confined to spiral arm structures. This means that during our solar system’s transit through the Milky Way spiral arms the cosmic ray flux will be modulated. High flux levels during spiral arm crossings result in cloudy and cooling climates while lower flux during inter-arm space crossings results in less cloudy and warming climates. These we can call geologic Ice House and Hot House epochs. Our planetary system’s galactic orbit is circular but oscillates in and out of plane manifesting a secondary high frequency cosmic ray flux modulation. This results in a periodic 30-million-year warming-then-cooling cycle (Veizer, Shaviv). These superimposed drivers can be visualized in my 675-million-year climate cycle based on a one-billion-year splice of Veizer and Halverson isotope proxies (part 1, https://thestoryofclimatechange.substack.com/p/the-story-of-climate-change-part-0fd ).

What does this mean?

As our solar system continues to orbit the galactic center, we appear to encounter the same spiral arms and inter-arm regions again and again. If this process influences the climate, the cyclic nature of paleoclimate should be revealed. Assuming that the nearly 13-billion-year-old Milky Way galaxy structure has been stable in aggregate, at least since our system’s inception – about 5 billion years, we will continue to repeat the same pattern and periodicity of climatological conditions into the far future. The spiral arms of the Milky Way appear to us to be rotating but at a slightly different speed than other stars in the disk like our sun. From the solar perspective we appear to be at rest while the galactic structure moves past us and slowly recedes in our wake. It has been estimated that our system orbits the galactic center every 225 million years or so. Our story indicates that three of our galactic orbits will result in one complete spiral structure transit – every 675 million years.

How can this pattern of stars, dust, gas, and energy persist if the objects in the galaxy are moving along their unique orbital paths with their unique orbital periods? Is this “spiral” an illusion or does the phenomenon have a physical explanation? Why are the cosmic rays mostly in the spiral arm structures and absent from the inter-arm regions? Do the spiral arms actually exist discretely as rotating standing gravitational waves or are they a function of rotating density waves propagating through the galactic disk of stars ever renewing their inventory of arm stellar masses? It is a mystery to me and the second leg upon which The Story of Climate Change rests. We do however, live in a metaphorical world. We do many things and think many thoughts because we believe that a carbon dioxide climate driver narrative is true. We can play at that game too. Shall we proceed as if The Story of Climate Change were also true? Beautiful stories may not be wholly true but they can inspire us to venture beyond the mundane – now that’s when the real fun begins.

Let’s imagine …

Let’s imagine the near future, say, 10 to 20 thousand years hence. I think we might assume that humanity will still be the dominant species on the planet as it has been since our exodus from mother Africa about 70 thousand years ago. Shall we consider the future climate landscape if anthropogenic carbon dioxide forces the Earth into a new Hot House environment 5 to 10 degrees Celsius warmer than today? Would you imagine that our climate in 10 thousand years would resemble the Hot House Cretaceous Period of around 75 million years ago? The climate of the dinosaurs. Would we see no polar ice caps, sea levels 300 to 600 feet higher than today, CO2 levels as high as 2000 parts per million – 5 times higher than today, and forests on Antarctica? If we did enter a Hot House how long would it last? Would the Hot House end on its own – if so, why would the temperatures fall? The pattern and periodicity of real paleoclimate change however, do not seem to be well explained by weathering, subduction, and volcanic activity cycles throughout Earth’s geologic past

Of course we would not be forced into a new Hot House. Remember, a Hot House is manifested by inter-arm space crossing during our galactic orbit. Our planet will remain within the cold Sagittarius spiral arm for another 120 million years or so – driving cloudier and cooler climates. We will linger near in-plane within this arm for another 2 to 3 million years driving cloudy and cool climates. The Milankovitch planetary orbital cycles can then show their influence by driving the climate to oscillate between cold glacial expansion and warm inter-glacial periods. 

Where are we now? First, we are fully in-plane with the Milky Way and experiencing maximum cosmic radiation with maximum propensity for aerosol and cloud formation. We have been in the Pleistocene Ice Age for about 3 million years. We are in the middle of this most recent 20-thousand-year interglacial period. In 10 thousand years, a mere 300 generations, we will be at lowest planetary obliquity and sliding into the next 80-thousand-year period of glacial expansion. Just a few hundred years after glacial inception the higher latitudes would be uninhabitable with the massive expansion of sea ice onto the continents as glaciers. As the ice expands it makes the albedo of our planet more reflective – returning more sunlight back to space and cooling things off even more. This is ice albedo feedback in action. A runaway Ice albedo process is thought to explain the Snowball Earth scenario 640 million years ago during the Cryogenian period. In 600 generations, 20 thousand years from now, we will be in the cold depths of the expanding ice age. About 1 hundred thousand years the Milankovitch cycles will find a resonance when both obliquity and eccentricity move higher providing more insolation to the higher latitudes. This breaks the ice albedo feedback loop, reversing ice expansion and initiating the next warm interglacial period.

Over the next 3 million years, as the out-of-plane orbital motion of our planetary system reduces cosmic radiation, cloud cover will be reduced driving temperatures warmer. This Pleistocene Ice Age will finally dissipate, leaving behind these glacial-interglacial oscillations – for now. What goes up must come down. In about 15 million years we will reach maximum out-of-plane position with the accompanying warmest temperatures. Our star system once again proceeds back into the galactic plane cooling the planet. 30 million years from now, while crossing deeper into the Sagittarius spiral arm, we will once again be fully in-plane receiving the highest cosmic ray flux, resulting in more ionization, and maximum propensity for cooling cloudiness and glaciers returning. This will mark the entry into the next Ice Age. Since our climate is cyclic, the past climates will be repeated – with a replay of the Marinoan Ice Age of 640 million years ago.

The big wheel keeps on turning

In about 120 million years we will finally cross the Sagittarius spiral arm. We will exit this Ice House with its periodic glacial ages and enter the next Hot House inter-arm space on our way into the next spiral arm region – the Perseus arm. Round and round we go.

With this knowledge and climate foresight of a cooling, icier world what should we do? It is hard to imagine, but we could organize this super organism we call humanity and implement a plan for adapting to the coming cold snap. Albedo modification, space-based solar mirrors driving back the continental and sea ice termini, and CO2 emission expansion might not be powerful enough climate weapons to fight mother nature.  But, maybe by then, the climate alarmists would be warning us about the real problem. Humans are notoriously short sighted though – much like the proverbial frog in a slowly freezing pond – before we even realize it, the brutal physics of cold finally catches up with us.

via Watts Up With That?

https://ift.tt/0Iij9mX

October 23, 2024 at 12:06PM

Rural and coastal residents delay, block green energy projects

Environmentalists detest the ‘little guys’ who get in their way.

via CFACT

https://ift.tt/9o2Vxjn

October 23, 2024 at 11:12AM

Another Study Shows Low-Frequency Vibrations From Wind Turbines Can Harm Human Health

New research by Dr. Bellut-Staeck in the journal Medical Research and Its Applications suggests chronic infrasound exposure can lead to serious blood vessel problems. This underpins earlier literature that have reached the similar conclusions. 

But the government refuses to accept the results.

Wind turbines are known to disrupt wildlife and severely damage the surrounding biotope, And, despite being inaudible, it is known that low-frequency vibrations from wind turbines can be harmful to human health.

Hat-tip: Tichy’s Einblick here.

Humans can only perceive sound waves over a range of approximately between 20 and 20,000 Hertz. Sound waves below 20 Hz cannot be heard by humans and are called infrasound.

Natural infrasound emitted by nature is harmless but it is increasingly being understood that infra-sound generated by wind turbines pulsates and make people who are subjected to them over extended time periods sick.

Strong evidence of a hazard to health

The rotating blades of wind turbines cause air pressure changes, which in turn can cause pressure on the ears and chest and lead to health issues and even serious problems like arrhythmia and vision impairment, according to a German Medical Journal.

The study’s abstract states: “Noise-exposed citizens, who live near infrastructures such as biogas installations, heat pumps, block-type thermal power stations, and bigger industrial wind turbines (IWT’s), show worldwide mainly a symptomatology associated with microcirculatory disorder.”

In other words: Infrasound from wind turbines, or other industrial machinery, even though we can’t hear it, can disrupt the natural balance of chemicals in our blood vessels, which can lead to inflammation and problems like atherosclerosis.

So what is the German government going to do about this well-established health hazard? Don’t expect much.

Germany’s green Utopian vision is broadly based on wind power and so far the country has installed more than 30,000 turbines, many being sited near populated areas. The government isn’t about to admit it has completely goofed.

It’s a situation very similar to the COVID mRNA vaccine, which has long been exposed as a health hazard. Yet, the government insists they’re safe!

German government ignores obvious hazard

Tichy’s Einblick writes: “For its part, the Federal Environment Agency (UBA) continues to maintain that there is no scientific evidence of a possible harmful effect of infrasound from wind turbines. This argument from the chronically green-tinged authority is astonishing – because in the case of glyphosate and many other phenomena, the UBA did not need any ‘scientific proof’ of harmfulness. Suspicion was always enough to call for a ban.”

Donate – choose an amount

via NoTricksZone

https://ift.tt/MroCOhm

October 23, 2024 at 10:26AM