
The Harris Administration demonstrating how tyrannical government works. Elon Musk’s Big Business and Conflicts of Interest With the U.S. Government – The New York Times
via Real Climate Science
October 21, 2024 at 12:28PM
The Harris Administration demonstrating how tyrannical government works. Elon Musk’s Big Business and Conflicts of Interest With the U.S. Government – The New York Times
via Real Climate Science
October 21, 2024 at 12:28PM
By Dr. Lars Schernikau
More details in this short video and his book www.unpopular-truth.com/thevideo
1. What is gas, what is coal, and what do we use it for?
2. The current “switching” sentiment: coal, gas, and hydrogen.
4. Economic future for coal and gas.
Where would the world be today or tomorrow without gas or coal? Short answer: nowhere!
Coal and Gas make up 60% of global electricity and 50% of global primary energy. In China and India alone electricity from coal and gas account for about 65% and 75% respectively of the overall mix.
Most banks and government institutions support gas, but not coal as many scientific papers and most reports. They are modeling an economic pathway with “fewer emissions”, assuming that gas emits about half the “greenhouse gases” that coal does. Therefore, gas has been considered the “bridge towards the transition”.
Case in point of course, Germany. Germany’s energy policy towards so called “net-zero” relied on Russian gas to provide the “bridge” towards the desired “zero-emission future”. The Russian attack on the Ukraine put a forceful stop to that policy.
Liquified natural gas, LNG, reduces the dependence on pipelines and allows new suppliers and consumers to enter the market, making it seaborne. Southeast Asia and Europe, and so many more regions, started to take advantage of this new influx of “cleaner” fuel to power their thermal power plants
Then the year 2022 marked the big turning point. LNG prices skyrocketed, as Europe literally swept up the entire market and left close to “nothing” for developing nations. Heightened risks of grid failures in Bangladesh [1,2] and Pakistan [3] where just one of the many consequences.
Let’s have a look at Gas vs Coal. Is there a favorite? Can someone like me even answer such a question? Probably not completely unbiased, but let me try to give you a rundown anyway… to allow you to form an informed opinion about coal and gas.
Figure 1: 2023 wind and solar additions in India and China
Coal and gas use an established, relatively simple technology for power generation consisting of boilers, turbines, and generators. Looking at combustion for power generation only, the key advantages of gas include:
There are four key advantages of coal.
A CEO of a medium sized US utility that switched from coal to gas for economic reasons and under “ESG pressure”, recently summarized it as follows:
“Gas is great, but still… I used to have 4 months of energy supply in my backyard, today I wake up every morning praying that there is no problem with the gas pipeline, because I have millions of customers to serve every day. My energy security is far reduced”.
Let me reiterate that we need both gas and coal for our modern existence today and we will need it tomorrow. Personally, I am convinced that we need much more of both. The choice of coal or gas or both depends on each country’s specific geographical and geological situations, which makes it obvious why Saudi Arabia uses gas, India uses coal, and why the US uses both.
However, I sense that the biggest misunderstanding about both coal and gas is their importance as a raw material input (nothing to do with energy). There is hardly any product that we use that does not require either both or at least gas or coal as a chemical “raw material” input (your phone, clothes, your car, food, your house, computers, solar panels, on and on it goes).
For example, the importance of coal for solar panels is summarized in my recent article “Coal’s importance for solar panel manufacturing”.
Natural gas or methane – simplified – is a hydrocarbon (CH4), consisting of one atom of carbon and four atoms of hydrogen. It is an energy dense gas, denser than hydrogen alone, and that is because of carbon. Carbon literally is a chemical miracle worker when it comes to hydrogen. Combined with hydrogen, carbon forms highly versatile and energetic “hydrocarbon” gaseous, liquid, and solid fuels (Figure 2). Higher carbon ratios yield solids and lower ratios yield gases, all possible at typical ambient temperatures and pressures. There is no need for complex equipment or pressure chambers.
Natural gas is considered a “fossil fuel” that developed from ancient plants and animals, tens to hundreds of millions of years ago. It is believed that both oil and natural gas originated from the remains of ancient marine organisms. Natural gas is extracted from underground reserves, often in combination with oil before it is “conditioned” for transport to the final consumer. Such conditioning may be as simple as preparing and sending it through a pipeline or as difficult as “making” liquified natural gas or LNG, a very cold and pressurized liquid form of gas. A fun fact, at −160°C the liquid gas volume reduces by a factor of about 600.
As per latest available resource information the from German BGR 2024 [18] we have over 200 years of known gas remaining potential available at current production rates. Remaining potential is the sum of known reserves and resources. Of course, new resources are being discovered continuously and technological advances continue to increase “the remaining life of fossil fuels”.
What is gas used for? Here are 5 main applications:
Coal on the other hand is a solid, largely consisting of the element carbon, mined from either underground or surface mines around the world, resulting in almost 9 Bln tons p.a., making up almost 10% of all “raw materials” we mine or grow annually for human existence. Coal is also considered a “fossil fuel” that basically comes from very old trees and plants, pressurized under airtight conditions for tens to hundreds of millions of years.
Coal is one of the few raw materials that we mine that can be used as is, without further processing or cleaning. Regardless, a significant portion of coal is processed in so called “washeries” to reduce the ash (silica or sand) content to upgrade the coal and increase the carbon content.
The German BGR 2024 [19] global analysis states that we have over 2,000 years of known hard coal remaining potential available, and over 3,000 years of lignite coal, at current production rates. Remaining potential is the sum of known reserves and resources.
There are many types of coals, depending on how old the coal is and what the geological conditions of coalification were. On average, older coal is more valuable than younger coal, but it is not always true. Two main types of coal exist: (1) metallurgical coal including coking coal and anthracites, but there is more; and (2) coal that is used primarily for thermal applications, often referred to as thermal coal.
As such, the main uses for coal include the following:
All chemical and physical details on coal can be accessed via Kindle or in print at “Schernikau’s Coal Handbook”

Figure 2: Fuels in a Thermodynamic System C-H2-O2; Conversion of Carbohydrate to Coal, Methane and Liquid Hydrocarbons
Source: Wolf 2021, from our book www.unpopular-truth.com (downloadable image available there)
The percentage of gas in the global electricity mix has been increasing over the past two decades from about 20% in 2004 to 25% in 2023. During the same time, coal’s share of electricity reduced from 40% to just over 35%. While both coal and gas continued growing in absolute terms (Figure 3) and retained their combined share essentially unchanged, this “switch” from coal to gas was driven by two reasons:
Global Energy Monitor’s “Global Coal Plant Tracker” [17] – an anti-coal organization – noted that the number of countries with coal power under development (pre-construction and construction) has nearly halved from 75 in 2014 to 40 in 2024. China and India combined account for 86% of current development.
They also note that new coal-fired power station proposals continue to outpace cancellations. In the first half of 2024, over 60GW of coal capacity was newly proposed or revived, compared to the 34GW that was shelved or cancelled over the same period. China plans for 1.3 Bln annual tons of new coal mine capacity. So, coal is expanding! Despite this many governments and organizations predict peak coal by end of this decade… we shall see.
Gas is expanding even faster. Coal and gas have been “competing” for decades and gas is still favored by many governments. The gas industry, closely linked to the oil industry, is generally better funded for industrial policy and lobbying than coal. The gas industry has also specifically targeted coal in some of its advertising (Figure 4).
There appears to be two fundamental misunderstandings in the general media, among the population, and many political and industrial leaders, about coal and gas, namely:
The interesting point is that sometimes gas is favored because there is a belief that Hydrogen will be the sustainable solution to long-duration energy storage, and gas power plants and transmission infrastructure may be more easily converted to hydrogen power plants than what coal power plant would. “The Hydrogen future” and gas’ role is a 3rd significant misunderstanding well summarized in the book “The Hydrogen Illusion” by Prof Furfari [4]. The fundamental misunderstanding is around the belief that hydrogen is sustainable, safe, and cost effective.
Figure 3: Coal and gas growth as% of global electricity production
Source: Schernikau based on BP, Our World in Data, Global Electricity Review
One simple point I would like to make here is that since solar and wind cannot be zero CO2, neither can hydrogen derived from excess or unutilized wind and solar. The value chain of hydrogen for storage includes “making” H2, storing H2, transporting H2 and then repowering H2. In all these steps about 65-80% of the input energy gets lost and dissipates in the form of low value, high entropy heat into the atmosphere (Figure 5). Thus, the CO2 footprint of wind and solar, when using H2 for storage, would multiply by a factor of 3 or 4! In addition, hydrogen is highly explosive, permeates practically everything including steel, and is thus a dangerous product to handle.
Even if H2 was a viable solution, which it is not, the development of a so called “hydrogen economy” does not initially require H2-ready gas power plants. Because (1) such H2-ready gas plants cannot yet be connected to the non-existing hydrogen grid, and (2) hydrogen sprinter and hybrid power plants would be well suited as well, not requiring gas [7].
In addition, to safeguard the fluctuating feed-in of renewable energy sources, consideration must also be given to the continuation of alternative technological developments such as large-scale storage systems. Until these are available, coal-fired power plants can easily take, and sometimes already do take the place of H2-ready gas turbines in securing the fluctuating feed-in of renewable energy sources [8]. Also, ammonia could be co-fired in coal-fired power plants as an H2 carrier [based on IEA].
Fyi, China or India are not building gas-fired power stations but continue to build coal instead, I wonder why. It appears coal can very well be used as backup for solar?
Figure 3: Coal and gas growth as% of global electricity production
Source: Schernikau based on BP, Our World in Data, Global Electricity Review
Figure 4: Hydrogen’s “energy” inefficiency, Michael Sura
Figure 5: misguided advertising for gas, dismissing methane and natural CO2 uptake
Many discussions in the media and press have been about the lifecycle greenhouse gas emissions of gas, especially LNG. Not too long ago, The New Yorker [5] summarized it to the point “A new analysis suggests that LNG exports may well be worse for the environment than burning coal.” The peer-reviewed research referenced is from Howarth 2023 [6].
The well-established fact is that, assuming the IPCC is correct about methane’s global warming potential GWP, the relatively higher methane emissions throughout the life cycle of natural gas and LNG – from production and transportation to usage (including leaks), often offset, and in many cases exceed, the CO2 emissions advantage that gas has over coal. If one is worried about imminent human greenhouse gas induced catastrophic warming then CO2 doesn’t matter but CO2-equivalent (CO2eq) matters… over the next 20 years. This metric the IPCC measures with its 20-year Global Warming Potential GWP20.
For the record, I do not doubt that CO2 or CH4 (methane) are greenhouse gases. However, there remains scientific uncertainty and debate about the global warming potential and climate sensitivity of greenhouse gases. My detailed objection to IPCC’s GWP as well as the scientific debate and uncertainty on GWP cannot be detailed on this platform (see also [14]). For instance, Wijngaarden/Happer 2020 have analyzed GHG forcing in detail and conclude significantly lower climate sensitivities than those used by the IPCC.
In our own peer-reviewed research Schernikau/Smith 2022 “Climate Impacts’ of Fossil Fuels in Today’s Energy Systems” [7] we come to the same conclusion of gas not being “better for the climate” than coal, using data solely from the International Energy Agency (IEA in Paris) and the Intergovernmental Panel on Climate Change (IPCC in Geneva).
The main “novelty” is that we included the fact that only half the CO2 emissions from any source can contribute to warming of the planet. This is a fact that is confirmed by the IPCC, but forgotten by most, because more than half of CO2 is taken up by nature such as plant life and oceans, contributing to greening of the Earth. The global warming potential of CO2 is for molecules remaining in the atmosphere acting as “greenhouse gases”, not for those taken up by nature.
Another noteworthy study confirming that LNG is “not better for the climate” than coal was published by Prof Wodopia of Germany in 2023 [8]. He concluded “the net lifecycle greenhouse gas emissions of liquefied natural gas (LNG) from the USA or Qatar are compared with those of coal, taking sulphur dioxide emissions into account. When used in a simple-cycle gas turbine, they are higher than those of coal. In part-load operation, the results shift further in favor of coal.
Countless additional studies make similar points, here some more examples:
When “the science” is clear on this fact, then why does the EU support gas, but not coal? What am I missing? Why is the public being misled? Why do we continue to spend billions on replacing coal with imported LNG? Why are banks reluctant to fund coal, but not gas?
I repeat, we need more of both coal and gas, but isn’t it time to be honest with ourselves about its impact and consequences for economies and the environment?
Understanding more about gas and coal, their importance for our energy needs and daily products used, but also their environmental impact, helps us make smarter energy policy decisions. I see that it is undisputed that coal and gas are on par when it comes to “the climate”. My opinion on the fallacy of measuring everything with CO2 is published here “The Dilemma of pricing CO2“.
The future of coal and gas appears to look bright, because (1) the demand for carbon and hydrogen sourced from coal and gas cannot be easily replaced when it comes to the production of our day-to-day products, and (2) because alternative ways of producing grid-ready power are either significantly more expensive and/or have a much worse impact on the environment.
For more details on energy costs please refer to my article “The Energy Trilemma” from earlier this year.
The fact that we need to continue investing in our coal and gas supply chains, power plants, and material use infrastructure, appears to be obvious.
Consider this – assuming coal and gas have a 40% power plant efficiency on average, then a global 1% efficiency improvement results in 2.5% (1/40%) less raw material used and less environmental impact. Isn’t this worth the investment? Remember that coal and gas make up almost two thirds of the world’s power generation!
Investments especially for coal but also for gas are not keeping up with demand and this will logically lead to power shortages and inflated prices. That in turn will lead to energy poverty and less GDP growth. Has anyone counted the cost to humanity from such personal and economic losses? I fear not.
Original published at www.unpopular-truth.com/blog
[1] Reuters: Bangladesh’s Worst Electricity Crisis in a Decade, June 2023, sec. Asia Pacific. https://www.reuters.com/world/asia-pacific/bangladeshs-worst-electricity-crisis-decade-2023-06-07/.
[2] Reuters: Bangladesh Plunged into Darkness by National Grid Failure, October 2022, sec. Asia Pacific. https://www.reuters.com/world/asia-pacific/large-parts-bangladesh-without-power-after-national-grid-failure-daily-star-2022-10-04/.
[3] Reuters: Pakistan Suffers Big Power Outage after Second Grid Failure in Three Months, January 2023, sec. Asia Pacific. https://www.reuters.com/world/asia-pacific/pakistan-suffers-major-power-outage-after-grid-failure-2023-01-23/.
[4] Prof Furfari, book “The Hydrogen Illusion” 2022, https://www.amazon.com/hydrogen-illusion-Samuel-Furfari/dp/B08KHGDZNS
[5] New Yorker: On Methane – A Smoking Gun for Biden’s Big Climate Decision, November 2023. https://www.newyorker.com/news/daily-comment/a-smoking-gun-for-bidens-big-climate-decision
[6] Howarth 2023: The Greenhouse Gas Footprint of Liquefied Natural Gas (LNG) Exported from the United States,” October 2023,
[7] Schernikau and Smith 2022 ‘Climate Impacts’ of Fossil Fuels in Today’s Energy Systems’, SSRN Electronic Journal, March 2022. https://doi.org/10.2139/ssrn.3968359
[8] Wodopia 2024: Lifecycle Emissions From Gas and Coal Do Not Support a Coal-to-Gas Shift.” SSRN Scholarly Paper. Rochester, NY, January 2024. https://doi.org/10.2139/ssrn.4674204
[9] Rosselot et al 2021: Comparing Greenhouse Gas Impacts from Domestic Coal and Imported Natural Gas Electricity Generation in China.” ACS Sustainable Chemistry & Engineering 9, no. 26 (July 2021): 8759–69. https://doi.org/10.1021/acssuschemeng.1c01517
[10] Mar et al 2022: Beyond CO2 Equivalence: The Impacts of Methane on Climate, Ecosystems, and Health, Environmental Science & Policy 134 (April 2022): 127–36. https://doi.org/10.1016/j.envsci.2022.03.027.
[11] Kemfert et al 2022: The Expansion of Natural Gas Infrastructure Puts Energy Transitions at Risk, Nature Energy, July 2022, 1–6. https://doi.org/10.1038/s41560-022-01060-3
[12] Nature: Scientists Raise Alarm over ‘Dangerously Fast’ Growth in Atmospheric Methane, Nature, February 2022. https://doi.org/10.1038/d41586-022-00312-2
[13] IEEFA 2020, Institute for Energy Economics & Financial Analysis, “IEEFA Brief: The Australian LNG Industry’s Growth – and the Decline in Greenhouse Gas Emissions Standards,” April 2020. http://ieefa.org/ieefa-brief-the-australian-lng-industrys-growth-and-the-decline-in-greenhouse-gas-emissions-standards/.
[14] Alvarez et al 2018, Assessment of Methane Emissions from the U.S. Oil and Gas Supply Chain.” Science 361, no. 6398 (July 2018): 186–88. https://doi.org/10.1126/science.aar7204.
[15] Howarth, Robert W. “Howarth 2024: The Greenhouse Gas Footprint of Liquefied Natural Gas (LNG) Exported from the United States.” Energy Science & Engineering n/a, no. n/a (October 2024)
[16] Wijngaarden/Happer 2020: Dependence of Earth’s Thermal Radiation on Five Most Abundant Greenhouse Gases.” arXiv:2006.03098 [Physics], June 2020. http://arxiv.org/abs/2006.03098.
[17] based on IEA and other data, summarized by FutureCoal https://ift.tt/Ismt2l8
[18] The Future of European Competitiveness, European Union, Sep 2024, https://commission.europa.eu/document/download/ec1409c1-d4b4-4882-8bdd-3519f86bbb92_en?filename=The%20future%20of%20European%20competitiveness_%20In-depth%20analysis%20and%20recommendations_0.pdf
[19] BGR 2024, Energiestudie – Daten und Entwicklungen der deutschen und globalen Energieversorgung”, 2024, https://doi.org/10.25928/ES-2023.
via Watts Up With That?
October 21, 2024 at 12:04PM
Lest I forget, the comment count stands at around 999,405. Sometime in the next few days we will hit one million.
10 out of 10 based on 1 rating
via JoNova
October 21, 2024 at 10:13AM
Hot, Hot, Hot. You will have noticed that the term “climate change” is now synonymous with “summer”. Since the northern hemisphere is where most of the world’s land, people and media are located, two typical summer months and a hot European August have been depicted as the fires of hell awaiting any and all who benefit from fossil fuels. If you were wondering what the media would do, apart from obsessing over the many small storms this year, you are getting the answer.
Fortunately, Autumn is on the way and already bringing cooler evenings in Montreal where I live. Once again open windows provide fresh air for sleeping, while mornings are showing condensation, and frost sometimes. This year’s period of “climate change” is winding down. Unless of course, we get some hurricanes the next two months. Below is a repost of seasonal changes in temperature and climate for those who may have been misled by the media reports of a forever hotter future.

Autumnal Climate Change
Seeing a lot more of this lately, along with hearing the geese honking. And in the next week or two we expect that trees around here will lose their leaves. It definitely is climate change of the seasonal variety.
Interestingly, the science on this is settled: It is all due to reduction of solar energy because of the shorter length of days (LOD). The trees drop their leaves and go dormant because of less sunlight, not because of lower temperatures. The latter is an effect, not the cause.
Of course, the farther north you go, the more remarkable the seasonal climate change. St. Petersburg, Russia has their balmy “White Nights” in June when twilight is as dark as it gets, followed by the cold, dark winter and a chance to see the Northern Lights.

And as we have been monitoring, the Arctic ice has been melting from sunlight in recent months, but is already building again in the twilight, to reach its maximum in March under the cover of darkness.
We can also expect in January and February for another migration of millions of Canadians (nicknamed “snowbirds”) to fly south in search of a summer-like climate to renew their memories and hopes. As was said to me by one man in Saskatchewan (part of the Canadian wheat breadbasket region): “Around here we have Triple-A farmers: April to August, and then Arizona.” Here’s what he was talking about: Quartzsite Arizona annually hosts 1.5M visitors, mostly between November and March.

Of course, this is just North America. Similar migrations occur in Europe, and in the Southern Hemisphere, the climates are changing in the opposite direction, Springtime currently. Since it is so obviously the sun causing this seasonal change, the question arises: Does the sunlight vary on longer than annual timescales?
The Solar-Climate Debate
And therein lies a great, enduring controversy between those (like the IPCC) who dismiss the sun as a driver of multi-Decadal climate change, and those who see a connection between solar cycles and Earth’s climate history. One side can be accused of ignoring the sun because of a prior commitment to CO2 as the climate “control knob”.
The other side is repeatedly denounced as “cyclomaniacs” in search of curve-fitting patterns to prove one or another thesis. It is also argued that a claim of 60-year cycles can not be validated with only 150 years or so of reliable data. That point has weight, but it is usually made by those on the CO2 bandwagon despite temperature and CO2 trends correlating for only 2 decades during the last century.
One scientist in this field is Nicola Scafetta, who presents the basic concept this way:
“The theory is very simple in words. The solar system is characterized by a set of specific gravitational oscillations due to the fact that the planets are moving around the sun. Everything in the solar system tends to synchronize to these frequencies beginning with the sun itself. The oscillating sun then causes equivalent cycles in the climate system. Also the moon acts on the climate system with its own harmonics. In conclusion we have a climate system that is mostly made of a set of complex cycles that mirror astronomical cycles. Consequently it is possible to use these harmonics to both approximately hindcast and forecast the harmonic component of the climate, at least on a global scale. This theory is supported by strong empirical evidences using the available solar and climatic data.”
He goes on to say:
“The global surface temperature record appears to be made of natural specific oscillations with a likely solar/astronomical origin plus a noncyclical anthropogenic contribution during the last decades. Indeed, because the boundary condition of the climate system is regulated also by astronomical harmonic forcings, the astronomical frequencies need to be part of the climate signal in the same way the tidal oscillations are regulated by soli-lunar harmonics.”
He has concluded that “at least 60% of the warming of the Earth observed since 1970 appears to be induced by natural cycles which are present in the solar system.” For the near future he predicts a stabilization of global temperature and cooling until 2030-2040. Note that several El Nino spikes have temporarily taken the GMT (Global Mean Temperature) anomaly outside the forecasted bounds.
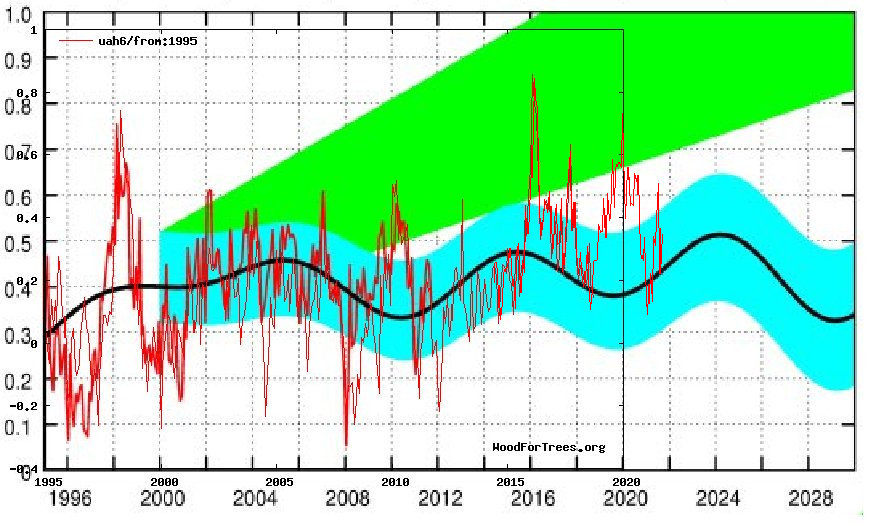
For more see Scafetta vs. IPCC: Dueling Climate Theories
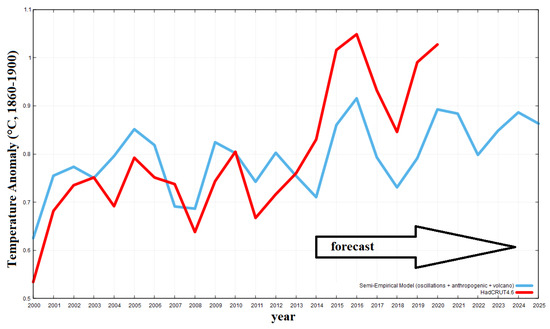
A more recent Scafetta publication is Reconstruction of the Interannual to Millennial Scale Patterns of the Global Surface Temperature in the journal atmosphere. There is provided this exhibit comparing his semi-empirical forecast to HadCRUT4
A Deeper, but Accessible Presentation of Solar-Climate Theory
I have found this presentation by Ian Wilson to be persuasive while honestly considering all of the complexities involved.
The author raises the question: What if there is a third factor that not only drives the variations in solar activity that we see on the Sun but also drives the changes that we see in climate here on the Earth?
The linked article is quite readable by a general audience, and comes to a similar conclusion as Scafetta above: There is a connection, but it is not simple cause and effect. And yes, length of day (LOD) is a factor beyond the annual cycle.
Click to access IanwilsonForum2008.pdf
It is fair to say that we are still at the theorizing stage of understanding a solar connection to earth’s climate. And at this stage, investigators look for correlations in the data and propose theories (explanations) for what mechanisms are at work. Interestingly, despite the lack of interest from the IPCC, solar and climate variability is a very active research field these days.
For example Svensmark has now a Cosmosclimatology theory supported by empirical studies described in more detail in the red link.
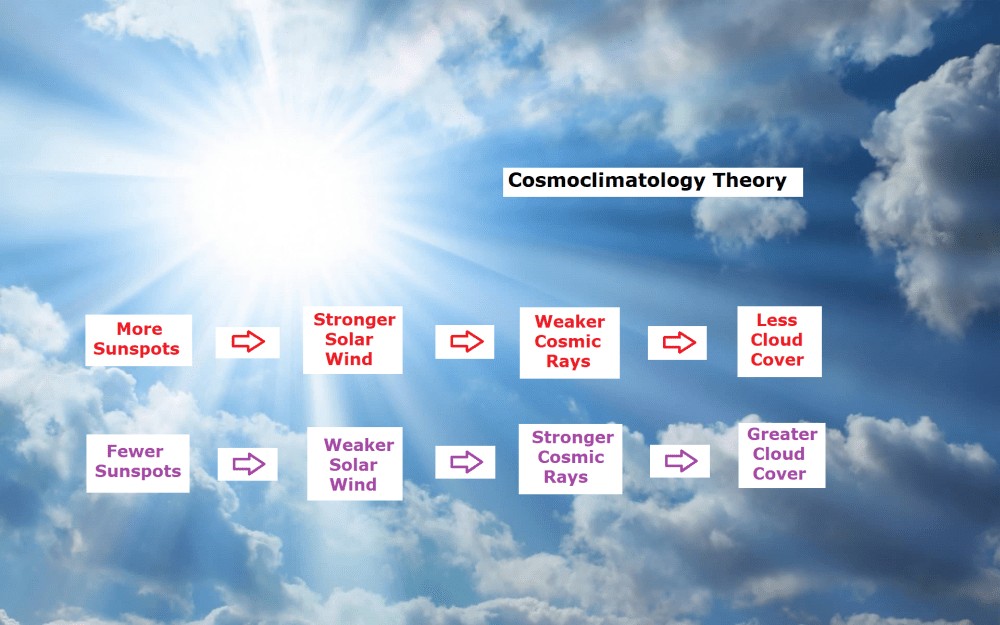
A summary of recent studies is provided at NoTricksZone: Since 2014, 400 Scientific Papers Affirm A Strong Sun-Climate Link
Ian Wilson has much more to say at his blog: http://astroclimateconnection.blogspot.com.au/
Once again, it appears that the world is more complicated than a simple cause and effect model suggests.

Fluctuations in observed global temperatures can be explained by a combination of oceanic and solar cycles. See engineering analysis from first principles Quantifying Natural Climate Change.
For everything there is a season, a time for every purpose under heaven.
What has been will be again, what has been done will be done again;
there is nothing new under the sun.
(Ecclesiastes 3:1 and 1:9)
Footnote:

via Science Matters
October 21, 2024 at 09:34AM

