If UK had never tried renewables, each person would be £3,000 richer

By Jo Nova

If the UK had  kept the old gas policy, skipped “renewables” — they’d be £220 billion better off

Since there are 67 million Britons, that means every man, woman and child would be £3,283 richer today. For a family of four that’s £13,000 of savings spread over 20 years.

Kathryn Porter has painstakingly unpacked the bureaucratic polyglot to add up the ghastly bill, and published “The true affordability of net zero”

“..had Britain continued with its legacy gas-based power system in the period since 2006, consumers would have been almost £220 billion better off (2025 money) even taking into account the impact of the gas crisis.

Even if the fuel is free, every other thing about collecting, storing and distributing “free energy” is very expensive.

Ed Milliband might blame fossil fuels for the train-wreck that is UK electricity — but the prices have been rising in the UK ever since vainglorious politicians first dreamt of fiddling with the weather. In the UK, even though wholesale prices remained the same largely, all the other costs of renewables snuck in to household prices to inflate them like the Hindenburg.


Renewables “profits” come from trickery, deceit and subsidy lies, and not from a free market in electricity

Firstly they lied that wind and solar would be cheaper, then they lied that the subsidies were temporary. Instead the subsidies are still growing 35 years after they started.  Last year the total cost of UK levies was £17.2 billion. These renewable subsidies were buried under boring anesthetic labels like “contracts for difference”, “capacity market” or the “CRC Energy Efficiency Scheme”.

Look at the rainbow cluster of levies in the graph below, and their growth in the last decade. If wind and solar were actually cheaper, or even just competitive, environmental levies would be “zero”. If wind and solar were getting more effective, the subsidies would be falling, not rising.


And if those levies had honest names they’d be called “Climate Changing Slush Fund”, or “Forced Renewable Support Fee”. The Contracts for Difference would be the “Guaranteed Profits for Windpower Levy”.

The Renewables Obligation levy could be the Banker Support Fund, or perhaps “Foreign Aid for China”.

By Johnathon Leake, The Telegraph:

According to analysis by consultant Kathryn Porter, green levies on energy bills will hit £20bn by the end of the decade. Staggeringly, this is up from £5bn in 2014, as the vast cost of Miliband’s radical clean energy ambitions rapidly adds up.

As part of Porter’s report into green levies, The True Affordability of Net Zero, she claims the renewables obligation scheme – which is responsible for supporting wind farm construction – is alone adding £7.8bn a year to power bills. That is despite it being closed to new entrants seven years ago. Its successor, the Contracts for Difference scheme (CfD), is adding another £2.3bn, she says.

Kathryn Porter points out that there are 10 levies that are added quietly to electricity bills, rather than being an honest tax. (It’s the same here in Australia).

“If this money was being raised through taxation, it would be scrutinised by the Treasury, the Office for Budget Responsibility, and by voters at general elections,” says Porter.

“But instead, Miliband is taking these subsidies from the pockets of consumers and giving them to renewable generators – without ever having had to win approval for the idea in an election.

These are forced payments from customers who get no choice, and which are hidden in their bills, disguised by lying labels in public announcements, and which are fed through electricity retailers to corporations.

Except for extremely rare circumstances, everything about renewable energy only profits because of State force, deception and trickery.

Read it all: Kathryn Porter: The true affordability of net zero


0 out of 10 based on 0 rating

via JoNova

https://ift.tt/cf5psrt

May 21, 2025 at 02:49PM

Underton DCNN 4783 – Enthusiastically not bothered and more Met Office data manipulation.

52.52379 -2.46790 Met Office CIMO Assessed Class 4 Installed 1/7/2014.

Underton is an official Met Office “Climate Reporting” and manually recording weather station which appears on this listing https://www.metoffice.gov.uk/research/climate/maps-and-data/uk-synoptic-and-climate-stations. To ensure clarity (and retention) here is a screen shot of its entry.

I am confident that everyone viewing this would agree this weather station is genuinely attributable to the UK Met Office…….or is it?

From the Met Office weather observations website -WOW- (https://wow.metoffice.gov.uk/observations/details?site_id=881196001 Which includes data from amateur and unofficial sites we have this below.

The site carries the official Met Office logo but under site details the “Reasons for running the site” are shown as “Enthusiast” with the location given as a “wildlife reserve” and having been awarded the 2024 “Bronze Award”. {Quite for what or why such awards are granted is not clear and almost certainly irrelevant to accuracy or data recording as I will demonstrate.} However, this site description with no website address shown is completely at odds with the way other Met Office stations are shown on WOW which appear like this:

Why Underton is so differently described (almost to the point of seemingly being disowned) I have been unable to ascertain, though I can demonstrate that the Met office publishes and archives its readings…..on the occassions when the “enthusiast” actually either bothers to take them or manages to get them right.

For uniformity, I will assess the site quality though it really is rather a pointless exercise given the atrocious readings record I will highlight later and the typically bizarre interpretations the Met Office makes of them.

The above image indicates no obstructions within the immediate (smaller) 10 metres circle radius. On this basis alone Class 3 could almost be considered plausible, however, this site fails miserably on even on the Met Office stipulations

Not only is the site heavily sheltered by trees and hedging it also sits in a frost hollow indicated by the Ordnance survey sheet. It is worth noting Shropshire has recorded England’s lowest ever temperature in similar frost hollow conditions at the original Newport station. At the bottom of a 100 metre slope in a river valley with small lakes known as “Pam’s Pool” (also the name of the wildlife reserve) rather indicates a significant frost hollow. Whilst a great site for recording extreme lows it really is not representative of a wider area.

Looking at the site history I find it quite ridiculous that in 2014 the Met Office is still adding such absurdly low grade sites to its official network. The CIMO regulations had been adopted when this site was “chosen” so what possible reason did the Met Office have in including a unit known to have inaccuracy due to siting of (at best) +/- 2°C by their own assessment? I do not accept the Class 4 rating and such a site, if it must be used, only ranks Class 5 and is officially “Undesirable”. …..but what of its readings record?

  1. 2014 The site started readings 1st July. Despite opening enthusiasm out of a potential 191 days only 159 readings were taken.
  2. 2015 342 days readings were taken but on 5 of those either t.max or t.min were missing making daily averages impossible to calculate so only 339 days (93%) viable readings.
  3. 2016 344 days readings, 8 missing components thus only 336 (92%) viable readings.
  4. 2017 341 days readings, 141 missing components thus only 230 (63%) viable readings.
  5. 2018 ZERO maximum readings taken thus ZERO daily averages can be derived.
  6. 2019 ZERO maximum readings taken thus ZERO daily averages can be derived.
  7. 2020 ZERO maximum readings taken thus ZERO daily averages can be derived.
  8. 2021 Somebody eventually either fixed the PRT or alternatively learned how to read it (minima are read on LIG) on the 20th June. Here is when the Met Office mania for constructing nonsensical averages took over

The above data was extracted from viewing the CEDA data downloads. The following was obtained under Freedom of Information act which together with the number of days viable readings that were actually taken also shows the “Mean Daily Air Temperature” that the Met Office derived from the readings. Here is the data for Underton for 2021.

Carrying on the site’s tradition of unenthusiastically bothering to actually fulfil the basic function of a weather station and only taking readings 177 times out of 365 (48% of the time) the Met Office amazingly derived a mean daily air temperature of 12.7°C. A sign of how completely farcical such a figure (that the Met Office felt unembarrassed to release under FOI) actually is, consider where the Met Office compares Underton’s data to.

Leaving aside the obligatory (it seems) Zombie stations of Halesowen and Penkridge which both died over 20 years ago, the alleged nearest “well correlated …..climate station” is Shawbury . Here are the comparative figures for there.

Shawbury (an automatic unit) recorded 363 days and provided a mean daily air temperature of 10.2°C, a mere 2.5°C cooler than Underton.

Does the Met Office expect to be taken seriously when openly producing such comedic data? I challenge any meteorologist – in fact anyone at all – to justify this arrant misuse of data.

To continue going through the history, 2022 saw a sudden uplift in effort and for the only year ever in its existence Underton broke the 350 barrier with 351 readings viable readings taken. Typically recidivism returned and for the last archived year of 2023 just 302 readings were managed with an abrupt stop before the year end. If Underton is still reporting is anyone’s guess. I would ask the Met Office if the site is still operational but I asked that same question regarding Eastbourne back in February and they have not deigned to answer at all.

The Met Office is currently refusing to divulge (even under FOI) which “well correlated” stations are being used to compile “climate averages” for long closed weather stations, some of which closed over half a century ago. Could this be because they do not want people to know that readings from such appallingly bad sites like Underton are actually being used in that “process”. I have taken the Met Office FOI refusal responses to further challenge on the basis that if they cannot verify the data used then the derived data is “unproveable.” and thus false. I also have further enquiries relating to “Historic Stations” such as Lowestoft and Nairn:Druim where data is being estimated and attributed on an ongoing basis despite station closure. If the Met office cannot/will not state which stations are being used now in 2025 then there is clear proof of data fabrication.

via Tallbloke’s Talkshop

https://ift.tt/3s7lrHY

May 21, 2025 at 02:01PM

Who Knew? Western Societies Growing More Equal, Not Less

Daniel Waldenstrom makes the case at Foreign Affairs The Inequality Myth.  Excerpts in italics with my bolds and added images.

Western Societies Are Growing More Equal, Not Less

Spend a few minutes browsing political commentary or scrolling social media and you will discover a seemingly settled truth: inequality in the West is soaring, the middle class is being hollowed out, and democracies stand on the brink of oligarchy. The idea is seductive because it fits everyday anxieties in many Western countries—housing has grown increasingly unaffordable, billionaire wealth mushrooms unfathomably, and the pandemic exposed yawning gaps in social safety nets. Yet the most influential claims about inequality rest on selective readings of history and partial measurements of living standards. When the full balance sheet of modern economies is tallied—including taxes, transfers, pension entitlements, homeownership, and the fact that people move through income brackets across their lives—the story looks markedly different. Western societies are not nearly as unequal as many believe them to be.

Getting the facts right matters because bad diagnosis breeds bad prescriptions. If governments assume that capitalism is inexorably recreating the disparities of the Gilded Age, they will reach for wealth confiscations, price controls, or ever-larger public sectors funded by fragile tax bases. If, instead, the evidence shows that free-market economies have enriched middle classes by expanding asset ownership, that entrepreneurs’ fortunes are associated with advances shared with the broader public, and that much of the post-1980 rise in recorded inequality reflects methodological quirks, then a different agenda follows: states should encourage ambition, protect competition, widen access to wealth-building, and ensure that public services complement—not smother—private prosperity.

In short, before treating inequality as an existential crisis,
it is worth double-checking the thermometer.

Conventional Wisdom Overturned by Evidence

The canonical data tell only part of the story, and the least flattering part at that. A growing body of scholarship reassesses the long-run distribution of wealth by adding what earlier studies neglected. Three findings stand out.

First, private wealth has exploded—but so has broad ownership of it.

Reconstructed national balance sheets for France, Germany, Spain, Sweden, the United Kingdom, and the United States show real per-adult wealth roughly tripling since 1980 and rising more than sevenfold since 1950. Crucially, an increasing share of that capital sits in the homes and pension funds of ordinary households. In 1900, assets held by the elite—agricultural domains and shares in industrial or financial corporations—dominated; today, residential property and funded retirement accounts represent the majority of private assets. That shift parallels mass homeownership: in most Western countries, 60 to 70 percent of households now own the roof over their heads—an equity stake unavailable to their great-grandparents. Most workers hold pension claims in mutual funds or index funds, granting them the high returns of stock markets at low risk—what amounts to financial democratization.

Second, wealth concentration has fallen—not risen—over the past century.

In Europe, the top one percent now owns barely a third of the share it held in 1910, right before the beginning of the transformative era of world wars, democratization, and the growth of governmental capacity, and since the 1970s that share has been essentially flat, even as real wealth—that is, wealth adjusted for inflation—has tripled with rising asset prices. The United States shows a clearer uptick beginning in the 1970s, most visible among the spectacular fortunes of tech and finance titans, whose gains have outpaced even the impressive wealth growth of the middle class. Yet U.S. concentration remains closer to its 1960 level than to its pre-1914 peak. The dominant quantitative fact of the century, therefore, is not a new Gilded Age but a dramatic wealth equalization propelled by mass asset ownership.

Third, the fact that people move through different income brackets over the course of their lives should temper typical measures of inequality.

So, too, should the effects of welfare payments. Annual snapshots lump graduate students with retirees living off savings, making income and wealth gaps appear wider than lifetime consumption gaps. When studies in different countries instead follow individuals over time, they typically find that within only a few years, half the households in the bottom income decile have climbed to higher levels. Many top-decile households can drop to lower rungs of the ladder after business or investment setbacks. Government welfare programs further compress differences. In Sweden, when public pension entitlements are capitalized and added to assessments of personal wealth, this alone cuts the measured wealth inequality—known as the Gini coefficient—by almost half. In the United States, the market’s redistributive role is smaller, but when Social Security, Medicare, and employer-provided health insurance are treated as in-kind income, median households fare far better than raw wage data suggest.

Social Alarmists Out of Touch with Today’s Realities

These facts undermine the image of an inexorably widening chasm between a plutocratic elite and the rest. Yes, superstar entrepreneurs have amassed fortunes measured in tens of billions. But that outcome signals success, not failure: they furnished goods and services that millions freely bought. Their booming companies also supply jobs, higher wage earnings, and substantial tax revenue—directly through profits and payrolls and indirectly by raising the broader tax base. Over the past four decades, life expectancy in advanced economies (including in the United States despite the much-noted increase in “deaths of despair”) rose roughly six years, high school completion became nearly universal, and personal computers once reserved for elites went mainstream.

Those who typically bemoan the rise of inequality
don’t correctly weigh the size and division of the pie.

Rising real incomes and higher asset values are preconditions for mass prosperity and for a well-funded public sector. Even advocates of government intervention should champion efficient growth: every percentage point of GDP adds billions to tax revenue. The West’s most durable path to fairness, then, is to scale up the channels through which ordinary households acquire assets—including affordable housing supply, portable retirement accounts, and low-fee index funds—and to keep markets open so new firms can challenge incumbents.

That perspective should also moderate calls for annual taxes on the stock of net wealth, which have recently been proposed by some politicians and researchers, and have even been discussed officially at G-20 and UN meetings. These so-called wealth taxes are problematic because they hit illiquid assets, forcing entrepreneurs or farmers to borrow or liquidate. Scandinavian experience of such taxes shows that they produce meager revenues, come with high administrative costs, and encourage capital flight. If capital is to be taxed, a more efficient and equitable way is to tax capital income—such as dividends, realized gains, and corporate profits.

Evidence-based Priorities for Policymakers

Misreading inequality courts several risks. It diverts energy from the real challenges to Western economies, which include lax productivity growth, aging populations, and the imperatives of climate adaptation. These problems will strain public budgets. But excessive state-centrism and confiscatory wealth taxes impede capital formation and make financing those tasks harder, not easier. Misunderstanding inequality also breeds regressivity: taxing housing wealth indiscriminately can hit asset-rich but cash-poor retirees; taxing private firms can force sales to multinational giants with cheaper credit. And it corrodes trust: when citizens hear that capitalism benefits only the elite—even as their own living standards rise—they may grow cynical about official statistics and susceptible to populist cures worse than the disease.

A more accurate reading of the data supports a balanced agenda. To be clear, excessive wealth concentration poses risks—most notably to political integrity. Transparent rules for campaign financing and party contributions are essential to minimize the undue influence of money. Core welfare services, such as education and health care, should not become overly dependent on private funding, otherwise they would tie the quality of care to personal wealth—and in the process deepen inequality. The solution is not to curb wealth itself but to safeguard the integrity of political institutions and ensure equitable access to public goods.

States should celebrate entrepreneurial success and foster competition by reducing regulatory burdens—especially those that disproportionately affect smaller and younger firms. Taxation on labor income should be modest enough to incentivize hard work and also allow for the accumulation of new wealth, while capital taxation should target income rather than wealth or inheritances. Public investment should focus on building the capabilities that let households become stakeholders—education, infrastructure, and a rules-based climate that rewards risk-taking. Such an agenda accepts that inequality can coexist with, and even flow from, broad prosperity. Frustration with privilege should be channeled into reforms that expand opportunity rather than cap success.

This agenda advances neither laissez-faire complacency nor egalitarian maximalism. It is an acknowledgment that the West’s most remarkable achievement is not the fortune of a Jeff Bezos or Bernard Arnault but the mundane riches enjoyed by millions whose grandparents lived without antibiotics, central heating, or college degrees. Policymakers would do well to remember that progress before they diagnose calamity—and nurture the conditions that make it possible: secure property rights, open markets, and an efficient public sector powered by the very economic growth its advocates sometimes disparage.

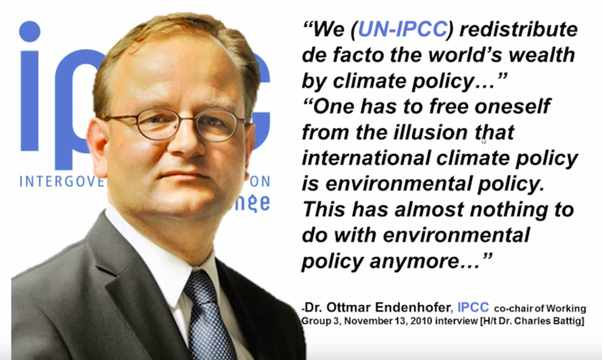
Footnote: The issue of adapting to climate change, raised in the article, perfectly illustrates the dichotomy of social perspectives regarding equality.


via Science Matters

https://ift.tt/3UTx5SW

May 21, 2025 at 01:07PM

Mission Accomplished!

Thirteen years ago, Donald Trump explained the climate scam. “The concept of global warming was created by and for the Chinese in order to make U.S. manufacturing non-competitive.” Donald J. Trump on X: “The concept of global warming was created … Continue reading

via Real Climate Science

https://ift.tt/timxKWr

May 21, 2025 at 12:39PM