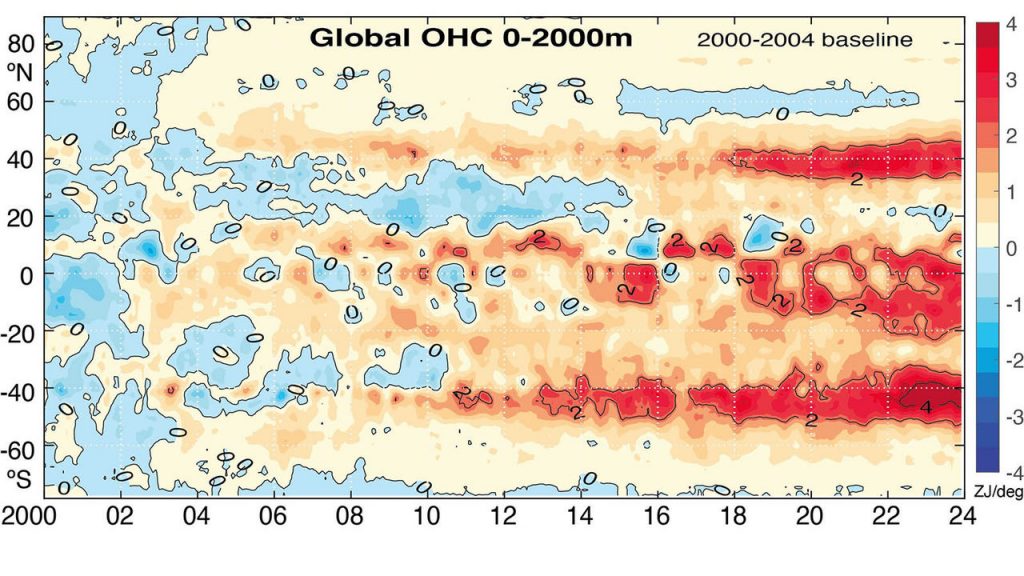
Oceanic Warming in Two Bands, NH and SH

Chart shows two red heating bands, one in the northern hemisphere and one in the south. A more variable area including high temperatures lies between the two bands.

A paper analyzing changes in Ocean Heat Content (OHC) since 2000 was published at University of Auckland, summarized here:  Unexpected ocean heat patterns show NZ in extreme zone.  Excerpts in italics with my bolds and added images.

The world’s oceans are heating faster in two bands stretching around the globe and New Zealand is in one of them, according to new research led by climate scientist Dr Kevin Trenberth.

In both hemispheres, the areas are near 40 degrees latitude. The first band at 40 to 45 degrees south is heating at the world’s fastest pace, with the effect especially pronounced around New Zealand, Tasmania, and Atlantic waters east of Argentina.  The second band is around 40 degrees north, with the biggest effects in waters east of the United States in the North Atlantic and east of Japan in the North Pacific.

“This is very striking,” says Trenberth, of the University of Auckland and the National Center of Atmospheric Research (NCAR) in Boulder, Colorado. “It’s unusual to discover such a distinctive pattern jumping out from climate data,” he says. “What is unusual is the absence of warming in the subtropics, near 20 degrees latitude, in both hemispheres.”

The heat bands have developed since 2005 in tandem with poleward shifts in the jet stream, the powerful winds above the Earth’s surface that blow from west to east, and corresponding shifts in ocean currents, according to Trenberth and his co-authors in the Journal of Climate.

Besides the two key zones, sizeable increases in heat took place in the area from 10 degrees north to 20 degrees south, which includes much of the tropics. However, the effect was less distinct because of variations caused by the El Niño-Southern Oscillation climate pattern, Trenberth says.

The scientists processed an “unprecedented” volume of atmospheric and ocean data to assess 1 degree latitude strips of ocean to a depth of 2000m for the period from 2000 to 2023, Trenberth says. Changes in heat content, measured in zettajoules, were compared with a 2000-04 baseline.

The AMS paper is Distinctive Pattern of Global Warming in Ocean Heat Content by Trenberth et al (2025). Excerpts in italics with my bolds and added images.
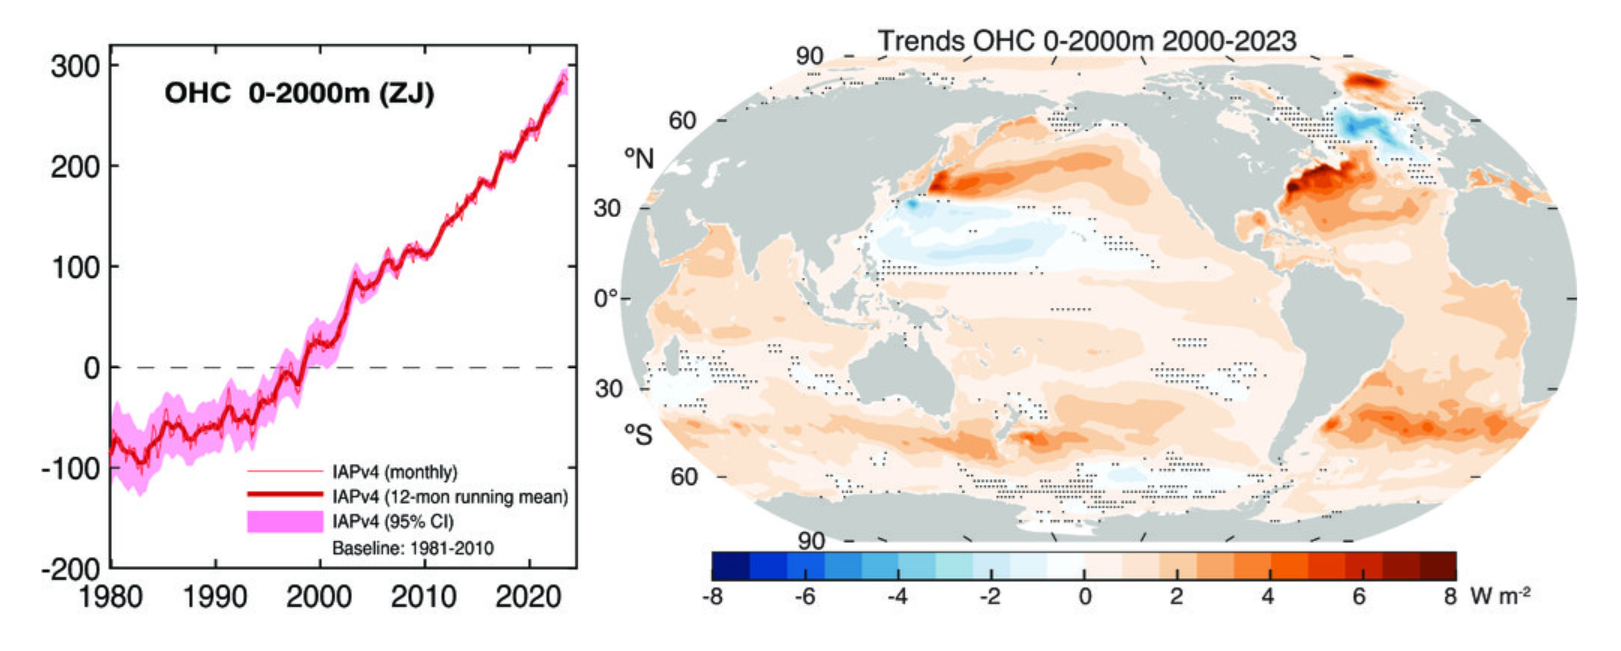
Fig. 1. (left) Global mean OHC (Cheng et al. 2024a) for 0–2000 m relative to a base period 1981–2010 (ZJ). The 95% confidence intervals are shown (sampling and instrumental uncertainties). (right) Trend from 2000 to 2023 in OHC for 0–2000 m (W m−2). The stippled areas show places where the trend is not significant at the 5% level.

The focus of this paper is from 2000 through 2023, as 2000 is when reliable TOA radiation data became available. Accordingly, the OHC for the 0–2000-m depth is shown not only for the global mean but also as spatial trends over the 2000–23 period (Fig. 1); see methods in section 2. The global values from 1980 show increased confidence after 2005 or so, when Argo data became available globally (Cheng et al. 2017, 2024b). The spatial patterns of trends are of considerable interest because, although the ocean is warming nearly everywhere, by far the greatest increases are in the midlatitudes: in western boundary currents east of Japan in the Kuroshio Extension region of the Pacific and in the Gulf Stream extension in the Atlantic, and nearly everywhere from 35° to 50°S in the Southern Hemisphere (SH). Wu et al. (2012) earlier noted that the warming rate in subtropical western boundary currents in all ocean basins far exceeds the globally averaged surface ocean warming rate. Of particular interest is why the midlatitudes are warming the most.

Conclusions

Heating in the climate system from 2000 to 2023 is most clearly manifested in zonal mean OHC for 0–2000-m depth. It occurs primarily in the top 300 m and is evident in SSTs. The SST changes emphasize surface warming in the NH, but the strongest energy increases are in the SH, where ocean area and volume are greater. In the NH, heating occurs at all latitudes in the Atlantic with some modulation and slightly reduced MHT from the south, but in the North Pacific, strong warming near 40°N is countered by cooling near 20°N. The zonal mean across all oceans is more robust than a focus on any particular ocean basin.

Estimates of TOA radiation, atmospheric energy transports, surface fluxes of energy, and redistribution of energy by surface winds and ocean currents reveal that the patterns of OHC warming are mostly caused by systematic changes in the atmospheric circulation, which alters ocean currents. The coupled atmospheric changes have resulted in a striking pattern of changes in the vertically integrated atmospheric energy divergence which is strongly reflected in surface wind stress and anomalous net surface heat fluxes into and out of the ocean.

In response to the wind changes, the ocean redistributes heat meridionally, especially in western boundary currents in the NH. Hence, the patterns are not directly related to TOA radiation imbalances but arise primarily from coupled atmosphere–ocean changes. In turn, those influence storms and cloudiness, and thus TOA radiation. Changes in atmospheric aerosols and associated clouds may have played a role in the North Pacific and North Atlantic, likely in amplifying SST anomalies, although, because land is warming a lot more than the oceans, advection of warmer air from continents over the northern oceans may also be in play.

In the NH, changes are associated with the western boundary currents, but the associated atmospheric changes require analysis of more than a zonal mean framework, as continents play a major role. Nonetheless, it is clear that the atmosphere and ocean currents are systematically redistributing heat from global warming, profoundly affecting local climates.

My Comment:

The final sentence read literally refers to heat released by oceanic activity under the influence of solar radiation and atmospheric circulations such as jet streams.  However, the term “global warming” can taken by some to mean planetary higher temperatures due to humans burning hydrocarbons.  The leap of faith to attribute human agency to natural processes serves an agenda against society’s traditional energy platform.

Further, the graph showing zettajoules can be misleading.  Ocean heat graphs labelled in Zettajoules make it look scary, but the actual temperature changes involved are microscopic, and impossible to measure to such accuracy in pre-ARGO days.

Since 2004, for instance, ARGO data shows an increase of about one hundredth of a degree.


via Science Matters

https://ift.tt/3ETrA9W

May 2, 2025 at 10:31AM

Saturday

10 out of 10 based on 1 rating

via JoNova

https://ift.tt/y9BDv8Z

May 2, 2025 at 09:02AM

Net Zero Subsidies Now Cost £26 Billion A Year–New Report Claims

By Paul Homewood


 image

A new report by the Renewable Energy Foundation claims that green energy subsidies are now costing the public £25.8 billion a year.

The Telegraph report:

Britain’s green energy subsidies have added an estimated £280 to households’ energy bills, research has found.

Levies used to encourage construction of wind farms, solar parks and other renewables have added £25.8bn a year to energy bills paid by both households and industry, according to a study from the Renewable Energy Foundation (REF).

The charity said the cost of the subsidies were a key factor in the UK’s sky-high electricity prices and blamed them for accelerating the decline of British industry.

John Constable, REF’s director, said: “Renewables subsidies are now costing £25.8 bn per year – or over £900 per household annually – about one third of which, £280, will hit the average domestic electricity bill directly.

Full story here.

REF’s report can be seen here.

Their numbers are largely the same as I have been reporting on for a while, including the official costings from the OBR of environmental levies, which are indisputable.

REF also include REGOs (Renewable Energy Guarantee of Origin certificates), which are increasingly profitable for renewable generators and, of course, end up being paid for by us.

They also includes the costs on fossil generators imposed by the UK Emissions Trading Scheme and Climate Change Levy. These not only increase our bills but also have the effect of increasing revenue for renewable generators.

John Constable has a full interview on GB News below:

Unsurprisingly DESNZ responded with a pack of lies and distortions, as the Telegraph reported:

A Government spokesman disagreed with the REF figures used in the report and said it “ignores the benefits of clean power and significantly misleads on the cost of renewables”.

A spokesman said: “As shown by the National Energy System Operator’s independent report, clean power by 2030 is achievable and will deliver a more secure energy system, which could see a lower cost of electricity and lower bills.”

How REF can be “significantly misleading on the cost of renewables” is a mystery, given that REF’s numbers all come from official data.

And as we already know, NESO’s claim of lower bills was totally fake. Their calculations were based on a massive rise in carbon taxes, which would artificially increase gas generation costs. Only by this legerdemain were they able to claim that more renewables would therefore be cheaper.

Either way, whatever our bills are in 2030 is utterly irrelevant to the fact that we are already paying £26 billion a year more than we should be. Shaving a billion or two off this in a few years time is neither here nor there.

via NOT A LOT OF PEOPLE KNOW THAT

https://ift.tt/EWoX0kA

May 2, 2025 at 08:38AM

Connecticut Lawmakers Devise Plan To Saddle Taxpayers with Soaring Energy Prices

From THE DAILY CALLER

Daily Caller News Foundation

Audrey Streb
Contributor

Connecticut Democratic lawmakers are proposing that taxpayers foot the bill for high utility costs in the state, which policy experts who spoke with the Daily Caller News Foundation largely attributed to state-funded renewable energy projects.

Senate Bill 1560 proposes removing the public benefits charge — a required surcharge on utility customers’ bills that funds state-mandated programs, including renewable energy investment — from electricity bills. Instead, the state would borrow up to $2.4 billion by selling bonds, thus transferring the financial burden from utility customers to taxpayers.

“They’re looking at creating this Electric Rate Stabilization Fund — taking taxpayer dollars and redistributing that to people to help them pay for their exorbitant electric bills that they’ve created,” CEO and founder of American Energy Institute Jason Isaac said. “They’re trying to virtue signal and appease a leftist base of their voters.”

The bill proposes significant changes to the state’s energy rate structures and would create the Connecticut Energy Procurement Authority to oversee both the Electric Rate Stabilization Fund (ERSF) and the Green Bond Fund (GBF). While the ERSF and GBF would both be funded by up to $2.4 billion in state-issued bonds over three years, the ERSF would focus on stabilizing electricity rates for consumers, while the GBF would support green energy and infrastructure projects. The bill additionally outlines that nuclear power generators in the state should be classified as renewable energy sources. (RELATED: ‘Just Getting Started’: Energy Experts Say Trump Admin Could Fuel ‘Nuclear Renaissance’)

“It’s an ingenious way to hide the fact that renewable energy and climate related programs are nothing but an unnecessary expense that do absolutely nothing for the climate,” author and Climate Depot executive editor Marc Morano told the DCNF, calling so-called green energy policies an “unbelievable grift” pushed on taxpayers.

Connecticut has supported several expensive renewable energy projects in the past, including for solar power development, zero-emission dock equipment and electric vehicle (EV) incentives. All the while, utility costs in New England and Connecticut have risen to be among the highest in the country, which one report by a coalition of six think tanks linked to the area’s several renewable energy projects. (RELATED: Consumers Set To Get Crushed As Energy Utilities Switch To Solar, Wind)

While the state eventually backed out of its proposed offshore wind projects, Connecticut sunk $311 million into refurbishing a pier with the purpose of launching offshore wind turbines that never made it out to sea, according to the CT Mirror. The fate of the project is still being discussed, though it is over $200 million over budget, WSHU Public Radio reports.

In May 2022, Democratic Connecticut Gov. Ned Lamont signed a law requiring the state’s electricity to be entirely carbon-free by 2040, officially codifying the standard he had first set by executive order in 2019. The legislation set several targets, including a reduction in emissions by 45% from 2001 levels by 2030.

Government-mandated energy projects in the state have received just over $1 billion annually from the public benefits charge, two electric distribution companies said in a testimony on April 16, according to Connecticut Inside Investigator.

Customers of Eversource, one of the energy distributors, are currently paying about $800 million annually in public benefits charges, which include $380 million for state-mandated solar energy procurement requirements, according to the testimony.

Connecticut has the third-highest electricity costs, behind Hawaii and California, according to February data from the U.S. Energy Information Administration. On average, Connecticut residents’ energy bills are 30% higher than the national average, according to an analysis from Home Energy Club. Moreover, states with renewable energy requirements see a roughly 4% increase the average electric bill, while in Connecticut the added cost is just over 5%, according to a 2024 report from Lawrence Berkeley National Laboratory.

As American energy demand continues to climb, the odds of impending blackouts would increase if the supply fails to grow at the same rate. The push toward renewable energy sources, in addition to stringent environmental regulations approved under former President Joe Biden, may have contributed to the slower growth of energy supply currently being experienced in the U.S.

Renewables are generally less reliable than other sources of power and need to work in tandem with “base load” power sources such as coal, energy experts previously told the DCNF. As several states around the U.S. ramp up climate initiatives and the demand for electricity continues to grow, many experts have warned that the risk of grid blackouts increases, with rolling blackouts predicted to begin by 2028, according to the North American Electric Reliability Corporation’s 2024 report.

President Donald Trump signed an executive order on April 8 directing his administration to examine state efforts to sue or impose large financial penalties on energy companies over climate change. The order is expected to focus on Democrat-led states such as New York and California, which have pursued legal actions seeking billions of dollars from the energy industry.

“American energy dominance is threatened when State and local governments seek to regulate energy beyond their constitutional or statutory authorities,” Trump’s order reads. “Many States have enacted, or are in the process of enacting, burdensome and ideologically motivated ‘climate change’ or energy policies that threaten American energy dominance and our economic and national security.”

While Biden encouraged the further development of renewables through billions of tax credits and subsidies under the Inflation Reduction Act, Trump declared a national energy emergency immediately upon his return to the White House, stating that “the integrity and expansion of our Nation’s energy infrastructure” is “an immediate and pressing priority for the protection of the United States’ national and economic security.” (RELATED: The Good, The Bad, And The Ugly: Biden’s Climate Bill Turns Two Years Old)

Connecticut’s Senate Bill 1560 progressed through the legislature’s Finance, Revenue and Bonding Committee Wednesday on a bipartisan vote, according to the CT Mirror. Democratic Connecticut Sen. John Fonfara, the bill’s sponsor, said that dropping the public benefits charge would cut electricity bills by 20% during a press conference on April 16, according to CT Insider.

“There are certain fundamental truths that we must acknowledge and act on if we want to reverse the path we are on,” Fonfara said at the conference. “If we choose to do nothing, electricity costs will continue to increase.”

Fonfara’s office did not respond to the DCNF’s request for comment.

“Within this legislative proposal are ideas that the governor looks forward to discussing further, such as ways to continue improving our standard service procurement process and smoothing out distribution use over the course of the day,” Rob Blanchard, the director of communications for Lamont, wrote to the DCNF. “However, there are concerns and significant questions as well.” (RELATED: Climate Activists Want To Blame Americans’ Soaring Utility Bills On Anything But Green Energy)

“Few examples exist, if at all, of states that have successfully introduced separate procurement authorities, let alone ones that operate outside of mechanisms designed to protect ratepayers and that can be done without saddling ratepayers with hundreds of millions of dollars more in expenses,” Blanchard continued. He said the governor “would prefer” the state cut “outdated or unnecessary” public charges, “rather than putting annual expenses on our ‘credit card’ or crowding out bonding for municipal parks, roads, and school construction.”

“Connecticut’s solution is to make taxpayers pay for electricity versus ratepayers and just shows the bankruptcy of the whole renewable energy movement,” Steve Milloy, a senior legal fellow at the Energy & Environment Legal Institute and creator of JunkScience told the DCNF. “Costs are higher and they’re always going to be higher,” Milloy added regarding renewable energy projects. “It’s never going to be cheaper.”

All content created by the Daily Caller News Foundation, an independent and nonpartisan newswire service, is available without charge to any legitimate news publisher that can provide a large audience. All republished articles must include our logo, our reporter’s byline and their DCNF affiliation. For any questions about our guidelines or partnering with us, please contact licensing@dailycallernewsfoundation.org.


Discover more from Watts Up With That?

Subscribe to get the latest posts sent to your email.

via Watts Up With That?

https://ift.tt/60UPj3S

May 2, 2025 at 08:07AM