
 The best context for understanding decadal temperature changes comes from the world’s sea surface temperatures (SST), for several reasons:
- The ocean covers 71% of the globe and drives average temperatures;
- SSTs have a constant water content, (unlike air temperatures), so give a better reading of heat content variations;
- A major El Nino was the dominant climate feature in recent years.
HadSST is generally regarded as the best of the global SST data sets, and so the temperature story here comes from that source. Previously I used HadSST3 for these reports, but Hadley Centre has made HadSST4 the priority, and v.3 will no longer be updated. HadSST4 is the same as v.3, except that the older data from ship water intake was re-estimated to be generally lower temperatures than shown in v.3. The effect is that v.4 has lower average anomalies for the baseline period 1961-1990, thereby showing higher current anomalies than v.3. This analysis concerns more recent time periods and depends on very similar differentials as those from v.3 despite higher absolute anomaly values in v.4. More on what distinguishes HadSST3 and 4 from other SST products at the end. The user guide for the current version HadSST4.1.1.0 is here. The charts and analysis below is produced from the current data.
The Current Context
The chart below shows SST monthly anomalies as reported in HadSST4 starting in 2015 through February 2025. A global cooling pattern is seen clearly in the Tropics since its peak in 2016, joined by NH and SH cycling downward since 2016, followed by rising temperatures in 2023 and 2024.
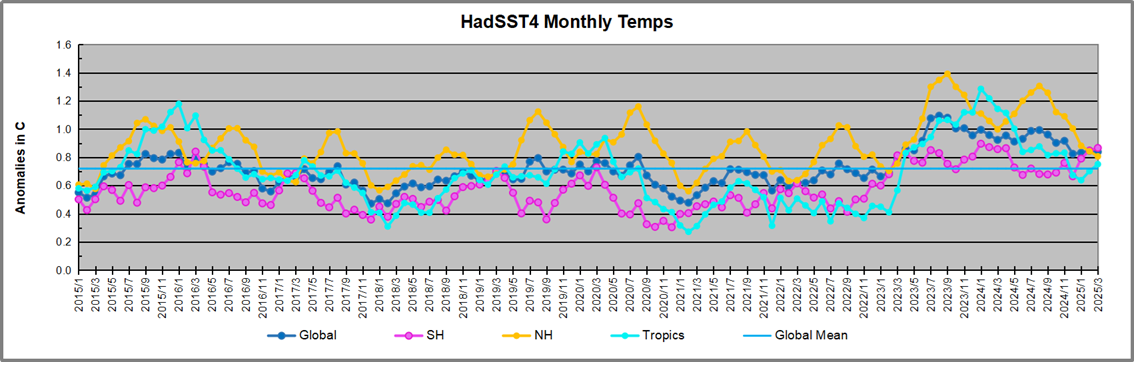
Note that in 2015-2016 the Tropics and SH peaked in between two summer NH spikes. That pattern repeated in 2019-2020 with a lesser Tropics peak and SH bump, but with higher NH spikes. By end of 2020, cooler SSTs in all regions took the Global anomaly well below the mean for this period. A small warming was driven by NH summer peaks in 2021-22, but offset by cooling in SH and the tropics, By January 2023 the global anomaly was again below the mean.
Then in 2023-24 came an event resembling 2015-16 with a Tropical spike and two NH spikes alongside, all higher than 2015-16. There was also a coinciding rise in SH, and the Global anomaly was pulled up to 1.1°C last year, ~0.3° higher than the 2015 peak. Then NH started down autumn 2023, followed by Tropics and SH descending 2024 to the present. After 12 months of cooling in SH and the Tropics, the Global anomaly came back down, led by NH cooling the last 8 months from its 1.3C peak in August, down to 0.8C in March. With some recent warming in the Tropics and SH, all regions are now close together nearly at the global anomaly, about 0.1C higher than the average for this period.
Comment:
The climatists have seized on this unusual warming as proof their Zero Carbon agenda is needed, without addressing how impossible it would be for CO2 warming the air to raise ocean temperatures. It is the ocean that warms the air, not the other way around. Recently Steven Koonin had this to say about the phonomenon confirmed in the graph above:
El Nino is a phenomenon in the climate system that happens once every four or five years. Heat builds up in the equatorial Pacific to the west of Indonesia and so on. Then when enough of it builds up it surges across the Pacific and changes the currents and the winds. As it surges toward South America it was discovered and named in the 19th century It iswell understood at this point that the phenomenon has nothing to do with CO2.
Now people talk about changes in that phenomena as a result of CO2 but it’s there in the climate system already and when it happens it influences weather all over the world. We feel it when it gets rainier in Southern California for example. So for the last 3 years we have been in the opposite of an El Nino, a La Nina, part of the reason people think the West Coast has been in drought.
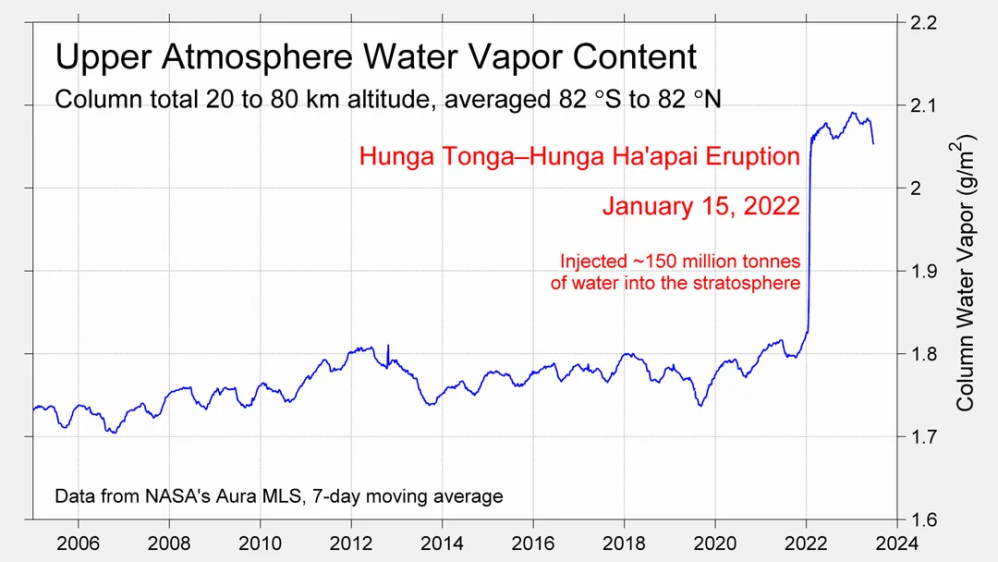
It has now shifted in the last months to an El Nino condition that warms the globe and is thought to contribute to this Spike we have seen. But there are other contributions as well. One of the most surprising ones is that back in January of 2022 an enormous underwater volcano went off in Tonga and it put up a lot of water vapor into the upper atmosphere. It increased the upper atmosphere of water vapor by about 10 percent, and that’s a warming effect, and it may be that is contributing to why the spike is so high.
A longer view of SSTs
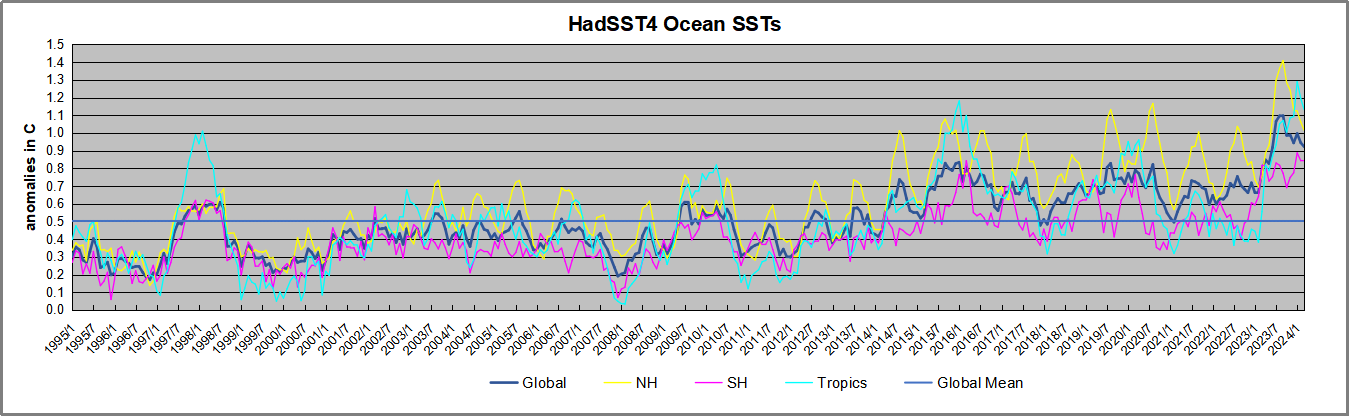
The graph below is noisy, but the density is needed to see the seasonal patterns in the oceanic fluctuations. Previous posts focused on the rise and fall of the last El Nino starting in 2015. This post adds a longer view, encompassing the significant 1998 El Nino and since. The color schemes are retained for Global, Tropics, NH and SH anomalies. Despite the longer time frame, I have kept the monthly data (rather than yearly averages) because of interesting shifts between January and July.
To enlarge image, open in new tab.
The graph above is noisy, but the density is needed to see the seasonal patterns in the oceanic fluctuations. Previous posts focused on the rise and fall of the last El Nino starting in 2015. This post adds a longer view, encompassing the significant 1998 El Nino and since. The color schemes are retained for Global, Tropics, NH and SH anomalies. Despite the longer time frame, I have kept the monthly data (rather than yearly averages) because of interesting shifts between January and July. 1995 is a reasonable (ENSO neutral) starting point prior to the first El Nino.
The sharp Tropical rise peaking in 1998 is dominant in the record, starting Jan. ’97 to pull up SSTs uniformly before returning to the same level Jan. ’99. There were strong cool periods before and after the 1998 El Nino event. Then SSTs in all regions returned to the mean in 2001-2.
SSTS fluctuate around the mean until 2007, when another, smaller ENSO event occurs. There is cooling 2007-8, a lower peak warming in 2009-10, following by cooling in 2011-12. Again SSTs are average 2013-14.
Now a different pattern appears. The Tropics cooled sharply to Jan 11, then rise steadily for 4 years to Jan 15, at which point the most recent major El Nino takes off. But this time in contrast to ’97-’99, the Northern Hemisphere produces peaks every summer pulling up the Global average. In fact, these NH peaks appear every July starting in 2003, growing stronger to produce 3 massive highs in 2014, 15 and 16. NH July 2017 was only slightly lower, and a fifth NH peak still lower in Sept. 2018.
The highest summer NH peaks came in 2019 and 2020, only this time the Tropics and SH were offsetting rather adding to the warming. (Note: these are high anomalies on top of the highest absolute temps in the NH.) Since 2014 SH has played a moderating role, offsetting the NH warming pulses. After September 2020 temps dropped off down until February 2021. In 2021-22 there were again summer NH spikes, but in 2022 moderated first by cooling Tropics and SH SSTs, then in October to January 2023 by deeper cooling in NH and Tropics.
Then in 2023 the Tropics flipped from below to well above average, while NH produced a summer peak extending into September higher than any previous year. Despite El Nino driving the Tropics January 2024 anomaly higher than 1998 and 2016 peaks, following months cooled in all regions, and the Tropics continued cooling in April, May and June along with SH dropping. After July and August NH warming again pulled the global anomaly higher, September through January 2025 resumed cooling in all regions, with a slight upward bump in February-March 2025.
What to make of all this? The patterns suggest that in addition to El Ninos in the Pacific driving the Tropic SSTs, something else is going on in the NH. The obvious culprit is the North Atlantic, since I have seen this sort of pulsing before. After reading some papers by David Dilley, I confirmed his observation of Atlantic pulses into the Arctic every 8 to 10 years.
Contemporary AMO Observations
Through January 2023 I depended on the Kaplan AMO Index (not smoothed, not detrended) for N. Atlantic observations. But it is no longer being updated, and NOAA says they don’t know its future. So I find that ERSSTv5 AMO dataset has current data. It differs from Kaplan, which reported average absolute temps measured in N. Atlantic. “ERSST5 AMO follows Trenberth and Shea (2006) proposal to use the NA region EQ-60°N, 0°-80°W and subtract the global rise of SST 60°S-60°N to obtain a measure of the internal variability, arguing that the effect of external forcing on the North Atlantic should be similar to the effect on the other oceans.” So the values represent SST anomaly differences between the N. Atlantic and the Global ocean.
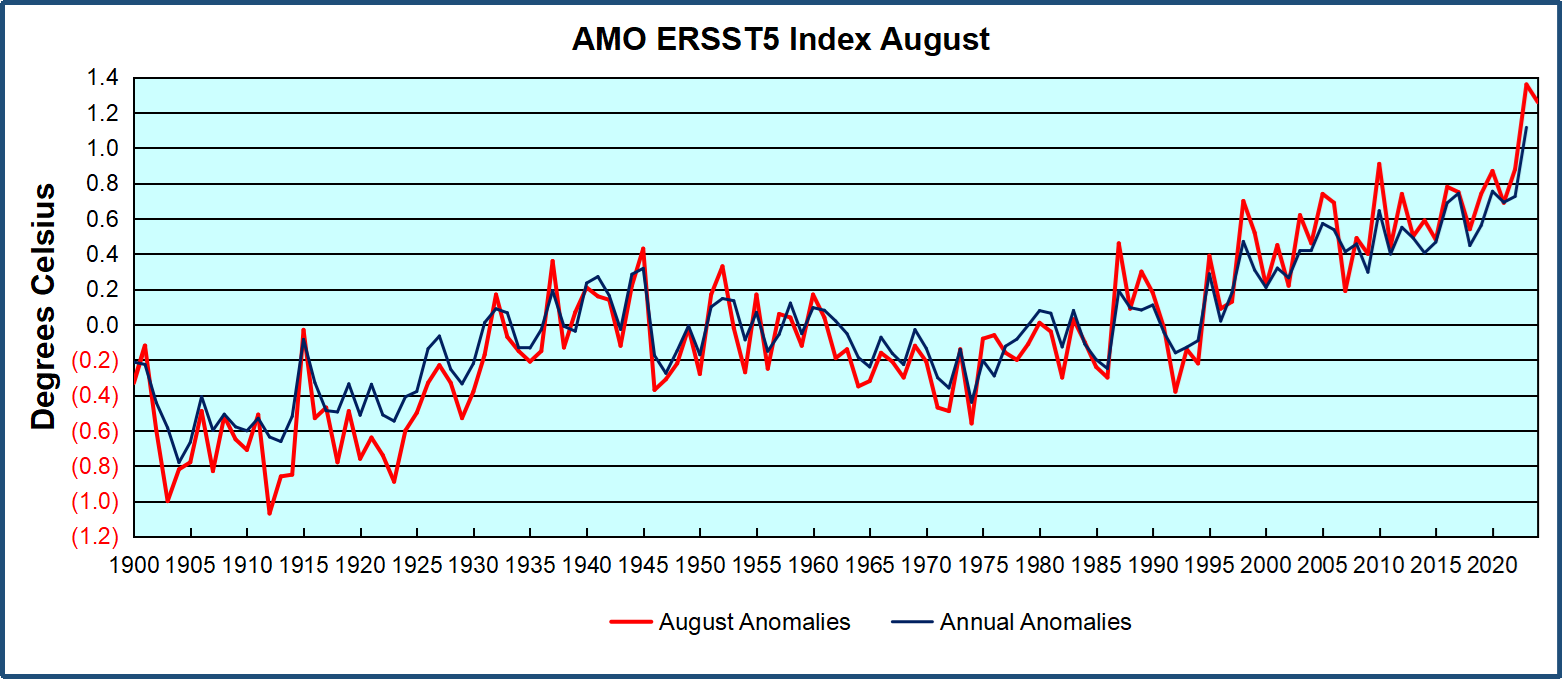
The chart above confirms what Kaplan also showed. As August is the hottest month for the N. Atlantic, its variability, high and low, drives the annual results for this basin. Note also the peaks in 2010, lows after 2014, and a rise in 2021. Then in 2023 the peak was holding at 1.4C before declining. An annual chart below is informative:
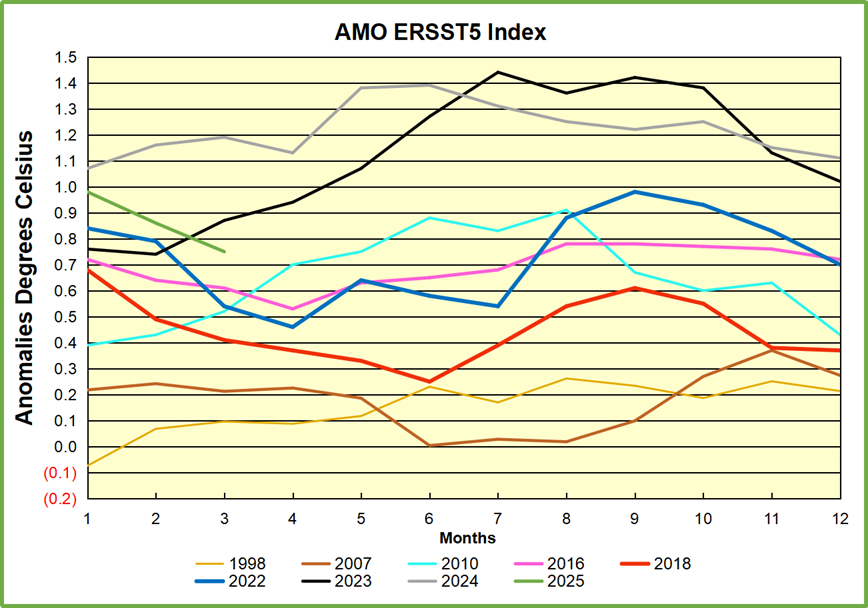
Note the difference between blue/green years, beige/brown, and purple/red years. 2010, 2021, 2022 all peaked strongly in August or September. 1998 and 2007 were mildly warm. 2016 and 2018 were matching or cooler than the global average. 2023 started out slightly warm, then rose steadily to an extraordinary peak in July. August to October were only slightly lower, but by December cooled by ~0.4C.
Then in 2024 the AMO anomaly started higher than any previous year, then leveled off for two months declining slightly into April. Remarkably, May showed an upward leap putting this on a higher track than 2023, and rising slightly higher in June. In July, August and September 2024 the anomaly declined, and despite a small rise in October, ended close to where it began. Now 2025 started much lower than the previous year and is headed sharply downward.
The pattern suggests the ocean may be demonstrating a stairstep pattern like that we have also seen in HadCRUT4.
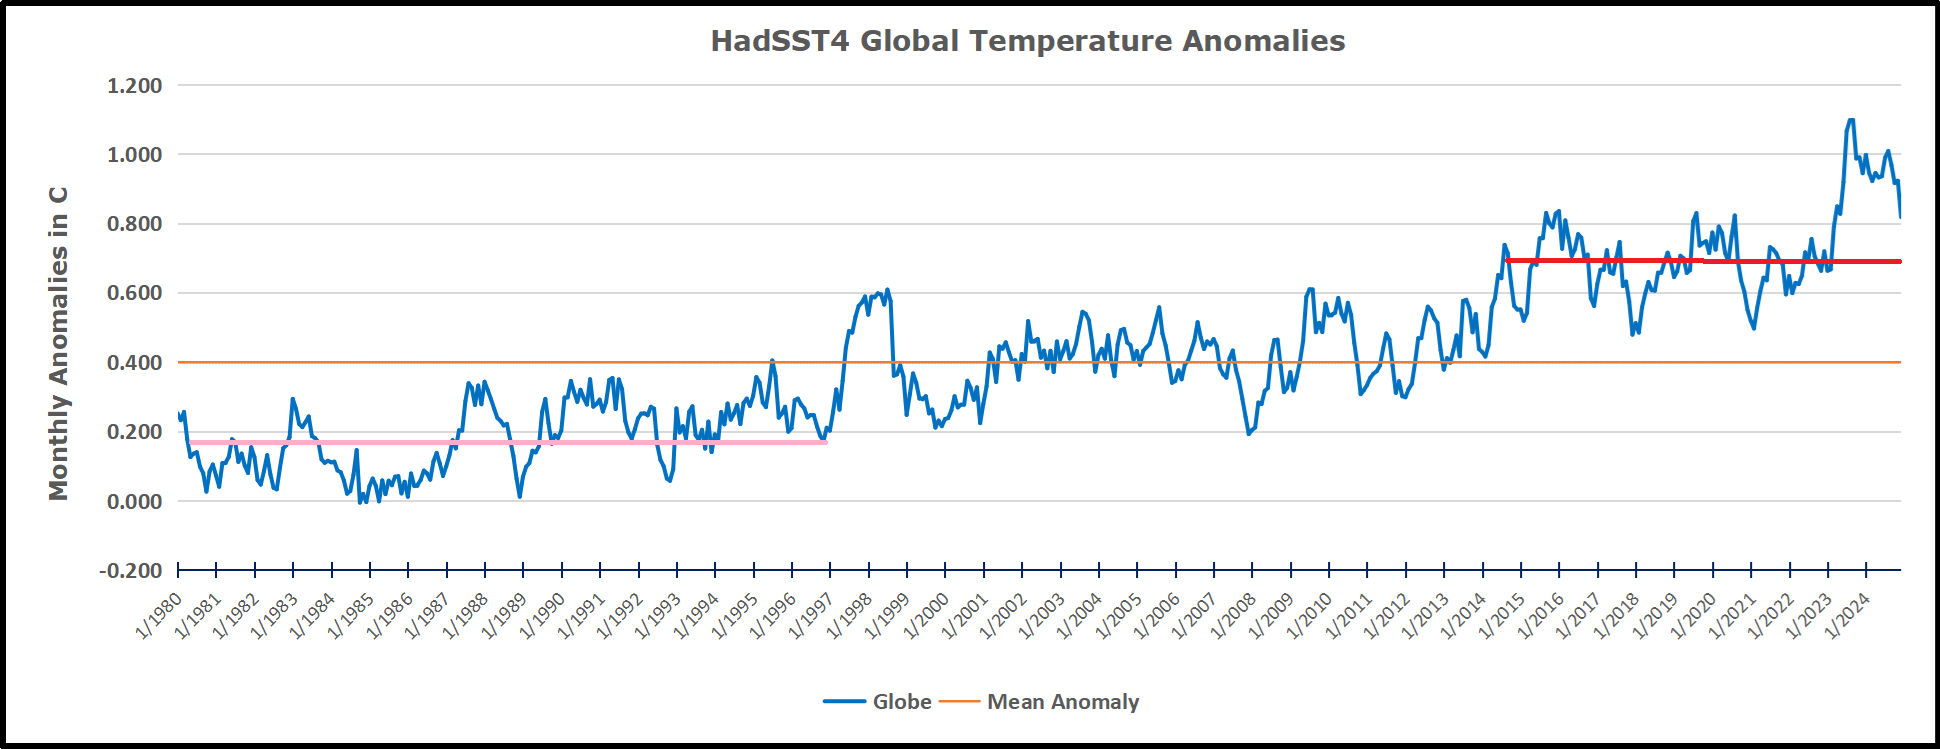
The purple line is the average anomaly 1980-1996 inclusive, value 0.17. The orange line the average 1980-2024, value 0.38, also for the period 1997-2012. The red line is 2013-2024, value 0.67. As noted above, these rising stages are driven by the combined warming in the Tropics and NH, including both Pacific and Atlantic basins.
Curiosity: Solar Coincidence?
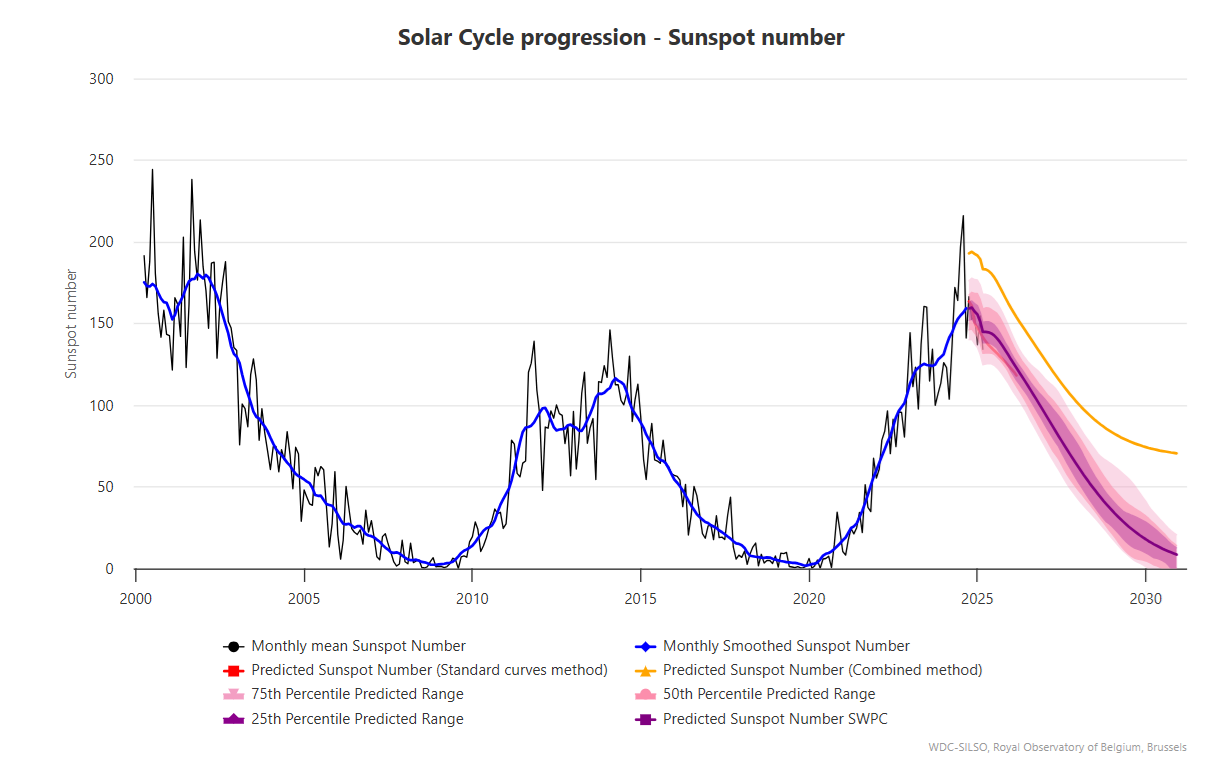
The news about our current solar cycle 25 is that the solar activity is hitting peak numbers now and higher than expected 1-2 years in the future. As livescience put it: Solar maximum could hit us harder and sooner than we thought. How dangerous will the sun’s chaotic peak be? Some charts from spaceweatherlive look familar to these sea surface temperature charts.
Summary
The oceans are driving the warming this century. SSTs took a step up with the 1998 El Nino and have stayed there with help from the North Atlantic, and more recently the Pacific northern “Blob.” The ocean surfaces are releasing a lot of energy, warming the air, but eventually will have a cooling effect. The decline after 1937 was rapid by comparison, so one wonders: How long can the oceans keep this up? And is the sun adding forcing to this process?
Footnote: Why Rely on HadSST4
HadSST is distinguished from other SST products because HadCRU (Hadley Climatic Research Unit) does not engage in SST interpolation, i.e. infilling estimated anomalies into grid cells lacking sufficient sampling in a given month. From reading the documentation and from queries to Met Office, this is their procedure.
HadSST4 imports data from gridcells containing ocean, excluding land cells. From past records, they have calculated daily and monthly average readings for each grid cell for the period 1961 to 1990. Those temperatures form the baseline from which anomalies are calculated.
In a given month, each gridcell with sufficient sampling is averaged for the month and then the baseline value for that cell and that month is subtracted, resulting in the monthly anomaly for that cell. All cells with monthly anomalies are averaged to produce global, hemispheric and tropical anomalies for the month, based on the cells in those locations. For example, Tropics averages include ocean grid cells lying between latitudes 20N and 20S.
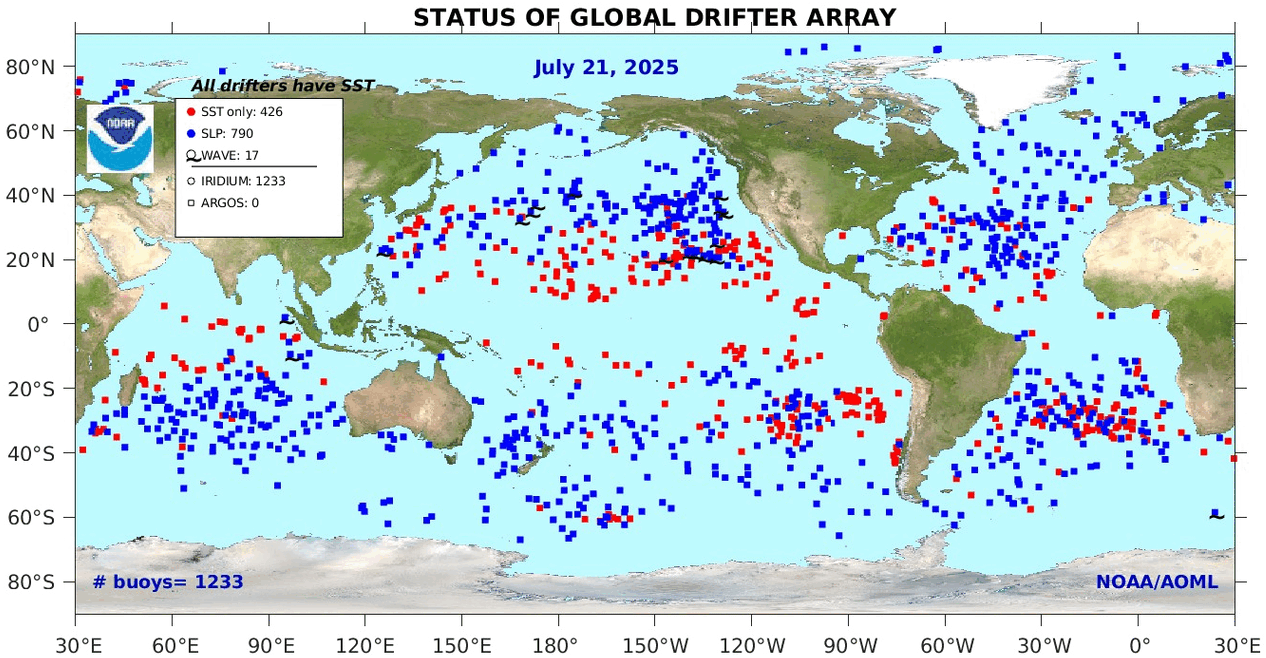
Gridcells lacking sufficient sampling that month are left out of the averaging, and the uncertainty from such missing data is estimated. IMO that is more reasonable than inventing data to infill. And it seems that the Global Drifter Array displayed in the top image is providing more uniform coverage of the oceans than in the past.

USS Pearl Harbor deploys Global Drifter Buoys in Pacific Ocean
via Science Matters
April 23, 2025 at 09:09AM


