Evidence of Catastrophic Glacier Melt in… New York City?

Guest “It doesn’t get any dumber than this” by David Middleton

Hat tip to Mrs. Middleton…

Climate Ready: Evidence in NYC shows rapid glacier melt is leading to real-world effects

By Dani Beckstrom WABC
Friday, March 28, 2025

NEW YORK CITY (WABC) — It’s not just in the movies; the ice on our planet is melting faster than we ever thought possible.

This melting is not just taking place at the North and South Poles.

“Everything from the relatively small glaciers that we’re use to looking iconically at, to the Alps, the Rockies, Alaska,” Robin Bell, geophysicist and glaciologist, said.

[…]

“There’s a tide gauge down at the Staten Island Ferry Terminal,” said Bell. “And sea levels have just been going up.”

[…]

New York City’s history with glaciers goes much further back.

“About 20,000 years ago, this whole area was under ice,” Steven Jaret, research associate at the American Museum of Natural History, said. “It would have been here about 1,000 to 2,000 feet thick.”

In parts of New York State, more than a mile and a half of ice covered what is now ground level, which is more than four times the height of one World Trade Center.

[…]

Eyewitless News ABC 7

The article goes on to describe all of the breathtaking evidence of catastrophic glacier melting in and around New York City: Glacial erratics, glacial striations, more glacial erratics… Oddly enough they failed to mention that Long Island is basically a terminal moraine. They even included a cute video, with clips from the Ice Age cartoons.

Evidence of Late Pleistocene “rapid glacier melt” in modern-day New York City “is leading to real-world effects” about as much as the presence of Ordovician Period marine fossils leads on Mount Everest to evidence of Noah’s Flood.

Regarding sea level rise… When this much ice melted…

Sea level rose at a rapid rate of about 11 mm/yr over a period of about 10,000 years…

Figure 2. Global seal level rise during Holocene Transgression. Meltwater Pulse 1A (MWP 1A) occurred ~14.6 kya. Note the error bar is ±12 meters. Older is toward the right.
(Siddall et al., 2003)

Zooming in on the past 7,000 years (older is toward the left), we can see that the Late Pleistocene rapid sea level rise peaked between 6,000 and 5,000 years ago during the Holocene Climatic Optimum.
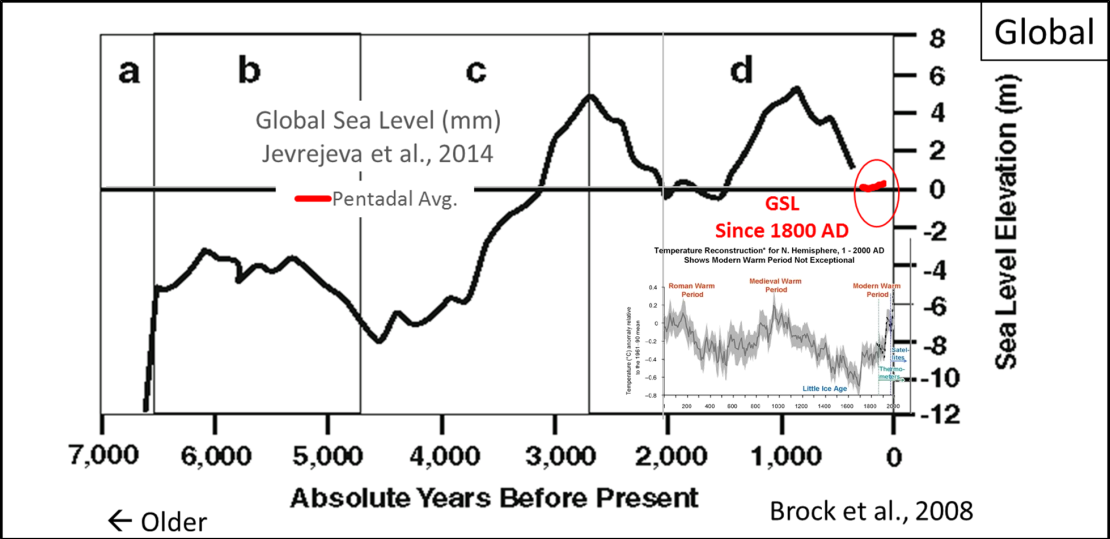
Figure 3. Global last 7,000 years, error bars omitted (Brock et al, 2008 after Sidall et al., 2003). Older is toward the left. Jevrejeva et al., 2014 (J14) is overlaid in red at the same scale. Ljungqvist, 2010 nothern hemisphere climate reconstruction is also overlaid. The relatively large swings in SLR over the past 4,000 years are clearly consistent with the millennial scale Holocene climate cycle.

About 1,000 years ago as the climate transitioned from the Medieval Warm Period to the Little Ice Age, sea level fell. by as much as 6 meters, before beginning to slowly rise again in the mid-1800’s.

Figure 4. Jevrejeva et al., 2014 (J14, red) and Church & White, 2011 (CW11, green).

Here’s a plot of CW11 shifted to the same datum as J14:

Figure 5. J14 vs CW11. 310 mm is less than the length of an Estwing rock pick. The green curve is CW11’s pentadal (5-yr) average. The red curve is J14’s pentadal average. The CW11 y-axis is shifted up 100 mm to tie J14.

About 13 inches of sea level rise over a 150 year period.

This brings us back to New York City…

“There’s a tide gauge down at the Staten Island Ferry Terminal,” said Bell. “And sea levels have just been going up.”

There is? Better let NOAA know about it…

Let’s take a peak at the actual tide gauges:

The relative sea level trend is 2.94 millimeters/year with a 95% confidence interval of +/- 0.09 mm/yr based on monthly mean sea level data from1856 to 2024 which is equivalent to a change of 0.96 feet in 100 years.

The Battery 2.94 mm/yr

The Battery has the longest record length at nearly 170 years…. A steady rate of 2.94 ±0.09 mm/yr, starting 47 years prior to this climatic catastrophe:

Of course, that 2.94 ±0.09 mm/yr is a combination of the water moving up and the land moving down.

NASA-Led Study Pinpoints Areas of New York City Sinking, Rising

Sept. 27, 2023

Scientists using space-based radar found that land in New York City is sinking at varying rates from human and natural factors. A few spots are rising.

Parts of the New York City metropolitan area are sinking and rising at different rates due to factors ranging from land-use practices to long-lost glaciers, scientists have found. While the elevation changes seem small – fractions of inches per year – they can enhance or diminish local flood risk linked to sea level rise.

The new study was published Wednesday in Science Advances by a team of researchers from NASA’s Jet Propulsion Laboratory in Southern California and Rutgers University in New Jersey.

[…]

The scientists found that on average the metropolitan area subsided by about 0.06 inches (1.6 millimeters) per year – about the same amount that a toenail grows in a month.

[…]

NASA JPL

So, we can knock 1.6 mm/yr off of the 2.94 mm/yr, reducing the actual rise in sea level elevation to 1.34 mm/yr.

Figure 9. “Mapping vertical land motion across the New York City area, researchers found the land sinking (indicated in blue) by about 0.06 inches (1.6 millimeters) per year on average. They also detected modest uplift (shown in red) in Queens and Brooklyn. White dotted lines indicate county/borough borders.
 Credit: NASA/JPL-Caltech/Rutgers University” NASA JPL

In the Science Advances paper, the “scientists” claimed that sea level rise at The Battery is accelerating.

During the 20th century, relative sea level at the Battery tide gauge in Manhattan, New York City increased at a rate of about 3.1 mm/year. From 2000 to 2022, that rate has increased to 4.4 mm/year. About 1.5 ± 0.2 mm/year of this rate has been attributed to subsidence driven by glacial isostatic adjustment [GIA; (1–3)]. 

Buzzanga et al., 2023

Even if we accept the acceleration claim, 4.4 – 1.5 still takes us back to 2.9 mm/yr… The same rate it’s been since before the Confederacy fired on Fort Sumter.

However, quick look at NOAA’s “Variations of 50-Year Relative Sea Level Trends” clearly demonstrates that the apparent recent acceleration is simply due to the well-documented, roughly 60-yr cycle (quasi-periodic fluctuation for the math nerds) in the rate of sea level rise.

This cycle is most likely related to the Atlantic Multi-decadal Oscillation (Gervais, 2016, NCAR) and not to fossil fuel consumption.

Yes, I know… Correlation does not equal causation. However, with out correlation, it’s rather difficult to move on to causation.

Then there’s Bergen Point, with the shortest record length, entirely within the current up-swing of the ~60-yr cycle.

I’m surprised they didn’t cite Bergen Point as evidence of accelerated sea level rise [/Sarc off]

So… Yes, there’s lots of evidence that massive sheets of ice once covered New York City and much of the Northern Hemisphere… But they melted… A long time ago… And that’s a good thing. However, those ice sheets will almost certainly return at some point in the geologically near future. And that will be a very bad thing and far more catastrophic than 3 mm/yr of sea level rise:

As if the Eyewitless News ABC 7 story wasn’t dumb enough…

March 31, 2025

Big Banks Quietly Prepare for Catastrophic Warming

Morgan Stanley, JPMorgan and an international banking group have quietly concluded that climate change will likely exceed the Paris Agreement’s 2 degree C goal and are examining how to maintain profits

By Corbin Hiar & E&E News

CLIMATEWIRE | Top Wall Street institutions are preparing for a severe future of global warming that blows past the temperature limits agreed to by more than 190 nations a decade ago, industry documents show.

The big banks’ acknowledgment that the world is likely to fail at preventing warming of more than 2 degrees Celsius above preindustrial levels is spelled out in obscure reports for clients, investors and trade association members.

Most were published after the reelection of President Donald Trump, who is seeking to repeal federal policies that support clean energy while turbocharging the production of oil, gas and coal — the main sources of global warming.

[…]

Scientific American

Cue “correlation is not causation”… Allow myself to repeat myself… From 1800 to 1900, per capita energy consumption, primarily from biomass, remained relatively flat; as did the average life expectancy. From 1900 to 1978, per capita energy consumption roughly tripled with the rapid growth in fossil fuel production (coal, oil & gas). This was accompanied by a doubling of average life expectancy. While I can’t say that fossil fuels caused the increase in life expectancy, I can unequivocally state that everything that enabled the increase in life expectancy wouldn’t have existed or happened without fossil fuels, particularly petroleum.

Our modern society would not exist without fossil fuels and it would collapse in a heartbeat if fossil fuels were made unavailable and/or unaffordable. One of the coolest things about being a petroleum geologist, is that I can give thanks for fossil fuels and say “you’re welcome” in the same sentence.

References

Brock, J.C.,  M. Palaseanu-Lovejoy, C.W. Wright, & A. Nayegandhi. (2008). “Patch-reef morphology as a proxy for Holocene sea-level variability, Northern Florida Keys, USA”. Coral Reefs. 27. 555-568. 10.1007/s00338-008-0370-y. 

Buzzanga, Brett et al. ,Localized uplift, widespread subsidence, and implications for sea level rise in the New York City metropolitan area. Sci. Adv. 9, eadi8259(2023).DOI:10.1126/sciadv.adi 8259

Church, J.A., White, N.J., 2011. “Sea-level rise from the late 19th to the early 21st Century”. Surv. Geophys. https://ift.tt/v5gMdNe.

Gervais, François. Anthropogenic CO2 warming challenged by 60-yearcycle. Earth-Science Reviews. Volume 155, 2016, Pages 129-135, ISSN 0012-8252,

Jevrejeva, S. , J.C. Moore, A. Grinsted, A.P. Matthews, G. Spada. 2014.  “Trends and acceleration in global and regional sea levels since 1807”.  Global and Planetary Change. %vol 113, 10.1016/j.gloplacha.2013.12.004 https://ift.tt/1RcKpLt

Lomborg, Bjorn . Welfare in the 21st century: Increasing development, reducing inequality, the impact of climate change, and the cost of climate policies. Technological Forecasting and Social Change. Volume 156, 2020, 119981, ISSN 0040-1625, https://ift.tt/Ym36NTG.

Ljungqvist, F.C. 2010. “A new reconstruction of temperature variability in the extra-tropical Northern Hemisphere during the last two millennia”. Geografiska Annaler: Physical Geography, Vol. 92 A(3), pp. 339-351, September 2010. DOI: 10.1111/j.1468-459.2010.00399.x

MacFarling Meure, C., D. Etheridge, C. Trudinger, P. Steele, R. Langenfelds, T. van Ommen, A. Smith, and J. Elkins (2006), Law Dome CO2, CH4 and N2O ice core records extended to 2000 years BP, Geophys. Res. Lett., 33, L14810, doi:10.1029/2006GL026152.

Siddall M, Rohling EJ, Almogi-Labin A, Hemleben C, Meischner D, Scmelzer I, Smeed DA (2003). “Sea-level fluctuations during the last glacial cycle”. Nature 423:853–858


Discover more from Watts Up With That?

Subscribe to get the latest posts sent to your email.

via Watts Up With That?

https://ift.tt/tvVjCZ6

April 8, 2025 at 04:01PM

Trump goes gangbusters on coal power and coal mining to supply AI energy demand

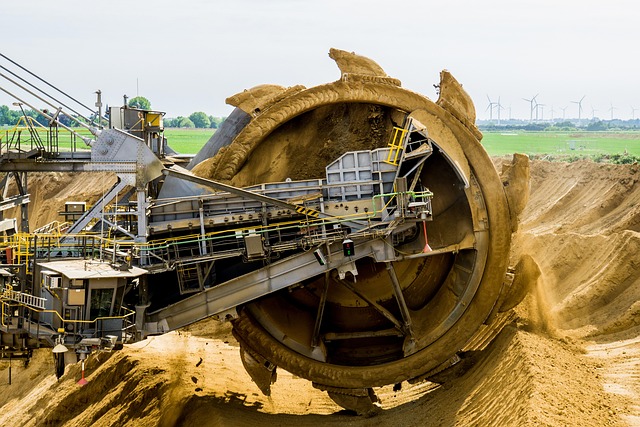
Coal Mine Excavation

By Jo Nova

Trump slays the core Green Chimera

Any moment now President Trump is expected to sign an executive order that will boost coal mining, keep old coal power stations running and even restart shuttered coal plants. The word is that the US government will define coal as a “mineral” which allows him to use presidential wartime authority to speed up approvals for coal mines, and to bypass environmental red tape and even prioritize exploration and mining on federal lands.

US agencies will be told to rescind any policies that aim to “transition away from coal” or “otherwise establish preferences against using fossil fuels”. The country with the largest known coal reserves in the world is now planning to increase coal exports.

Furthermore Trump will ask the Energy Department to consider whether coal should be listed as a ‘critical mineral’ — something described as a ‘coveted status’ which activates even more emergency powers.

Shares of coal companies in the US are up 11 to 18%, and the whole Australian obsession with closing our plants suddenly looks like a quaint book club garden party.

While this will trigger the green brigade, they have nothing but the usual fantasies and wowser scoffing.

[The Guardian]  Energy experts say any bump for coal under Trump is likely to be temporary because natural gas is cheaper and there is a durable market for renewable energy such as wind and solar power no matter who holds the White House.

Except there is barely any market for pure wind and solar power without truckloads of government subsidies. As soon as subsidies end, the solar panel companies go out of business.

And of course, the  intellectual titans hope pure scorn and mindless indignation will scare people away like little teenage girls:

“What’s next, a mandate that Americans must commute by horse and buggy?” said Kit Kennedy, managing director of power at the Natural Resources Defense Council.

This changes everything

As this news breaks, Australia is 3.5 weeks away from an election. We have the third largest coal reserves in the world, and are often the world’s largest exporter of coal. Despite this, we treat coal like it’s kryptonite. It’s time to break this spell.

The last week of tariff turmoil has been tough for the conservative opposition here in the shadow of teetering stock markets, but this could flip that effect the other way, if the Coalition can peg the Government as being irrationally anti-coal, pointlessly out of touch, and still fighting the last war while the real world steams on.

This is the golden opportunity for Peter Dutton. This is the moment when Australia could run industrial AI datacenters on the cheapest coal power in the world. Our brown coal plants are still winning wholesale bids at 3 cents a kilowatt hour. We don’t have to be just a quarry where people do raindances to control the weather.

By Ari Natter and Jennifer Dlouhy, Bloomberg

President Donald Trump is moving to expand the mining and use of coal inside the US, a bid to power the boom in energy-hungry data centers and revive a flagging US fossil fuel industry.

The steps including emphasizing the US is back in the business of selling coal mining rights on federal land and ordering the rock be designated as a critical mineral. Other actions include accelerating the export of US coal and related technologies.

Nevertheless, the executive order underscores Trump’s commitment to tapping America’s coal resources as a source of both electricity to run data centers and heat to forge steel. The president and top administration officials have made clear boosting coal-fired power is a top priority, one they see as intertwined with national security and the US standing in a global competition to dominate the artificial intelligence industry.

Coal advocates were cheering the planned action Tuesday.

Trump wants to fix the electricity grid crisis:

“Despite countless warnings from the nation’s grid operators and energy regulators that we are facing an electricity supply crisis, the last administration’s energy policies were built on hostility to fossil fuels, directly targeting coal,” said Rich Nolan, the president of the National Mining Association. “The explosive growth and parallel energy demands of artificial intelligence and electrification have rendered that path not just unsustainable but plainly reckless.”

Mining.com lays out how big the coal industry used to be in the US. There is a massive skeleton of infrastructure Trump is working to revive:

Coal accounts for about 15% of power generation in the US today, down from more than half in 2000, according to the US Energy Information Administration. Since 2000, about 770 individual coal-fired units have shuttered, according to data from Global Energy Monitor, with more set to close.

No other major coal country is tying themselves into knots to keep the coal underground, or doing their best to stop using it. Australia is a basket case.

Image by Dorothe from Pixabay


10 out of 10 based on 1 rating

via JoNova

https://ift.tt/rUlw0Pq

April 8, 2025 at 03:54PM

Scarborough DCNN 2291 – A tad north of 44,000 square feet of roofed reservoir – where else would you put a weather station?

54.27274 -0.42252 Met Office CIMO Assessed CIMO Class 4 Installed 1/4/1987

This is my 200th post. As I said on my 100th post I had not initially started by cherry picking poor sites, in fact Scarborough is risibly defined as Class 4 and I have yet to cover a further 45 Class 5 sites. There are also 115 more Class 4 sites to review which demonstrates how incredibly few good quality sites the Met Office actually operates. Scarborough is yet another example of atrocious siting – how the Met Office makes this Class 4 is beyond belief.

There have been weather stations in Scarborough since 1879, the first at the Town Hall, a latter one at a plant nursery since developed and finally the above one which sits within 5 metres of the edge of the roofed Springhill reservoir. As can be seen from the headline image there are 44,000 square feet of heat absorbing dark roof immediately to the south. Any gentle breeze from the warmer south east around to the prevailing south west will be artificially warmed by this natural heat sink. Not only will this affect summer day time temperatures upwards but also especially the winter minima will be subject to a warmer micro climate. Looking at Class 4 here are the regulations

I doubt whether the authors ever considered a body of water being covered by a roof combining the effects though I am confident if they had they would not have considered it in any way natural. The 10 metre “exclusion zone” is as below.

Clearly the Met Office will say their tape measure confirms Class 4 is just about correct for flat measure, however, the roof is not a flat to the ground structure being elevated a metre above. So how does the topography look.

The tight contours (10 metre spacing) immediately show steep slopes surrounding the site and the hatch marks show the artificial groundworks both around the reservoir itself and immediate embankment. The adjacent road bears the same name as the reservoir i.e. Spring Hill and indicates the nature of the area. It is simply not credible to judge this site as meeting Class 4 – the artificial and natural slopes immediately exclude it and I am frankly astonished the Met Office feels it is acceptable to claim Class 4. The street view image shows the multiple problems.

In summary Scarborough is quite blatantly unacceptable for inclusion in the national historic temperature record. That this standard is the norm (49% of all UK weather stations are claimed to be class 4 by the Met Office and 29% Class 5) is a damning indictment of the poor standards of the Met Office.

via Tallbloke’s Talkshop

https://ift.tt/G1mtBZA

April 8, 2025 at 03:33PM

Politicized Science Case Study: National Climate Assessment

This post incorporates two dimensions of climate science reporting: firstly what and who are involved in the production, and secondly what the Trump administration might do to achieve a more balanced result. A recent article exposes the process by which the US National Climate Assessment (NCA) has been produced while ensuring that true believers control the content. Brent Scher writes at Daily Wire  Meet The Government Consultants Raking In Millions To Spread Climate Doom.  Excerpts in italics with my bolds and added images.

The government is outsourcing the ‘crown jewel’ of
climate change research to liberal climate consultants.

More than three decades ago, Congress launched an initiative called the U.S. Global Change Research Program. Today, it spends billions of dollars a year empowering liberal climate scientists to spread climate change doom. 

The government group says its role is to provide the “scientific foundation to support informed decision-making across the United States” on climate change. It’s done so by producing five National Climate Assessment reports, which are considered the “crown jewel” of climate research.

Despite taking funding from at least ten separate government agencies, producing the report seems to be the group’s sole function. The most recent iteration — published in 2023 and still prominently showcased on its government website — warns that “severe climate risks to the United States will continue to grow.” The next report is due out in the next couple of years, according to E&E News.

The National Climate Assessment is not simply an intellectual exercise, but rather one that carries real policy might. Congress and agencies use it to justify regulations and funding decisions, and states and cities across the country lean on it as the non-partisan scientific foundation for their own climate action plans. In summary, it is the scientific bedrock for directing policy at all levels of government towards liberal climate change goals.

While the U.S. Global Change Research Program states on its website that it has a budget of $4.95 billion in 2025, it only lists two full-time employees. So, who’s getting paid to put the massive and consequential report together?

Sources familiar with past iterations of the National Climate Assessment say the work is largely outsourced to a group called ICF, a massive government contractor that has an active contract to work on the report. The Daily Wire identified at least one active contract from NASA for ICF to “support” the U.S. Global Change Research Program. ICF is set to be paid millions of dollars during the Trump administration to “assist the nation and the world to understand, assess, predict, and respond to human-induced and natural processes of global change.”

The contract was first announced in June 2021, and described as a $34 million, five-year contract to help with the National Climate Assessments. Only $18 million has been paid out, according to the government spending database. But with another assessment on deck and ICF under contract for another year, the additional $16 million could be disbursed in the next year.

A climate scientist who has worked on the National Climate Assessment
in the past says ICF runs the show, virtually controlling
the entire U.S. Global Change Research Program.

“By providing all staff for the USGCRP, a federal agency, the ICF exerts undue influence over the global change narrative and priorities presented by the federal government,” said the official, who requested anonymity to discuss the work. “The ICF, through the USGCRP, exerts an undue influence on the production of the National Climate Assessment every four years. With the exception of its Executive Director and the Director of the National Climate Assessment, the ICF supplies all staff associated with the USGCRP.”

ICF takes in far more in government contracts than its active $34 million from NASA. An analysis of federal spending data found that the consulting firm rakes in hundreds of millions of dollars each year through federal contracts, and took in over $2 billion during the Biden administration.

The consulting firm is likely aware that the scope of its government work could be slashed during Trump’s term, and so are investors. Its stock price was at $171 a share days ahead of last November’s election, but has since cratered to just $77 a share, the lowest it had been since the last time Trump was president.  (Yes, the stock price fell before the current market volatility caused by tariffs).

Houston Keene, a former journalist who now leads a government transparency organization, argues that unnamed government consultants shouldn’t be paid millions to chart the nation’s climate policy.

“The public deserves an honest assessment from the government on the state of climate science,” Keene said. “That requires an objective, nonpartisan author who does not have financial interests in the outcome. ICF appears to be none of these things.”

“There can be no proper assessment with scientific integrity when a clearly partisan and financially conflicted activist organization is holding the pen,” he said.

A top Trump administration official, Russell Vought, has signaled that he wanted to exert more oversight over the next climate assessment. Vought runs the powerful Office of Management and Budget, and has openly stated that he wants to make deep cuts to “woke and weaponized” spending.

Vought has specifically called out the U.S. Global Change Research Program’s report, arguing that the bureaucrats who write it end up with outsized power over government action. He’s called for an investigation of the political leanings of the contractors that assemble the report.

A March 2025 report at SciAm provides background on recent developments regarding the NCA: Trump Official Who Tried to Downplay Major Climate Report Now Will Oversee It.  Excerpts in italics with my bolds and added images.

Stuart Levenbach alarmed scientists years ago when he attempted
to meddle with a congressionally mandated climate report

Stuart Levenbach was tapped last month by administration officials to serve as associate director for natural resources, energy, science, and water in the Office of Management and Budget.

The previous time President Donald Trump was in the White House, Levenbach attempted to tone down the summary conclusions of the National Climate Assessment, a wide-ranging report that relies on the contributions of hundreds of researchers to assess how global warming is transforming the United States.

Scientists say Levenbach tried to downplay climate risks in the fourth installment of the report, which comes out every four years or so. In that edition, Levenbach was concerned especially with the higher greenhouse gas emissions assumptions the report partially relied on and sought to soften the language of the report’s summary, the scientists say.

“He was the one that tried to slow it down to the point of it not coming out,” said Don Wuebbles, a climate scientist at the University of Illinois who has worked on all five previous National Climate Assessments.

Levenbach’s delay tactics were ultimately unsuccessful, and the fourth installment of the report was released in 2018 on the day after Thanksgiving.

In response to questions from Politico’s E&E News, a Trump administration official with the Office of Management and Budget described the scientists’ concerns as “fake news.”

The National Climate Assessment is based on a range of emissions scenarios, including those that are not worst-case scenarios. The fourth version of the report concluded the country was not on track to cut carbon dioxide emissions at a pace to avoid some of the worst consequences of climate change.

At the time, Levenbach’s role at NOAA carried more weight than usual because the agency was operating without a permanent administrator, and did so for the entire first Trump presidency.  Reached for comment, OMB spokeswoman Rachel Cauley did not deny that Levenbach tried to alter the report, but she criticized how it was put together.

“The assessment was riddled with the worst case scenario and
the authors weren’t transparent about it,” she said in a statement.”

Levenbach is joining OMB at a time when its director, Russ Vought, wants to suppress climate science throughout the federal government and increase Trump White House oversight over the next installment of the National Climate Assessment, which is due out in 2026 or 2027.

Levenbach’s appointment to a powerful White House role with oversight of the nation’s scientific endeavors comes at a time when the administration is preparing a possible challenge to the endangerment finding, a bedrock ruling which considers greenhouse gases a danger to public health and is a foundation of climate regulations.


via Science Matters

https://ift.tt/vxeoXUt

April 8, 2025 at 03:08PM