
Arctic Ice March Maximum 2025 in Perspective

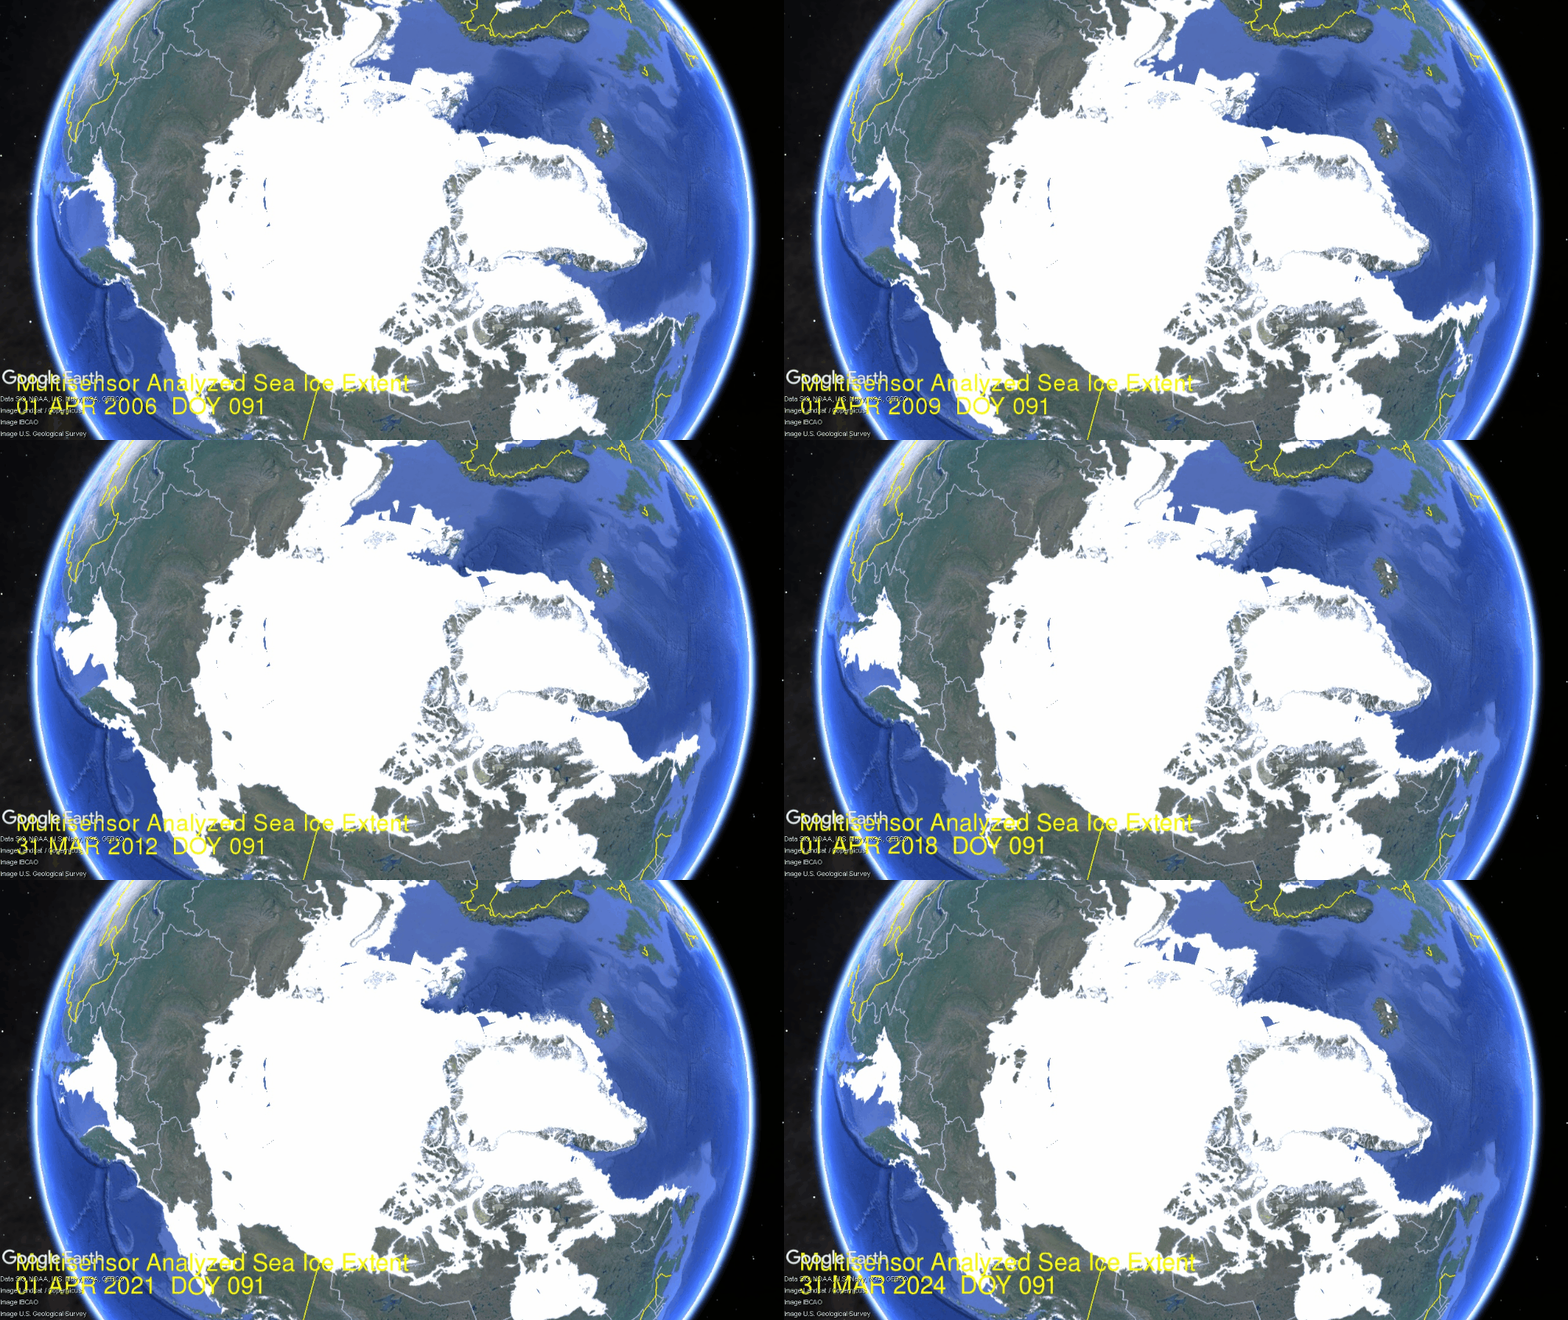
The animation shows end of March Arctic ice extents on day 91 over the last 19 years (length of MASIE dataset). Of course central Arctic basins are frozen solid, and the fluctuations are visible on the marginal basins both the Atlantic side (right) and the Pacific (left). Note the higher extents in 2012, followed by lesser ice, then overcome by 2024.

Climatology takes the March monthly average to indicate the annual maximum and September average as the minimum.  Dynamically, the Arctic gains and loses ice extents in this pattern:
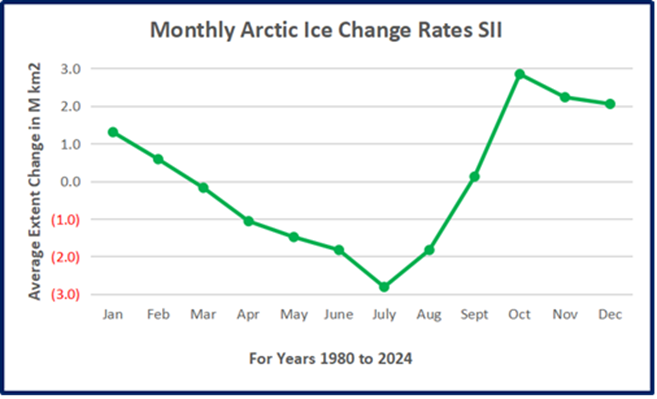
The values in the chart are the month ending ice extents (last five days average) minus the ice extents at end of the previous month.  Thus positive numbers show ice gained each month, negative numbers ice lost in a given month.  SII (Sea Ice Index) provides a data file calculating and updating these results since 1980. Note that the peak month of March on average declines very slightly, while the minimum month of September on average gains a little ice extent.  Also the greatest average gain of ice is in October and the greatest loss of extent is in July.
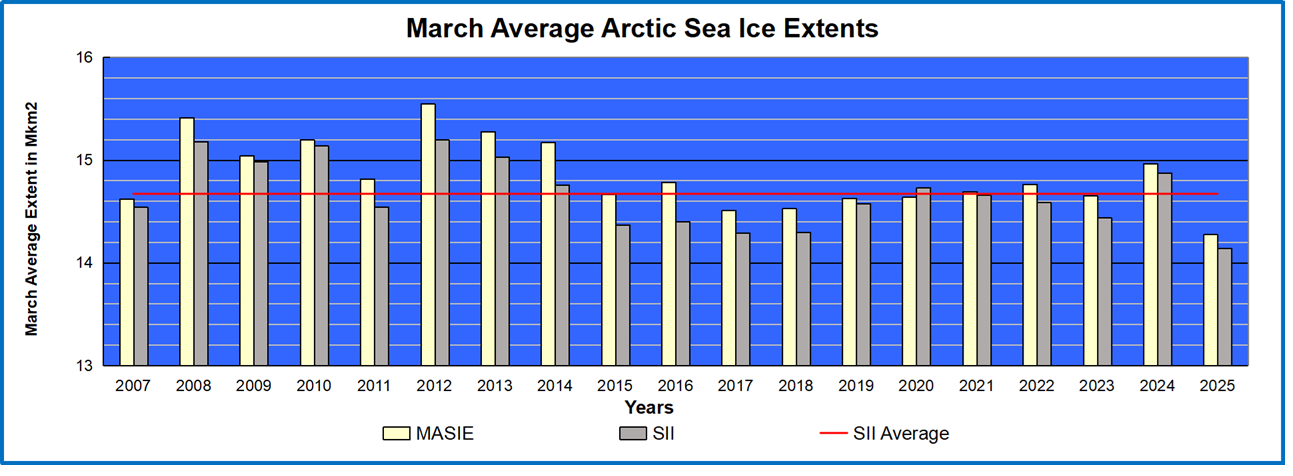
Above is a chart of March Monthly averages since 2007. The variability shows, including 2024 well above the 19-year average and 2025 well below.
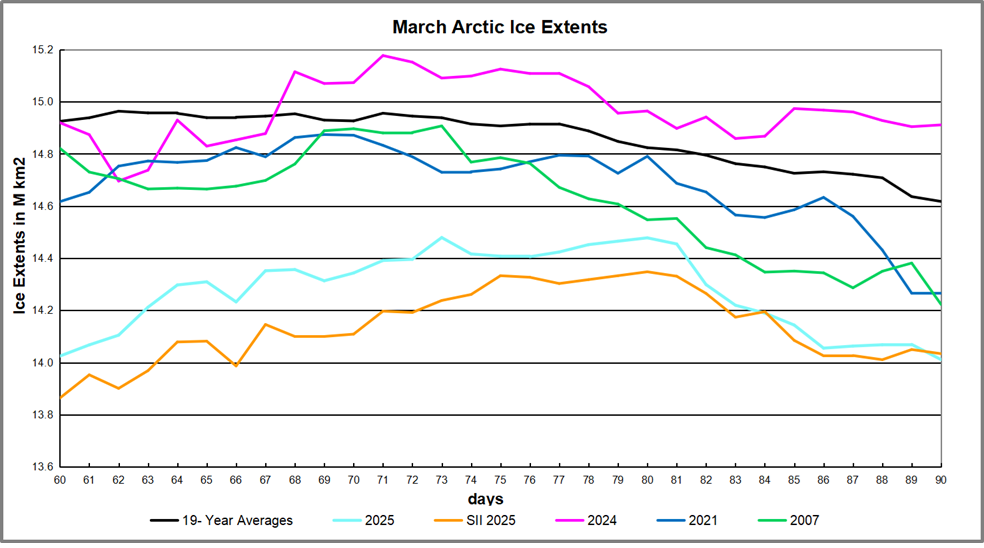
This graph shows variations of ice extents during March, on average and for some recent years along with 2007.  The exceptional extents in 2024 stand out, along with the more typical 2021 and 2007.  On average during March the Arctic loses about 400k km2 of ice.  2025 started March at 14M km2, about 900k km2 in deficit, and ended virtually the same 14M, 600k km2 below average on day 90. SII was slightly lower than MASIE for three weeks, then ended about the same.

The table below shows the distribution of ice extents across the Arctic regions.

Region 2025090 Ave Day 090 2025-Ave. 2007090 2025-2007
 (0) Northern_Hemisphere 14011379 14617665 -606287 14222916 -211537
 (1) Beaufort_Sea 1071001 1070241 760 1069711 1290
 (2) Chukchi_Sea 965989 964237 1752 966006 -17
 (3) East_Siberian_Sea 1087137 1086266 871 1074908 12229
 (4) Laptev_Sea 897845 897098 747 884340 13505
 (5) Kara_Sea 885597 920703 -35106 892157 -6560
 (6) Barents_Sea 450824 664324 -213500 441970 8854
 (7) Greenland_Sea 703578 665146 38433 686312 17266
 (8) Baffin_Bay_Gulf_of_St._Lawrence 1350818 1386137 -35320 1217467 133351
 (9) Canadian_Archipelago 854878 853269 1609 850127 4751
 (10) Hudson_Bay 1260903 1255273 5631 1229995 30908
 (11) Central_Arctic 3237488 3234612 2876 3242236.7 -4749
 (12) Bering_Sea 593465 711340 -117875 814787.71 -221323
 (13) Baltic_Sea 20341 62183 -41842 45896.93 -25556
 (14) Sea_of_Okhotsk 628758 836750 -207992 794657 -165899

Overall 2025 Arctic ice is 4% below the 19 year average and 1% below 2007.  About half of the 606k km2 deficit is in the Pacific basins of Bering and Okhotsk, typically the first to go to open water. The other major case of early melting is in the Atlantic Barents Sea.

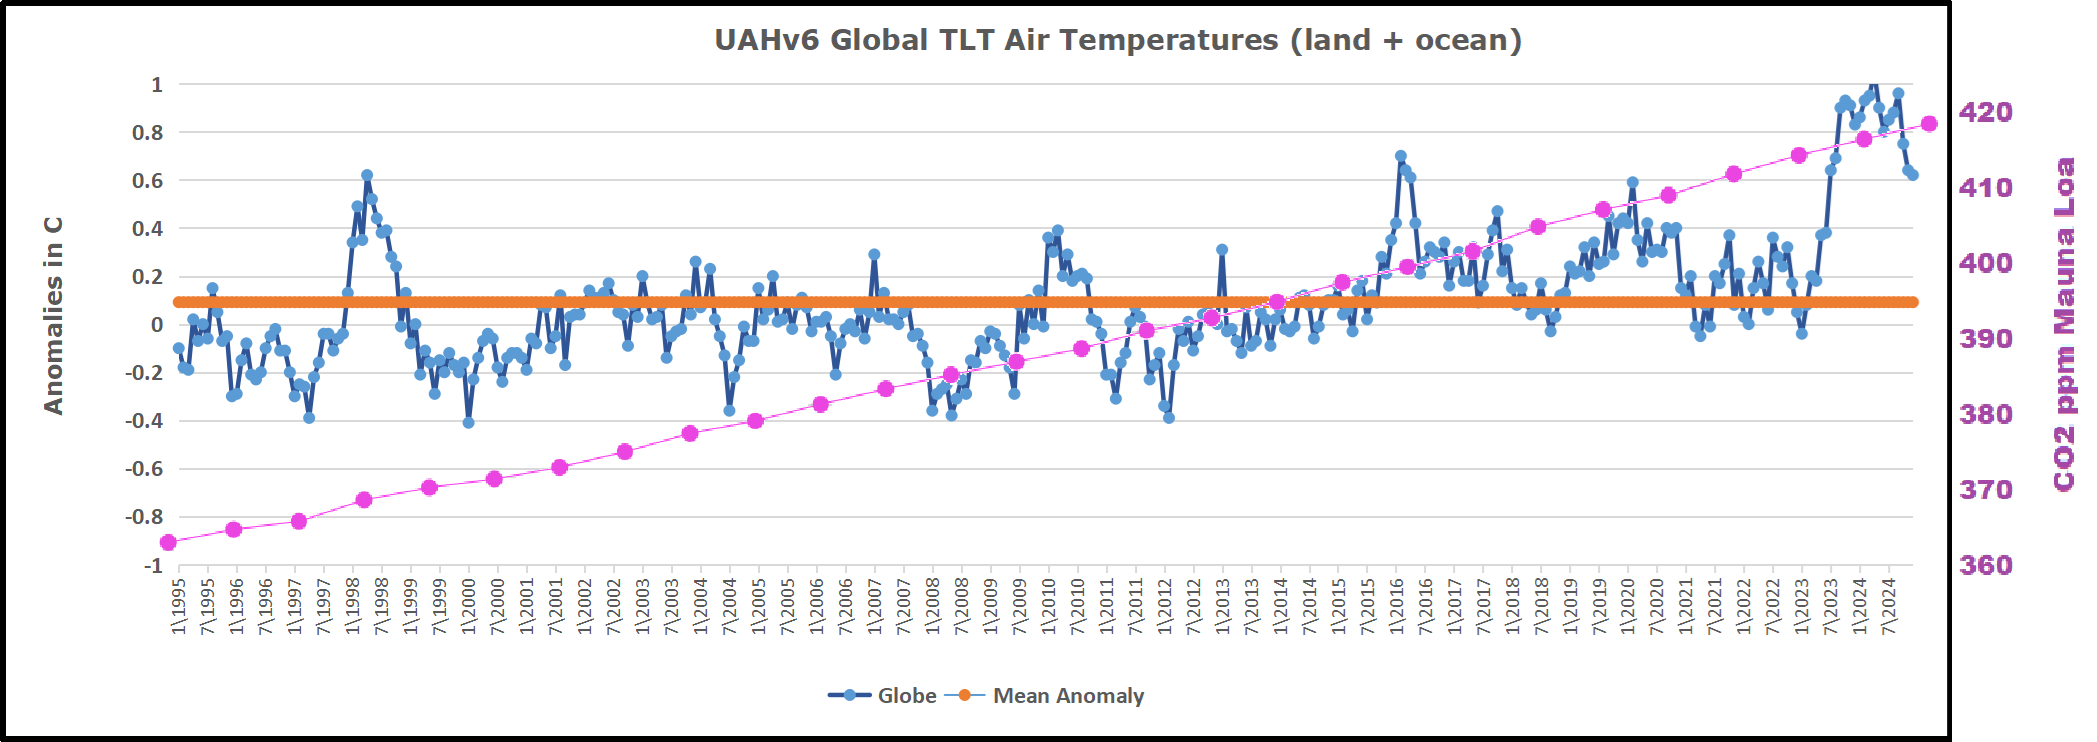
Why is this important?  All the claims of global climate emergency depend on dangerously higher temperatures, lower sea ice, and rising sea levels.  The lack of additional warming prior to 2023 El Nino is documented in a post Ocean Warms, Land Cools UAH February 2025.
 

The lack of acceleration in sea levels along coastlines has been discussed also.  See USCS Warnings of Coastal Flooding

Also, a longer term perspective is informative:
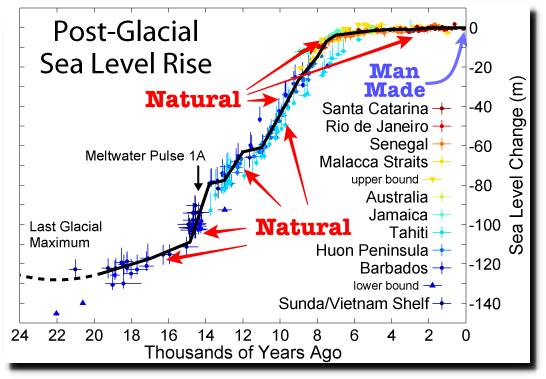
post-glacial_sea_level

via Science Matters

https://ift.tt/luVqM7b

April 1, 2025 at 10:59AM

Wednesday

0 out of 10 based on 0 rating

via JoNova

https://ift.tt/fhnIQSH

April 1, 2025 at 10:03AM

Trump Signs Executive Order: Fahrenheit Now “AmeriTemp”

Washington, D.C. – President Donald J. Trump signed an Executive Order today renaming the Fahrenheit temperature scale “AmeriTemp.” “I did it, folks, it’s official”, straight from the White House.

“Europe’s metric system, total disaster,” Trump said at the signing. “Their climate scientists can’t even pick a name for temperature. Centigrade? Celsius? Who knows? They’re confused, weak. I’m fixing that with AmeriTemp—best name, strong, all-American. Done.”

The order says every federal agency has to use “AmeriTemp” now. Documents, weather reports, everything. It’s still 32 for freezing, 212 for boiling—perfect numbers, tremendous numbers—but now it’s got a name that wins.

“And who’s this Kelvin guy?” Trump added. “Nobody knows him. Some scientist, probably a loser. We don’t need that. AmeriTemp’s for the people, my people, the best people.”

The White House says it’s about leadership. America’s number one, even in temperature. Critics are complaining, like always, but supporters love it. Agencies are moving fast to make it happen. That’s it, folks—AmeriTemp, here to stay.


Discover more from Watts Up With That?

Subscribe to get the latest posts sent to your email.

via Watts Up With That?

https://ift.tt/YfJXamq

April 1, 2025 at 08:01AM

Aboyne No 2 WMO 03080 – Another Foehn Classic

The Met Office publishes these daily “extremes” both on their regular website and also highlights them on their “X” (formerly Twitter) Feed. These bulletins only cover “Climate Reporting” sites appearing on this list which means the readings are included in the compilation of the national historic temperature record. In the case of many Scottish and Welsh stations this means rare weather events untypical of the wider area are included even though they bear no relationship to the overall climate. Aboyne is notorious for rare weather events.

Tim Channon briefly reviewed this WMO site back in 2012 and assessed either as Class 1 or 2. I normally accept his judgement but in this case I feel he unusually overlooked the topography as well the highly variable nature of the surroundings. The image below is from 2010.

57.075875 -2.841039 Met Office CIMO Assessed Class 4 Temperature records from 1/1/1994

This is the site of a gliding club and they generally go for hilly terrain to pick up “thermals” as depicted in the Ordnance survey sheet of the area. The weather station is at 140 metres amsl whilst the nearby triangulation point indicates 256 metres.

The screen though on the flat sits at the very bottom level of a considerable slope and is subject to the Foehn effect. This article details when the national January highest temperature record set at Aboyne was broken by Kinlochewe and adds a handy explainer of the known Foehn effect cause.

Aboyne and other remote Scottish locations such as Achfary and Cassley are regularly picking up national daily highs based solely on these transient effects. The issue is, should these be included in the national records for climate reporting purposes? Obviously the current Met Office feels they should and almost relentlessly gives undue focus to them, however, would anyone actually want to book a winter holiday for warm temperatures based on such relatively unusual events. The Guardian newspaper even ran an article on this issue regarding North Wales some years back rightly suggesting it would not be too smart an idea based on such rare events.

The conditions at Aboyne do not stop with this susceptibility to Foehn winds, the site itself is now very poor indeed. Leaving aside the obvious concern regarding the comings and goings of glider trailers in close proximity to the screen it is now suffering from neglect of the overgrowth. Early Street-view images show a reasonably open site as below.

It is just possible to make out the screen to the right of the pole mounted transformer. As time has moved on though, the lack of vegetation control (whoever’s responsibility that may be) has caused the screen to be almost entirely enclosed in similar style to Plymouth Mountbatten.

This is rather a case of “now you see it, now you don’t” largely dependent on season, airfield activity and roadside vegetation management – not a good site to be taking readings for climate history purposes.

Aboyne is yet another typical example of the 49% of all Met Office weather stations that only make “Class 4 (additional estimated uncertainty added by siting up to 2 °C)” Added to these are the 29% that are ranked “Class 5 (additional estimated uncertainty added by siting up to 5 °C)” and the 8% that are ranked “Class 3 (additional estimated uncertainty added by siting up to 1 °C)” Overall 87% of all Met Office sites are below an acceptable standard for climate reporting despite the statement “Every fraction of a degree temperature increase has a real impact on our lives and our planet. Prof. Celeste Saulo, WMO Secretary-General”

Nevertheless the Met Office can proclaim records, tipping points and thresholds crossed with 100% certainty……because they say so.

via Tallbloke’s Talkshop

https://ift.tt/8UGMhO5

April 1, 2025 at 07:04AM