
Another reason for DOGE.
via CFACT
March 7, 2025 at 08:26AM

The above Google map marks out the distance of less than 3.5 km/2.2 miles between the two alleged CIMO Class 1 Met Office weather stations of Wainfleet No 2 and Gibraltar Point. Both sites claim to be longstanding (“Long-Term”) though are in fact anything but. In the useful handbook by Darrell Huff entitled “How to Lie with Statistics” the author started by demonstrating how selective sampling can distort figures. I will review both sites first and then demonstrate the contrived use of selective sampling that now seems to motivate much of the Met Office current data representation.
WAINFLEET No 2 (automatic reporting site)

53.08840 0.27092 Installed 1/1/1988 Archived Temperature Readings Only From 8/2/1996
Tim Channon reviewed this site in 2012. He judged it only Class 3 based on unnatural and ever changing ground cover. On a personal level I find that an unduly harsh assessment though Tim was a far better judge of the regulations than I. Given that the Met Office frequently uses absurd tape measuring judgements themselves to justify extremely poor sites (i.e. Bingley No 2) I feel it is appropriate to back Tim’s opinion as below.
It is interesting to note that in my original CIMO listing of 2024 supplied under FOI from the Met Office, Wainfleet was shown as Class 2 and only the latest edition upgrades the site to Class 1. Clearly there is either some debate on the standard of the site though a “Human error” default setting cannot be ruled out. Google Streetview imagery adds some extra perspective to help what is often, unfortunately, a potentially subjective interpretation/opinion.

However, one views this site, it is not especially bad and indeed much better than the vast majority of Met Office stations. One issue, though, that CIMO regulations were very much designed to address is, area representation. This raises the question, is Wainfleet typical/representative of a larger environment? It is after all only 3 metres (10 feet) amsl. Coastal sites are essential for meteorology and indeed in being a group of islands they do tend to predominate the UK station listings. The screen is 2 km/1.3 miles from The Wash as in this Ordnance Survey Sheet extract below. Probably quite a breezy spot and subject to frequent haar.

The lack of any contours or spot heights above 5 metres together with the distance from the sea suggest this is fair site for a national weather station and whilst not perfect it is a good one for representing the Lincolnshire lowlands.
GIBRALTAR POINT (manual reporting…..now and again)

53.09551 0.32133 Installed 1/1/1975 Temperature Readings ONLY From 1/2/1987 to 30/6/1989 site re-opened 1/12/2024
Gibraltar Point is shown on the latest updated CIMO listing from the Met Office as Class 1 for temperature and humidity. I sincerely hope that this is a default/human error as the site has only just reopened or it may not have been re-assessed yet. It would require a quite surreal interpretation of the CIMO regulations to categorize this site as anything other than junk Class 5. Unfortunately, who really knows what the Met Office may wish us to believe considering such CIMO assessment data is not publicly available online and required FOI to obtain….a state secret perhaps?
When previously operational for recording temperatures, Gibraltar Point produced very sporadic readings – in the 874 possible days of archived readings 102 were missing. Note, however that these predated Wainfleet’s archived temperature readings and would have been “put to use”.
I have been unable to get any close up imagery of the screen (any help locating an image would be greatly appreciated and put in the comments below if possible ) but I have manged to find an interesting ornithological Youtube clip showing the nature of the site. In Ordnance Survey close up the site can be seen to be almost on the “beach” area of salt marsh (oddly marked as a recycling centre).

This screen is most certainly not representative of a wider area being solely representative of its own unique location. So why reintroduce this site as a “Climate Reporting” Station?
In the past I have noted “trends” in site locations and new openings. Devon has a disproportionately high number of stations for its area to be included in the national historic temperature record and yet another new site at Hollacombe has been added since I wrote that original review. Reviewing Scottish issues I noted a similar trend of over representation in certain (generally warmer) areas with two very new additional Western Isles sites. In both discussions on Derbyshire and Fife the paucity of Screens in cooler locations contrasts sharply with the preponderance of sites in a very small sector of west London conclusively shown to be subject to extreme Urban Heat Island effects. Sites such as Iver are actually quite new.
In addition to the known closure of rural locations over the last half century as locally detailed for example in Kent, there has been the well known expansion of urban areas affecting other long term sites once on the peripheries of built up areas. All this leads to a general uplift in temperature readings. The further addition /reopening of warmer reading (i.e. coastal) sites such as Gibraltar Point can only enhance this warming trend by the selective us of the “sample with the built in bias”.
If this suggestion of deliberate sample/site selection seems like an almost conspiracy bridge too far it is worth considering the selected way in which the Met Office portrays its own data.

The time frame shown above is from 1961 to 1990……….as I deliberately highlighted in the headline image for Wainfleet……………Temperature Readings Only From 8/2/1996. It is one thing for the Met Office to claim that only data from well correlated sites are used going forward BUT what data was being used to compile averages for a 30 year period that was 6 years prior to any readings at all from Wainfleet? Were they, in part using poorly read data from a poorly sited station just a few kilometres away on the salt marsh that represents nowhere other than itself at Gibraltar point? When challenged to provide the details of the contributing sites for the Met Office stations at both Folkestone and Dover under FOI, I was advised
” I can advise you that the Met Office is unable to supply specific details of the observing sites requested, as this is not recorded information.”
If the Met Office in 2024 was unable to supply the data used to calculate averages for sites up to just 4 years previous i.e. 2020, is the general public expected to believe any claims the Met Office makes regarding the validity of data used between 1961 and 1990 prior even to the existence of the recording site that it is attributed to. If anyone wishes to ask the Met Office to justify the above data by supplying details of the sites used, they are welcome to try. However, I can guarantee not only that you will not get a definitive answer but also that they simply do not know themselves. This “peer reviewed” system is obviously nothing more than data manipulation for non-scientific purposes.
via Tallbloke’s Talkshop
March 7, 2025 at 08:07AM
The European Union is marching ahead with a sweeping expansion of its carbon market, a move that will push home heating and transportation costs to punishing new heights. Under the guise of “cutting emissions,” EU policymakers are implementing a system that will make energy unaffordable for millions—especially those who can least afford it.
According to an analysis by BloombergNEF, the new emissions trading system, set to take effect in 2027, could push the price of carbon dioxide to €149 per metric ton by 2029—more than double current levels. The direct consequence? Heating bills may rise by as much as 41%, and transportation costs could jump 27%. This isn’t just a minor inconvenience; it’s a financial wrecking ball aimed squarely at households and small businesses across Europe.
For years, politicians and activists have insisted that draconian carbon policies will help “save the planet.” What they fail to acknowledge is who actually pays the price.
And what does the EU offer as a solution? “Green alternatives.” Heat pumps, electric cars, and home renovations—all of which require substantial upfront investments that the average citizen cannot afford.
Even some EU lawmakers are now realizing the scale of the disaster they’ve created, with calls to delay the rollout of this new carbon tax. But as history has shown, once bureaucracy sets a policy in motion, reversing course is nearly impossible.
Rather than learning from past failures—such as Germany’s disastrous energy transition, which led to record-high electricity prices—EU leaders are doubling down on policies that make daily life harder for ordinary Europeans.
If this policy isn’t helping citizens, who is it helping? The answer is the same as always:
At its core, this is not about saving the planet—it’s about control. The EU’s carbon market expansion is a stealth tax on survival, designed to force people into financial hardship under the pretext of climate action.
For millions of Europeans, the coming years will bring a harsh choice: pay up or freeze.
H/T Steve Milloy
Subscribe to get the latest posts sent to your email.
via Watts Up With That?
March 7, 2025 at 08:07AM
By Paul Homewood
After what seems to have been three months of weather and flood warnings day after day, it turns out that the winter in this country was not unusual in the least. It was cooler than in was a hundred years ago in 1925, and actually drier than average:
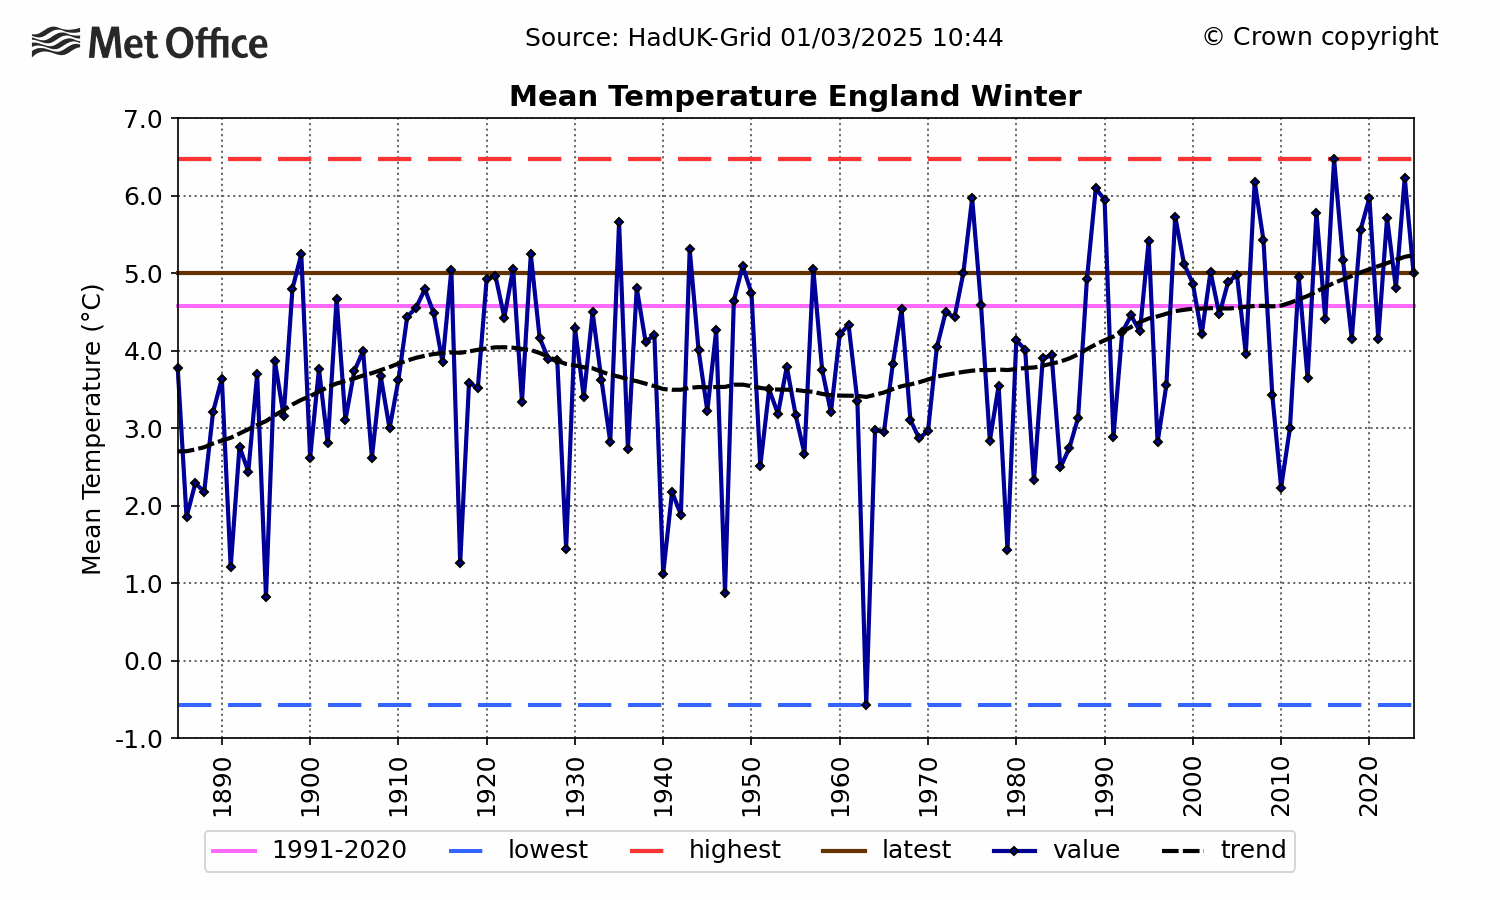
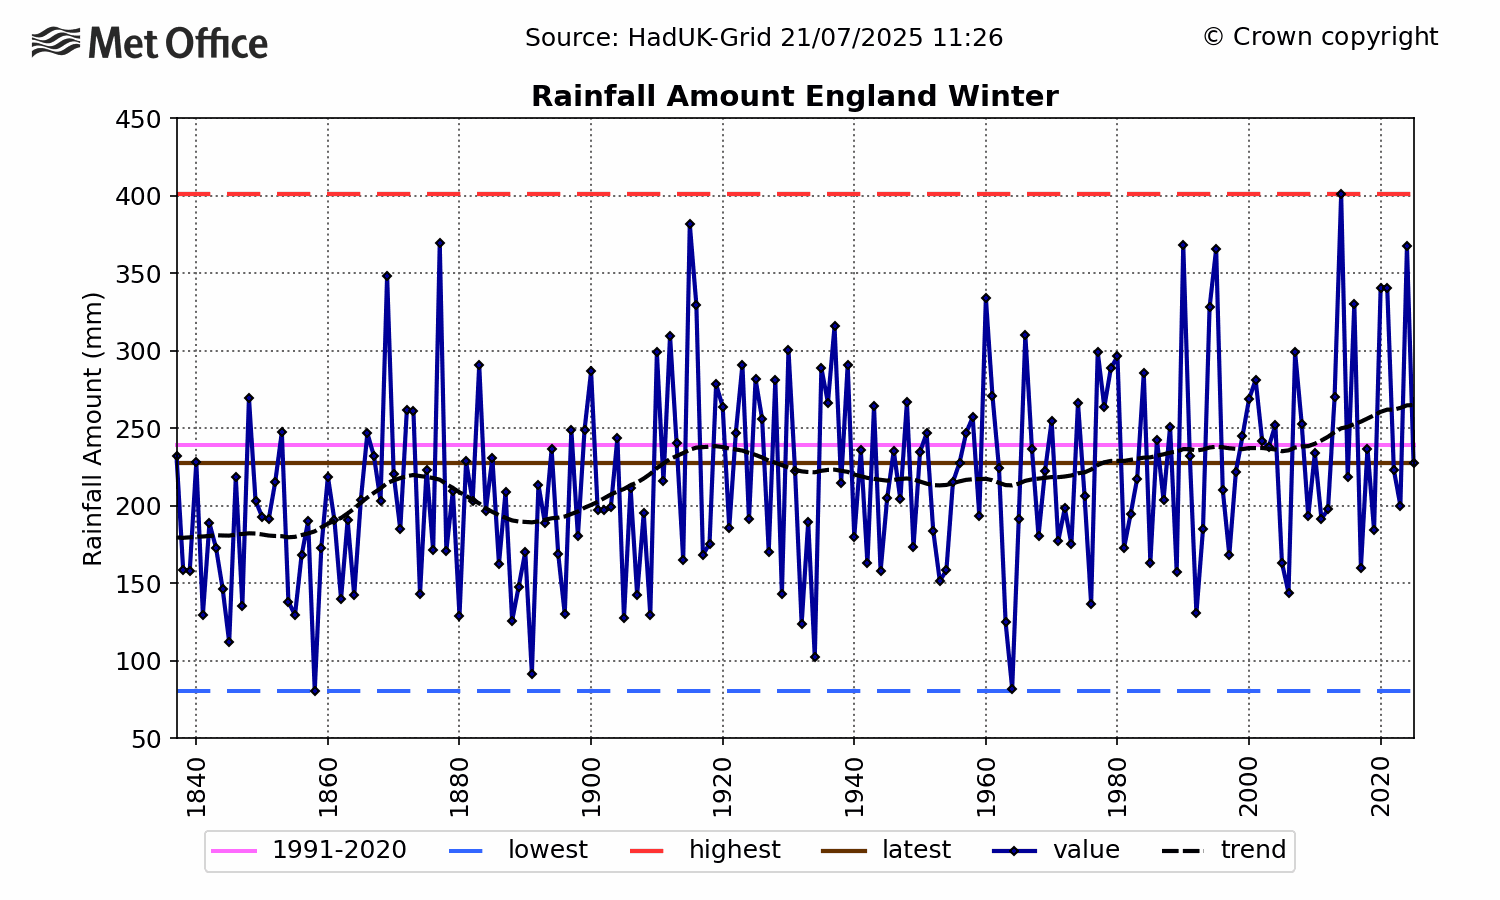
The Met Office have an obsession with what the weather was like 150 years ago, which has absolutely no relevance whatsoever with out lives now.
Yet according to them, climate is the average of 30 years weather, so what do the 30 year trends look like?

https://www.metoffice.gov.uk/pub/data/weather/uk/climate/datasets/Tmean/date/England.txt
There is no obvious evidence of winters becoming warmer. Merely an absence of exceptionally cold ones in the last decade – winters like 1990/91, 1995/96, 2009/10 and 2010/11.
And the precipitation data disproves the routine claims that winters are getting wetter.

https://www.metoffice.gov.uk/pub/data/weather/uk/climate/datasets/Rainfall/date/England.txt
via NOT A LOT OF PEOPLE KNOW THAT
March 7, 2025 at 05:06AM

