It’s an absolute disgrace: the Climate United Fund, a shady nonprofit slapped together in November 2022, somehow wangled a jaw-dropping $7 billion grant from the Biden administration’s climate slush fund in April 2024—the largest nonprofit grant in U.S. history. This money, ripped from taxpayers’ pockets, was supposed to fuel clean energy projects under the $27 billion Greenhouse Gas Reduction Fund (GGRF) of the Inflation Reduction Act. Instead, it’s become a glaring symbol of political cronyism, grift, and utter mismanagement, leaving Americans furious and demanding answers.
This so-called “popup nonprofit shell” started with a paltry $547,000 in revenue in 2022. By 2023, it had burned through $451,000 in just two months, with a whopping $323,000 of that mysteriously unaccounted for in its tax returns. Where did it go? No one knows—because the fund’s filings are a black hole of transparency, offering no details on officer pay or project plans, which any legitimate nonprofit would be required to disclose. Yet, Kamala Harris and EPA Chief Michael Regan handed over $7 billion for vague solar projects in Idaho, Arkansas, and Oregon—totaling a measly $50 million, a drop in the bucket compared to the billions entrusted to them. It’s an insult to every taxpayer who’s been left in the dark about where their hard-earned money is disappearing to.
The fund’s ties to Democratic insiders make this scandal even more infuriating. Its CEO, Beth Bafford, is a former Obama aide and campaign operative, and its board includes heavyweights like California’s Democratic Party Chairman Phil Angelides, Obama’s Transportation Secretary Anthony Foxx, and Stacey Abrams, whose linked group, Power Forward Communities, quietly pocketed some of the cash. This isn’t climate action—it’s a taxpayer-funded piggy bank for political pals, a blatant case of favoritism that reeks of corruption.
And it doesn’t stop there. This outrage is just one piece of a broader fiasco with the GGRF, which rushed $20 billion to eight newly minted environmental nonprofits after Biden’s 2024 election loss but before Trump took office in January 2025. Reports from the New York Post and Project Veritas expose how Biden officials scrambled to dump the money, with an EPA insider caught on video calling it “throwing gold bars off the Titanic.” Now, Trump’s EPA head, Lee Zeldin, has rightly frozen access to that $20 billion held by Citibank, citing rampant fraud, waste, abuse, and conflicts of interest. The DOJ and FBI are digging in, but it’s maddening that no hard evidence of criminality has surfaced yet. It’s a betrayal of public trust and a slap in the face to every American worried about both the climate and their tax dollars.
As investigations grind on and lawsuits pile up over the frozen funds, the Climate United Fund scandal screams for justice. Federal government spending needs ironclad transparency and accountability, not backroom deals for political cronies. This mess is an outrage that demands answers.
Discover more from Watts Up With That?
Subscribe to get the latest posts sent to your email.
You may recall that CCN is a far-left lobby group for the climate agenda. In their own words:
It is a global journalism collaboration that supports, convenes, and trains journalists and newsrooms to produce rigorous climate coverage that engages audiences.
Co-founded in 2019 by Columbia Journalism Review and The Nation magazine in association with the Guardian and WNYC, CCNow invites journalists everywhere to transform how our profession covers the defining story of our time. With hundreds of partner news outlets from over 60 countries reaching billions of people, CCNow helps journalists produce more informative and engaging coverage of the climate crisis and its potential solutions.
This week they have been complaining about Trump wanting to make some efficiency savings in the bloated NOAA organisation:
A Deadly Assault On Weather Reporting “There will be people who die.” That stark warning came last week from Daniel Swain, a climate scientist at the University of California, Los Angeles, after US president Donald Trump sought to fire more than 800 employees of NOAA, the National Oceanic and Atmospheric Administration. As a former TV weathercaster myself, I know the same worry is shared throughout the professional meteorological community.
NOAA houses the National Weather Service, which provides the data and analysis that informs virtually all of the weather forecasts Americans receive, whether via TV or radio broadcasts or their cell phone apps. Emergency alerts to coastal residents as a hurricane approaches? Warnings to farmers about an impending flood or heat wave? A winter weather advisory for mountain-bound ski vacationers? These and countless other life-saving services are at risk if Trump succeeds with his order, which legal experts say violates US law, according to reporting by Inside Climate News. “Going into the severe weather and hurricane season, this cannot be good,” Al Roker, the chief meteorologist for NBC News, wrote in a social media post responding to the NOAA layoffs. The public deserves to know what’s at stake. To aid coverage of this developing story, it’s worth noting that NOAA is one of the best investments of taxpayer dollars on record. The National Weather Service’s annual budget of roughly $1.4 billion delivers an economic return in excess of $100 billion, according to one recent study. That’s not surprising, considering how directly the weather affects so much of the economy, including agriculture, air transportation, fishing, tourism, utilities, and commerce. To highlight this angle, reporters can explore the potential losses that companies, universities, and nonprofits may experience with further disruptions to the NOAA workforce. Think of airlines unable to steer their planes safely away from storms and farmers left unaware of an upcoming frost that threatens their entire season’s harvest. Reporting can also point out that providing critical weather and climate information is just one part of NOAA’s work. Eat seafood? NOAA ensures that fish and shellfish from across the world are safe to consume. Enjoy a beach day? NOAA protects you from a number of marine impacts, including tsunamis (recent cuts included one scientist from this team). NOAA’s reach even extends beyond our planet, monitoring solar activity and “space weather” that disrupts global communications. As climate change drives increasingly volatile and destructive extreme weather across the US and around the world, a reliable understanding of the climate-weather connection is critical to saving lives and ensuring that society can continue to function. Plain-spoken journalism can make clear the consequences if this attempt to cripple NOAA succeeds: People will die. — David Dickson CCNow’s TV Engagement Coordinator
Oh dear, poor NOAA!
What these crooks don’t tell you is that these 800 employees facing the boot are just a tiny fraction of the 12,000 employed at NOAA.
Are they really saying that there is no room for efficiency savings?
And if they are worried about the effect on weather forecasting, maybe they should trim some of the fat in the climate change sections, which now dominate all other activities. Just as in our UK Met Office, they are the tail wagging the dog.
Just as in the rest of the public sector, both in the UK and US, NOAA employees believe they are irreplaceable. And as here, many are still “working” from home – 500 have already accepted the government’s “fork in the road deal”, which pays them to carry on working at home till September and then leave.
The latest 800 are merely probationary employees, so are hardly vital to NOAA’s operation.
CCN’s protestations really are proof that the climate change gravy train is all about money and ripping off taxpayers.
When it comes to extreme weather, cyclones are top of my list. The most extreme cyclone to hit Queensland, Tropical Cyclone Mahina, was arguably the world’s most intense with a central pressure recorded at 880 hectopascals, a 12-metre storm surge, and 300 kilometre per hour winds. It was named, by Queensland government meteorologist, Clement Wragge. That was in 1899 – 126 years ago.
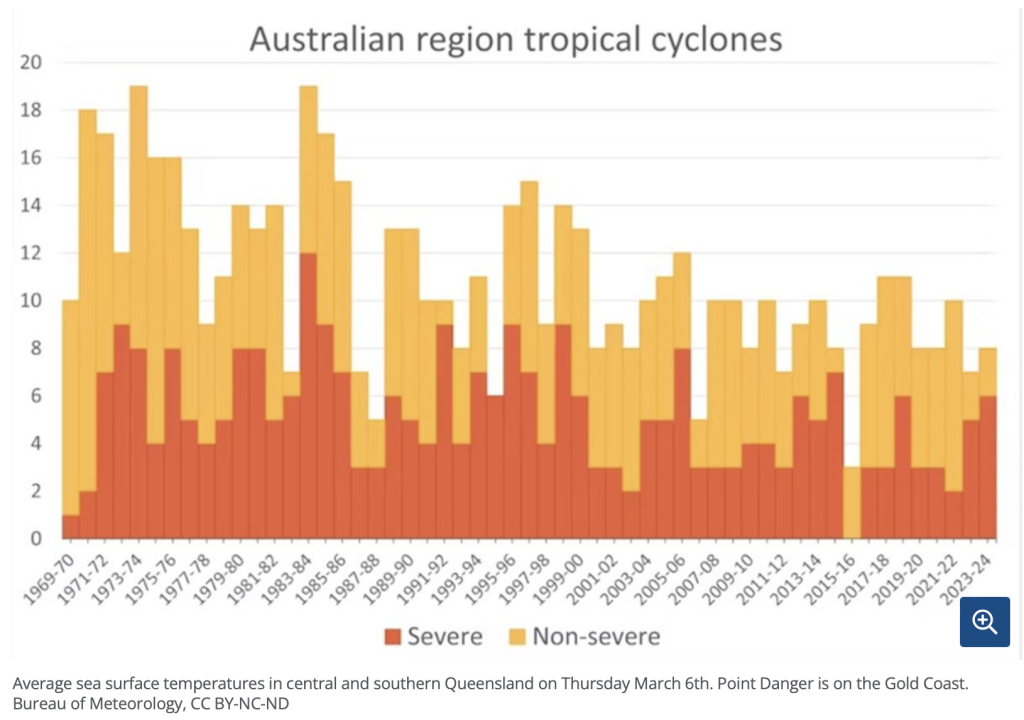
Contrary to popular narratives cyclones are not becoming more intense, and their frequency is waning. CSIRO research has confirmed a statistically significant downward trend in the annual number of tropical cyclones in the Australian region over the period extending from 1981/82 to 2017/18 that is during the satellite period. The intensity of these cyclones is also in decline.
The number and intensity of cyclones crossing the Australian mainland is in decline, but only considering the last 50 years.
This is perhaps some comfort to those watching the approach of Tropical Cyclone Alfred in southeast Queensland and northeast New South Wales. TC Alfred has a central pressure of 978 hectopascals (1316 UTC 6th March 2025) and is sustaining winds near its centre of 95 kilometres per hour with wind gusts to 130 kilometres per hour already being experienced along the coast to Lennox Heads.
TC Alfred will pack a bad punch. But southeast Queensland and northern New South Wales have sustained such low pressure and strong winds before. The best idea is to make sure you have a stash of water, and also a gas cylinder. There is nothing quite like being able to make a cup of tea on the camping stove when the mains electricity and water is not working.
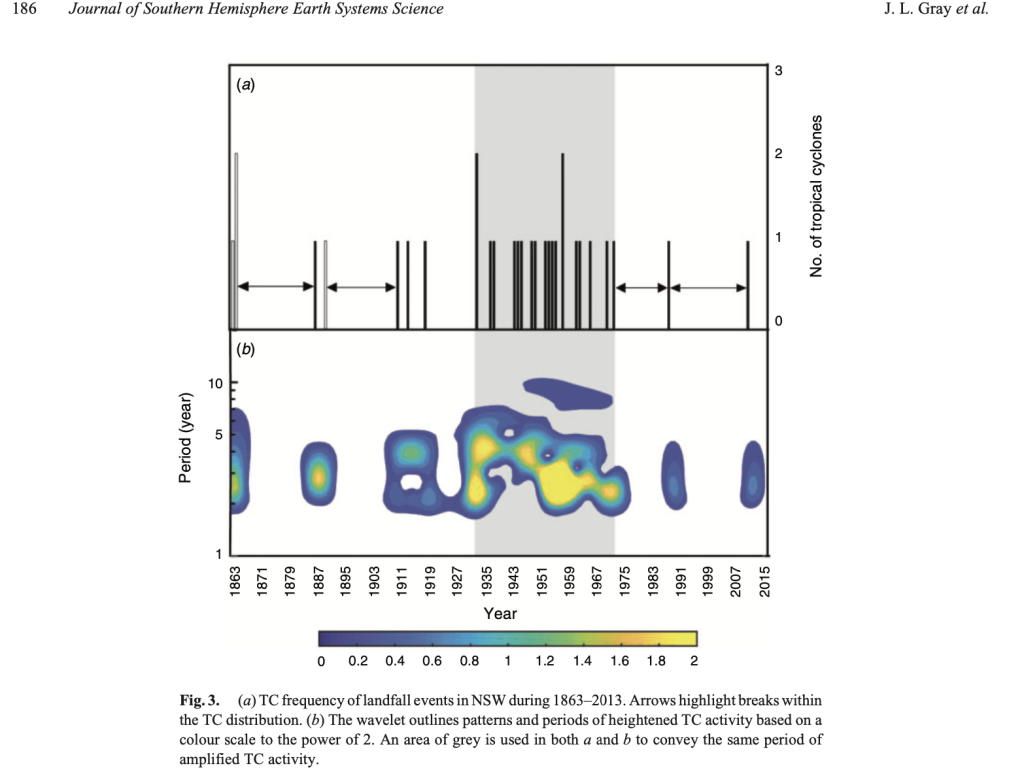
In fact, during the period 1935 to 1974 every other year there was a cyclone making landfall as far south as Brisbane and into New South Wales. There were two cyclones making landfall as far south as New South Wales in 1934: on January 30th and then again on February 19th. Two cyclones also made landfall in New South Wales in 1959: TC Beatrice and TC Connie. These four cyclones are listed in a journal article by J.L. Gray et al. entitled ‘On the Recent Hiatus of Tropical Cyclones Landfalling in NSW, Australia’ published in the Journal of Southern Hemisphere Earth Systems Science in 2020.
The climate follows cycles, and it is the case that there has been a hiatus of tropical cyclones making landfall near Brisbane.
There was a period of some decades during the first half of the twentieth century when cyclones were given numbers rather than names. That was immediately following the formation of the Australian Bureau of Meteorology and the appointment of Henry A. Hunt as its founding director on 1 January 1907.
Headquartered in Melbourne, the first thing Hunt did was focus on consolidating ‘the disparate’ state services. In fact, he immediately sacked Clement Wragge and some other first-class meteorologists with attitudes and also discontinued Wragge’s naming of cyclones.
Wragge was ahead of his time. Hunt did recognise the value of the white louvred boxes, now known as Stevenson screens, that Wragge began using in some parts of Queensland a good two decades before they were later installed, under Hunt’s directives in New South Wales and Victoria beginning only in 1908. So, a reliable temperature record exists back to the late 1880s for parts of Queensland, a good twenty years before the southern states.
We know from the work of Clement Wragge, still denied by many particularly in Melbourne, that not only were the cyclones severe back in the 1890s it was also very hot sometimes.
It is a large system, a large cyclone, right now sitting just off shore from Brisbane.It is definitely time to put the surf boards and paddle boards away.
Mannington Hall (above) 52.88419 1.17939 Met Office CIMO Assessed Class 5 Installed 11/12/1998
Houghton Hall 52.82413 0.65241 Met Office CIMO assessed Class 4 Installed 1/12/2001
The above two sites are both located in north Norfolk, installed just over 3 years apart and are under 35km/22 miles from each other at similar elevations. They are both within the grounds of large stately homes with both having highly modified micro climates in walled kitchen gardens. The weather stations are not installed within the main parts of those gardens but both lie within climate modified areas. They should record well correlated temperatures – though how readings are “interpreted” yet again indicates the Met Office’s flawed methodology.
To review each in turn before making comparisons, Mannington Hall sits to the side of the main house and gardens separated by a band of trees and a vehicle pathway to a “Glamping” field. It is judged class 5 being subject to heavy shade from the trees to the east and south east for most of the day. Not only are motor vehicles able to pass close alongside the screen there are several historic images suggesting parked vehicles. However, the likelihood of compromising interventions distorting readings is best portrayed by a still from this promotional video
The proximity to both tents and activity to the screen calls into question potential inaccuracy of readings and stills from them such as this below indicate meteorologically uncontrolled extraneous heat sources are likely common.
An important point is that this is a manually reporting site with readings taken only once daily at 09:00 as opposed to automatic units broadcasting hourly readings. It is entirely down to the daily observer noting any on site issues rather than unusual temperature spikes being visible remotely and raising questions. And here lies a significant problem with so many of these sites – in the last archived year, 2023, Mannington Hall was only read 191 times out of a possible 365. In 2022 it was only slightly better at 326. More on this later in comparisons.
Houghton Hall is a very large property with extensive ornate gardens. The screen is much closer to the formal gardens and whilst outside the walls is still within the modified climate area with tree shielding of winds, close greenhouses, hard-standing and with unnatural ground cover. General agricultural activity supporting the gardens is evident all around the area. The Met Office feels this is a better site than Mannington but still only Class 4. On original installation it was manually recording and shared similar intermittency of readings to Mannington with numerous completely missing days as well days of only partial readings (i.e. Max but no Min temperatures and vice versa). The archive remarks show entries like these below that even include thermometer breakage:
The Met Office chose to automate this site from 2010 and now readings are both much more reliable and archived as twice daily figures.
The recent data comparison between these two Halls demonstrates the quite bizarre statistical concoctions that the Met Office derives from two sets of incomparable data. Under Freedom of Information Act the Met office supplied temperature reading frequency and annual average temperatures for every weather station in England for years 2021 to 2023. All meteorology would state that Mannington and Houghton Halls would produce almost identical annual averages.
With both stations having a 100% readings record the annualised average of 9.8°C. is, as expected, in perfect parity. However in 2022 reading frequency at Mannington Hall was reduced to only 326 though Houghton Hall must have experienced some transmission issues reducing readings to 349.
Given that missing readings could well be in a specific time of year rather than evenly spread, deriving an annual “mean daily air temperature” seems somewhat unlikely to provide a meaningful figure but with both sites missing readings the divergence was only 0.3°C. However, the 2023 situation was as follows:
With only 191 observations taken at Mannington Hall what possible statistical reasoning is the Met Office following to derive an “annual” average from barely more than half a year’s readings? Did nobody at the Met Office stop to think that the derived figure would likely be 100% meaningless? The sole reason behind the sudden “anthropogenic” annual increase of 1.3°C at Mannington Hall is the absence of readings at cooler times of year. It is so painfully simple to see that this should not require further explanation but just to make the point here is just one section of the archived data.
Surely it is not difficult to see that there were no readings at all between 1/3/2023 and 31/5/2023 and the typical annotations of “N/A” even on days when readings were dated should ring major alarm bells. How accurately taken are the few readings that are actually noted?
It is blatantly obvious that the function of deriving a figure (any figure) to fill “annual average” is more important than the figure having any remote vestige of credibility. Alternatively has AGW suddenly “kicked in” between the Halls? It is worth pausing to consider that these are official data which the Met Office was “forced” to release. What possible confidence can anyone reading these have in the Met Office’s statistical methodology?
Taking this a step further the public has been assured by the Met Office that its fictional non existent weather stations have their “data” provided by high quality “peer reviewed” practises using figures from well correlated sites. {talkshop comment: how more well correlated is it possible to get than Mannington and Houghton Halls?} Putting this to the test, what are the “Location specific, long term averages” a.k.a formerly “climate averages” for these two Halls?
Firstly the quoted “Climate Stations” at Coltishall, Morley St Botolph and Hemsby are all long closed sites whose artificially created ongoing averages will be from “figures” partly derived from demonstrably spurious Mannington Hall readings amongst unspecified others. Secondly why is the extremely long term site at Cromer (with readings from 1884 and the nearest at just 7 miles distant) completely excluded? Are Long-Term figures only long term when it suits the Met office and Location-specific similarly flexible enough to exclude the nearest one?
In Houghton Hall’s case at least all the quoted comparable “Climate Stations” actually do exist, however, one only has to consult a map to consider the differences. Is the extremely coastal Wainfleet no 2 (which only predates Houghton Hall by a few years) really climatologically comparative being in a different county with The Wash in between? Below is the latest real time update from Met Office automatic sites at weatherobs at 16:00 6/3/2025.
Wainfleet is just south of Skegness and reading just 12°C whilst inland Houghton Hall (in common with all inland sites nearby) is reading 16°C or even 17°C. The term “comparable” seems remarkably inappropriate. Again why use Wainfleet when Cromer is actually marginally nearer?
The comparison of the Halls shows yet more low grade sites but more importantly incredibly poor use of statistical representations that are effectively useless. My “Peer Review” process rejecta any use of such statistics.