Fair Isle WMO 03008 – An example of Met Office misinterpretations and meaningless machinations.

59.52607  -1.62959 Met Office CIMO Assessed formerly Class 1 but now Class 4 Installed 1/1/1974

The Met Office has a web page relating to “Weather Observation site classification” which states “The WMO Siting Classification for Surface Observing Stations on Land was formally introduced from 2014, enabling us to make broad comparisons of our weather and climate stations with those around the world. These WMO classifications focus on the exposure of an observed element at a site, with a Class 1 assessment being the highest standard and Class 5 the lowest.” It goes on to claim the higher standards are difficult to achieve in the UK. Despite this as can be seen from the CIMO list supplied to me in 2024 under Freedom of Information request, Fair Isle weather station managed to achieve Class 1…..or did it?

Fair Isle is the remotest weather station site in the UK being over 50 miles from the nearest others of Lerwick and Kirkwall. The island has a population of just 65 and lifestyles in such small communities are completely different to those of the vast majority of UK residents. The local primary school, for example, has as many staff as pupils while secondary school children are educated as boarders on Mainland, Shetland.

The weather station is manually reporting and operated by the National Trust for Scotland who also administer most of the island. {Image from their website including observer}

How representative this site can be of anywhere other than the unique 768 ha of Fair Isle for the purposes of historic temperature recording is questionable. So what CIMO rating would the Met Office assess this location as? In reviewing the Hastings site following receipt of the Met Office CIMO assessments, I discovered that the Met Office records system automatically defaults to Class 1 and “Excellent” (the Met Office’s own unique assessment system) unless manually overridden. Hastings was duly corrected to Class 4 following my challenge as was also Edenbridge station.

The CIMO listing of 2024 showed Fair Isle as Class 1 but now on the recently obtained 2025 list (to be published shortly) it is shown as Class 4.

Such a dramatic change can only indicate a previous “default error”. How many of these “errors” have the Met Office made? In just this review alone I have mentioned three. I have formally queried a fourth, the Class 1 rating of Cassley, which is also clearly not Class 1 having the entirety of a hydro electric power station within 100 metres. Is Cassley, like Fair Isle, so remote it is only rarely visited and details inadequately checked? If not, perfection will be assumed. The latest listing shows several other similarly improbable alterations indicating a lack of suitable oversight by the Met Office which I will detail in an updated list.

Going back to the specifics of Fair Isle, the site administrators – the National Trust for Scotland (NTS) – in common with the National trust for England – seem to consider themselves experts in everything including, of course, “Climate Science”. In their article on Fair Isle weather station they produce what can only best be described as grossly misleading nonsense. No credible science body ever compares data over differing time scales (1974 to 2000 with 2001 to 2023) but “Dave Wheeler ” does – so that’s okay then?

Surely if the NTS want to comment on the readings for Fair Isle they could simply use the data from the alleged experts ( the Met Office) rather than their own local concoctions. Perhaps these National Trusts should stick to their own “day job” rather than pontificate outside their own remit. The English authority’s blaming a building collapse at Malham Tarn on “climate change” and causing the closure of the weather station was matched by the Scottish variants forcing the weather station relocation through lack of overgrowth clearance at Poolewe. Or is it the case that they do not trust the Met office?

The data produced by Fair Isle weather station is no doubt accurate and suitable for immediate weather forecasting. However, the use of such a tiny outpost with unique conditions for inclusion in the historic temperature record and interpretation of any trends is highly dubious.

via Tallbloke’s Talkshop

https://ift.tt/bhH9Ej5

February 18, 2025 at 12:52PM

Conflicts of Interest in Climate Science: A Systemic Blind Spot

Introduction

The field of climate science has long been presented as an objective, data-driven discipline, immune to the biases and financial conflicts that plague other scientific domains. However, a recent preprint study by Jessica Weinkle et al, Conflicts of Interest, Funding Support, and Author Affiliation in Peer-Reviewed Research on the Relationship between Climate Change and Geophysical Characteristics of Hurricanes, challenges this assumption, shedding light on an alarming lack of conflict of interest (COI) disclosures in climate research, particularly in studies linking hurricanes to climate change​. She also has an excellent write up of the study on her Substack, Conflicted.

The study’s findings reveal a disturbing trend: not a single one of the 331 authors analyzed disclosed any financial or non-financial conflicts of interest​. Moreover, the research found that funding from non-governmental organizations (NGOs) was a significant predictor of studies reporting a positive association between climate change and hurricane behavior​.

This revelation should prompt serious scrutiny of the integrity of climate science, particularly in areas with high policy relevance. Given the influence of climate research on regulatory frameworks, financial markets, insurance policies, and public perception, it is imperative that the same rigorous COI disclosure standards applied in other scientific fields be enforced here.

The Study: A Long-Overdue Investigation

Weinkle and colleagues analyzed 82 peer-reviewed studies on the relationship between climate change and hurricanes published between 1994 and 2023. Their objective was to determine whether author affiliations, research funding, and COI disclosures were associated with study outcomes or policy recommendations​.

Their key findings include:

  • NGO funding was a significant predictor of studies reporting a positive association between climate change and hurricanes (odds ratio = 8.72, p-value = 0.03).
  • Studies published in 2016 or later were more likely to report a climate change-hurricane link (odds ratio = 9.19, p-value = 0.002).
  • Not a single author out of 331 disclosed a COI, a stark contrast to biomedical research, where COI disclosure rates range from 17% to 33%​.
  • First authors with government affiliations were more likely to make policy recommendations (odds ratio = 9.6, p-value = 0.01).

These findings suggest a profound bias in climate change research, one that aligns suspiciously well with the interests of NGOs and policymakers rather than an objective pursuit of scientific truth.

The Role of NGO Funding: A Clear Bias

One of the study’s most critical findings is that NGO funding was a strong predictor of studies concluding that climate change influences hurricanes​. This should raise immediate red flags, considering that NGOs often have clear political and financial incentives to promote catastrophic climate narratives.

Environmental NGOs and progressive philanthropic organizations have become major players in climate policy and research funding. Unlike industry funding, which is typically scrutinized for bias, NGO funding operates under an assumption of moral superiority. Yet, as Weinkle et al. demonstrate, this funding significantly correlates with specific research outcomes—suggesting a funding effect similar to the well-documented bias introduced by pharmaceutical industry sponsorship in biomedical research​.

In other words, just as pharmaceutical companies fund studies likely to support their drugs, climate-focused NGOs appear to fund research that supports their policy agendas. The absence of scrutiny here is a glaring double standard.

The Stunning Absence of COI Disclosures

Perhaps the most shocking finding of the study is that none of the 331 authors disclosed any conflicts of interest​. This is practically unheard of in other fields where COI disclosures are mandatory. For comparison:

  • In biomedical research, approximately 22.9% of articles disclose COIs​.
  • In public health, COI disclosure rates range from 17% to 33%​.
  • In contrast, climate science appears to exist in a COI-free utopia, despite clear financial and political entanglements.

Weinkle et al. found multiple instances of undeclared COIs, including:

  • Authors holding relevant patents and advising climate risk analytics and financial firms.
  • Authors serving as advisors for climate litigation.
  • Authors affiliated with insurance industry associations.
  • Authors collaborating with advocacy organizations to develop research for climate litigation​.

These are classic COIs that should have been disclosed under any reasonable scientific ethics standard.

Policy Implications: Manipulating the Narrative

Beyond individual researcher biases, the study highlights a broader institutional issue: government-affiliated authors were far more likely to make policy recommendations​. This finding challenges the perception that government-funded science is inherently neutral.

Climate research heavily influences public policy, and recommendations based on biased or financially motivated research can have immense societal costs. Policies driven by flawed or selective research include:

  • Carbon taxes and energy restrictions based on exaggerated climate risk projections.
  • Legal frameworks that enable lawsuits against energy companies.
  • Increased insurance premiums based on inflated hurricane risk models.

If climate research is influenced by undisclosed COIs, as this study suggests, then many of these policies are based on potentially compromised data.

The Urgent Need for Reform

The Weinkle study highlights an urgent need for climate science to adopt rigorous COI disclosure policies comparable to those in biomedical research. The International Committee of Medical Journal Editors (ICMJE) provides a solid template for financial and non-financial COI disclosures, which climate journals should implement immediately​.

Further recommendations include:

  1. Mandatory COI disclosures: Climate science journals must require authors to disclose all financial and non-financial COIs, with clear definitions of what constitutes a conflict.
  2. Independent COI audits: An independent entity should oversee COI compliance in climate research to ensure transparency.
  3. Centralized COI database: Similar to the U.S. government’s Open Payments database for physicians, a centralized system should track COIs in climate science.
  4. Balanced funding sources: Governments and private entities should ensure diverse funding sources to prevent any single ideological influence.

If climate scientists genuinely care about maintaining public trust, they should welcome these changes.

Time to Clean House

The Weinkle et al. study is a wake-up call for anyone who still believes climate science is an objective, bias-free discipline. The overwhelming correlation between NGO funding and climate change-hurricane research outcomes, coupled with the complete absence of COI disclosures, exposes a deeply entrenched problem​.

The fact that not a single author among 331 disclosed a conflict of interest should be viewed as a scientific scandal. If such a pattern were observed in pharmaceutical or medical research, there would be widespread public outcry and immediate reforms. Yet, in climate science, this level of opacity is tolerated—perhaps because it serves the interests of powerful political and financial actors.

At the very least, this study proves that climate science is not above bias. The question is: Will the scientific community acknowledge and correct these issues, or will it continue to operate under a veil of selective transparency?


Discover more from Watts Up With That?

Subscribe to get the latest posts sent to your email.

via Watts Up With That?

https://ift.tt/z42RDSu

February 18, 2025 at 12:05PM

Oceans Rapidly Cooling UAH January 2025

The post below updates the UAH record of air temperatures over land and ocean. Each month and year exposes again the growing disconnect between the real world and the Zero Carbon zealots.  It is as though the anti-hydrocarbon band wagon hopes to drown out the data contradicting their justification for the Great Energy Transition.  Yes, there was warming from an El Nino buildup coincidental with North Atlantic warming, but no basis to blame it on CO2.  

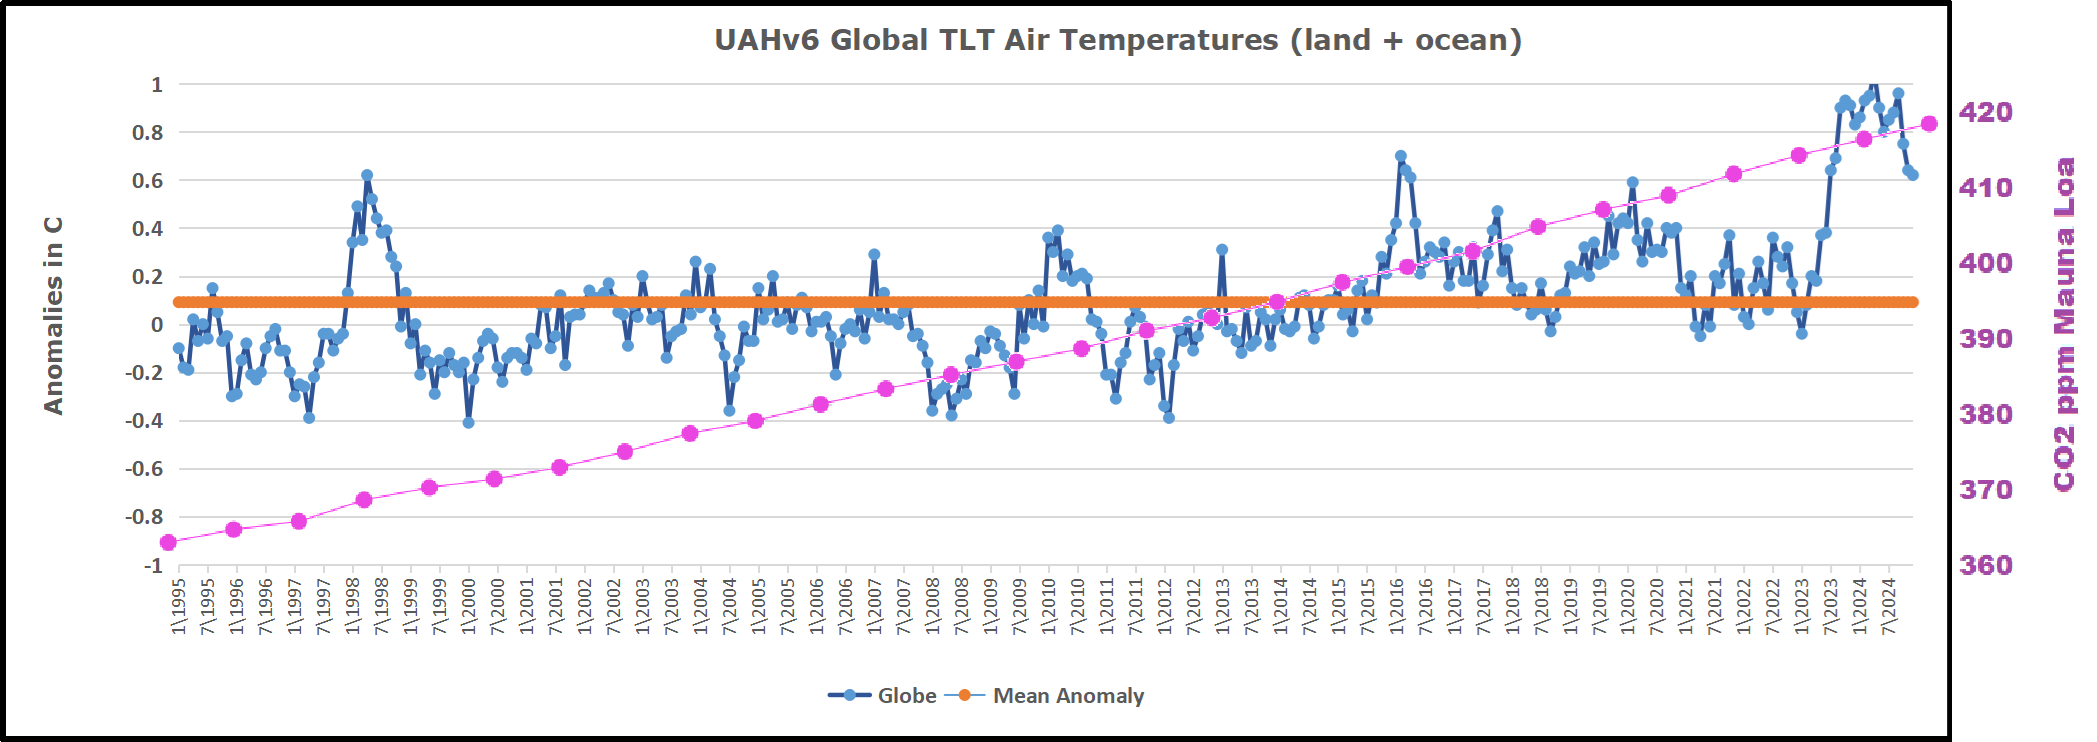
As an overview consider how recent rapid cooling  completely overcame the warming from the last 3 El Ninos (1998, 2010 and 2016).  The UAH record shows that the effects of the last one were gone as of April 2021, again in November 2021, and in February and June 2022  At year end 2022 and continuing into 2023 global temp anomaly matched or went lower than average since 1995, an ENSO neutral year. (UAH baseline is now 1991-2020). Now we have had an usual El Nino warming spike of uncertain cause, unrelated to steadily rising CO2 and now dropping steadily.

For reference I added an overlay of CO2 annual concentrations as measured at Mauna Loa.  While temperatures fluctuated up and down ending flat, CO2 went up steadily by ~60 ppm, a 15% increase.

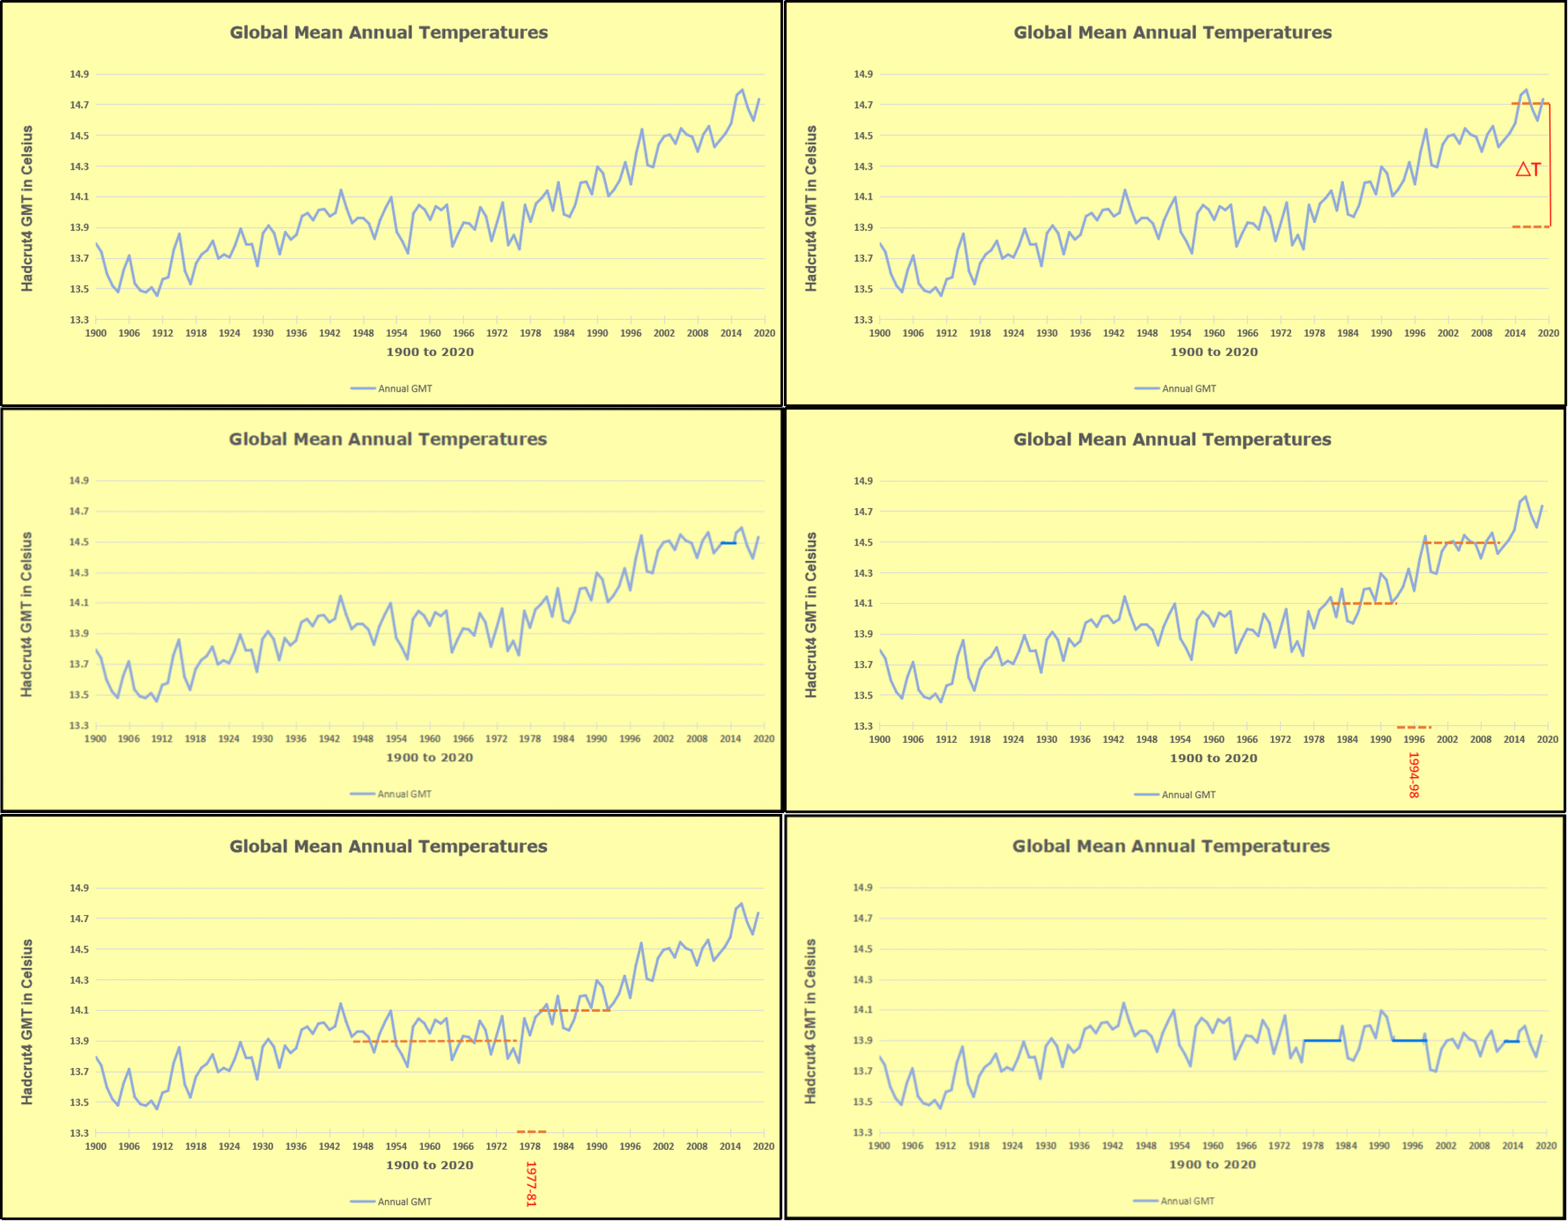
Furthermore, going back to previous warmings prior to the satellite record shows that the entire rise of 0.8C since 1947 is due to oceanic, not human activity.
gmt-warming-events

The animation is an update of a previous analysis from Dr. Murry Salby.  These graphs use Hadcrut4 and include the 2016 El Nino warming event.  The exhibit shows since 1947 GMT warmed by 0.8 C, from 13.9 to 14.7, as estimated by Hadcrut4.  This resulted from three natural warming events involving ocean cycles. The most recent rise 2013-16 lifted temperatures by 0.2C.  Previously the 1997-98 El Nino produced a plateau increase of 0.4C.  Before that, a rise from 1977-81 added 0.2C to start the warming since 1947.

Importantly, the theory of human-caused global warming asserts that increasing CO2 in the atmosphere changes the baseline and causes systemic warming in our climate.  On the contrary, all of the warming since 1947 was episodic, coming from three brief events associated with oceanic cycles. And now in 2024 we have seen an amazing episode with a temperature spike driven by ocean air warming in all regions, along with rising NH land temperatures, now dropping below its peak.

Chris Schoeneveld has produced a similar graph to the animation above, with a temperature series combining HadCRUT4 and UAH6. H/T WUWT
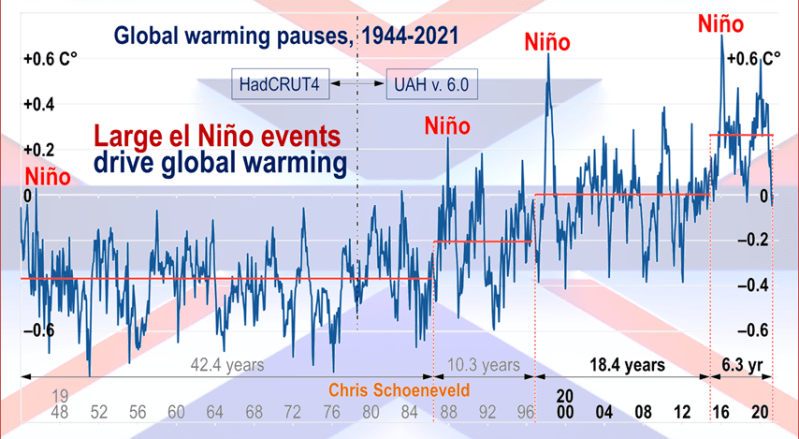
image-8


mc_wh_gas_web20210423124932

See Also Worst Threat: Greenhouse Gas or Quiet Sun?

January 2025 Ocean Leads Global Cooling banner-blog

With apologies to Paul Revere, this post is on the lookout for cooler weather with an eye on both the Land and the Sea.  While you heard a lot about 2020-21 temperatures matching 2016 as the highest ever, that spin ignores how fast the cooling set in.  The UAH data analyzed below shows that warming from the last El Nino had fully dissipated with chilly temperatures in all regions. After a warming blip in 2022, land and ocean temps dropped again with 2023 starting below the mean since 1995.  Spring and Summer 2023 saw a series of warmings, continuing into October, followed by cooling in November and December.

UAH has updated their TLT (temperatures in lower troposphere) dataset for December 2024. Due to one satellite drifting more than can be corrected, the dataset has been recalibrated and retitled as version 6.1 Graphs here contain this updated 6.1 data.  Posts on their reading of ocean air temps this month are ahead of the update from HadSST4.  I posted recently on SSTs Ocean Even Cooler December 2024. These posts have a separate graph of land air temps because the comparisons and contrasts are interesting as we contemplate possible cooling in coming months and years.

Sometimes air temps over land diverge from ocean air changes. In July 2024 all oceans were unchanged except for Tropical warming, while all land regions rose slightly. In August we saw a warming leap in SH land, slight Land cooling elsewhere, a dip in Tropical Ocean temp and slightly elsewhere.  September showed a dramatic drop in SH land, overcome by a greater NH land increase. In October, ocean and land temps in both NH and Tropics dropped, pulling the global anomaly down. As was the case in November and December, now in January there was cooling everywhere, strongest in all ocean anomalies.

Note:  UAH has shifted their baseline from 1981-2010 to 1991-2020 beginning with January 2021.   v6.1 data was recalibrated also starting with 2021. In the charts below, the trends and fluctuations remain the same but the anomaly values changed with the baseline reference shift.
Presently sea surface temperatures (SST) are the best available indicator of heat content gained or lost from earth’s climate system.  Enthalpy is the thermodynamic term for total heat content in a system, and humidity differences in air parcels affect enthalpy.  Measuring water temperature directly avoids distorted impressions from air measurements.  In addition, ocean covers 71% of the planet surface and thus dominates surface temperature estimates.  Eventually we will likely have reliable means of recording water temperatures at depth.

Recently, Dr. Ole Humlum reported from his research that air temperatures lag 2-3 months behind changes in SST.  Thus cooling oceans portend cooling land air temperatures to follow.  He also observed that changes in CO2 atmospheric concentrations lag behind SST by 11-12 months.  This latter point is addressed in a previous post Who to Blame for Rising CO2?

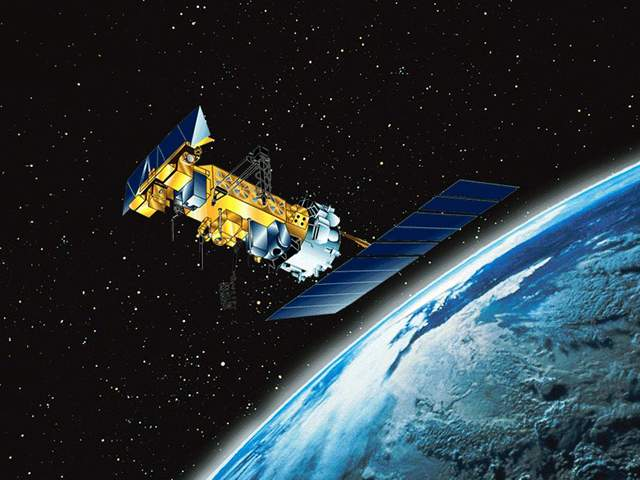
After a change in priorities, updates are now exclusive to HadSST4.  For comparison we can also look at lower troposphere temperatures (TLT) from UAHv6.1 which are now posted for January 2025.  The temperature record is derived from microwave sounding units (MSU) on board satellites like the one pictured above. Recently there was a change in UAH processing of satellite drift corrections, including dropping one platform which can no longer be corrected. The graphs below are taken from the revised and current dataset.

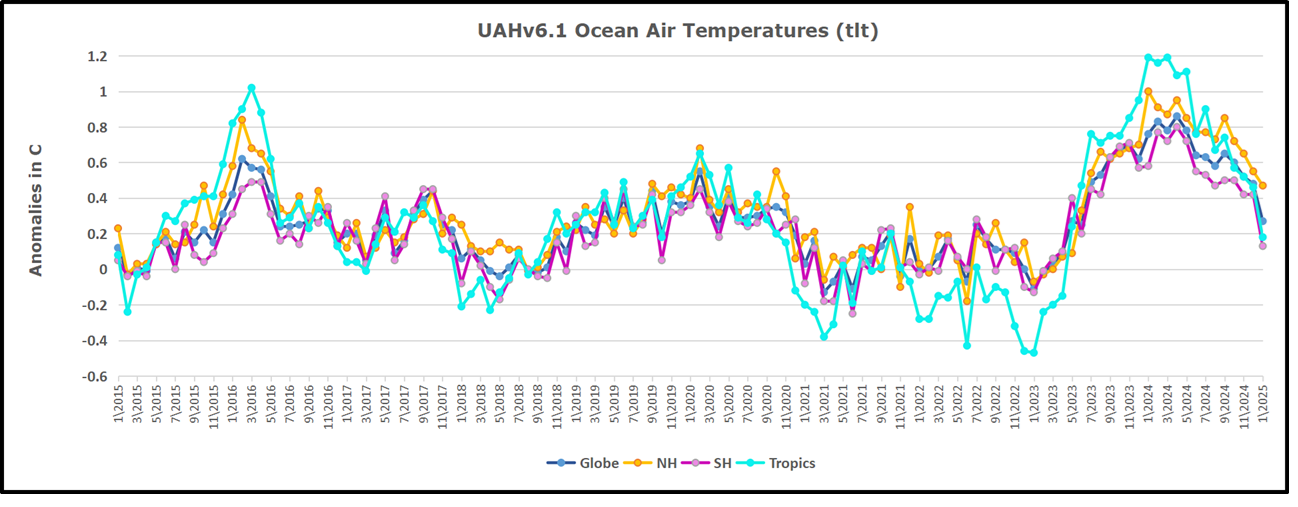
The UAH dataset includes temperature results for air above the oceans, and thus should be most comparable to the SSTs. There is the additional feature that ocean air temps avoid Urban Heat Islands (UHI).  The graph below shows monthly anomalies for ocean air temps since January 2015.
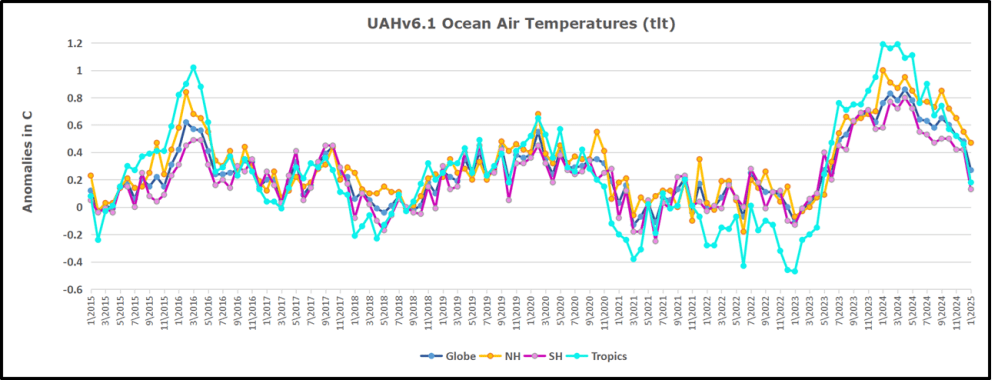
In 2021-22, SH and NH showed spikes up and down while the Tropics cooled dramatically, with some ups and downs, but hitting a new low in January 2023. At that point all regions were more or less in negative territory. 

After sharp cooling everywhere in January 2023, there was a remarkable spiking of Tropical ocean temps from -0.5C up to + 1.2C in January 2024.  The rise was matched by other regions in 2024, such that the Global anomaly peaked at 0.95C in May, Since then all regions have cooled down sharply, Global anomaly dropping in January to 0.3C, as well as SH dropping down to 0.1C in January.

Land Air Temperatures Tracking in Seesaw Pattern

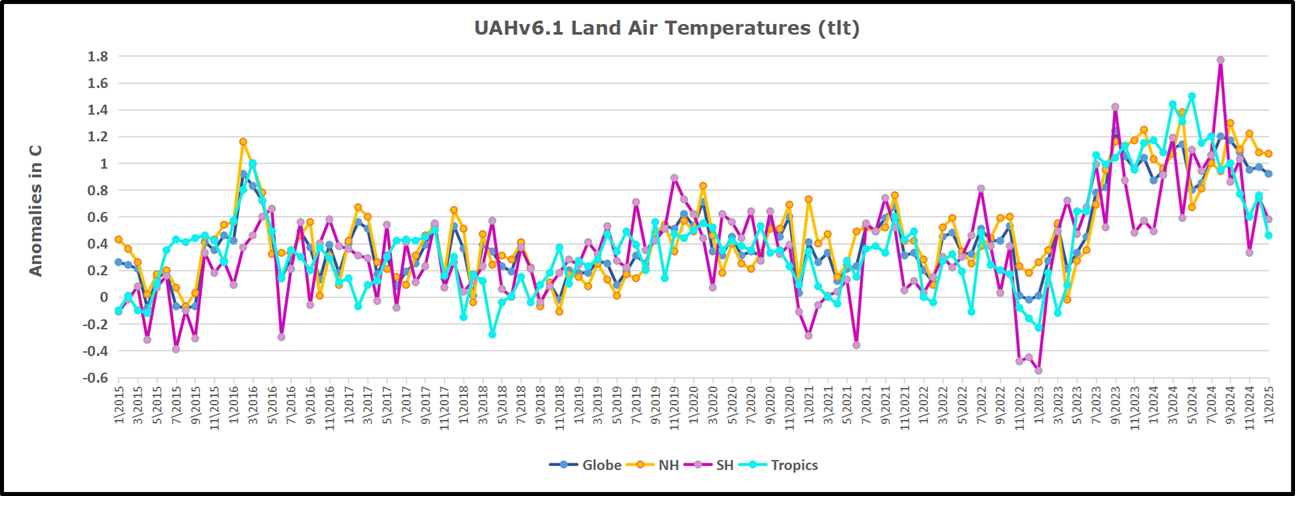
We sometimes overlook that in climate temperature records, while the oceans are measured directly with SSTs, land temps are measured only indirectly.  The land temperature records at surface stations sample air temps at 2 meters above ground.  UAH gives tlt anomalies for air over land separately from ocean air temps.  The graph updated for January is below.
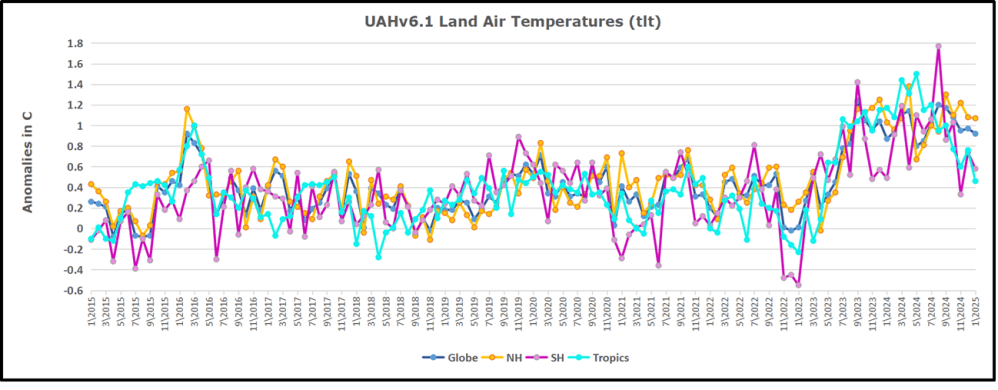
Here we have fresh evidence of the greater volatility of the Land temperatures, along with extraordinary departures by SH land.  The seesaw pattern in Land temps is similar to ocean temps 2021-22, except that SH is the outlier, hitting bottom in January 2023. Then exceptionally SH goes from -0.6C up to 1.4C in September 2023 and 1.8C in  August 2024, with a large drop in between.  In November, SH and the Tropics pulled the Global Land anomaly further down despite a bump in NH land temps. December showed an upward rebound in SH and Tropics land temps, now offset by a dropping temps everywhere, pulling the Global land anomaly downward slightly.

The Bigger Picture UAH Global Since 1980
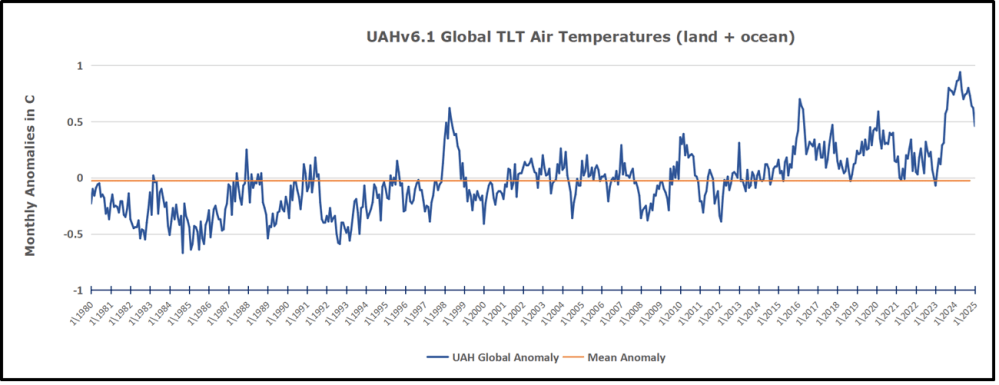
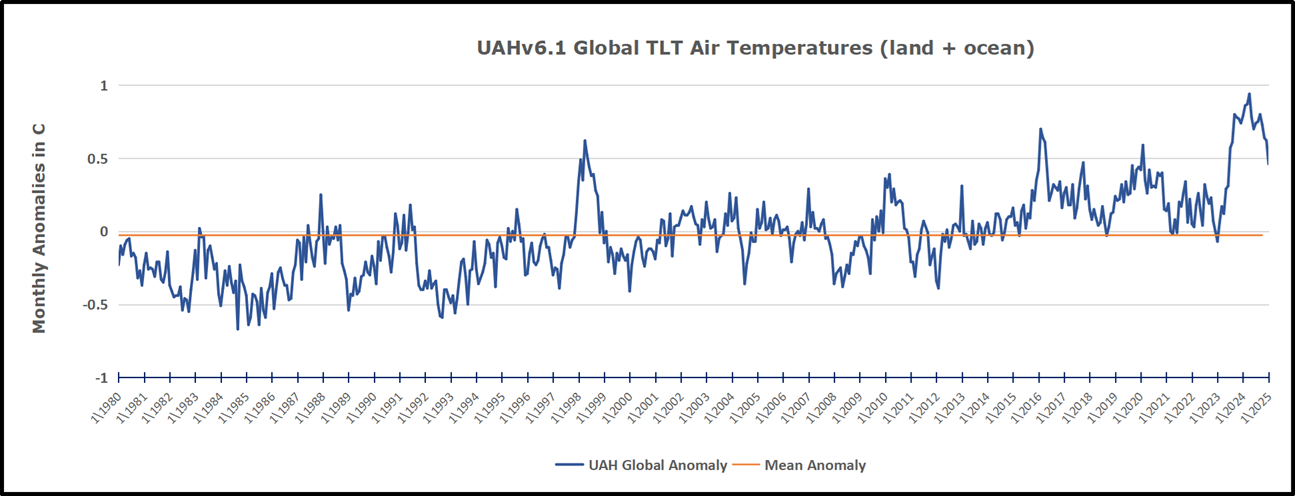
The chart shows monthly Global Land and Ocean anomalies starting 01/1980 to present.  The average monthly anomaly is -0.03, for this period of more than four decades.  The graph shows the 1998 El Nino after which the mean resumed, and again after the smaller 2010 event. The 2016 El Nino matched 1998 peak and in addition NH after effects lasted longer, followed by the NH warming 2019-20.   An upward bump in 2021 was reversed with temps having returned close to the mean as of 2/2022.  March and April brought warmer Global temps, later reversed

With the sharp drops in Nov., Dec. and January 2023 temps, there was no increase over 1980. Then in 2023 the buildup to the October/November peak exceeded the sharp April peak of the El Nino 1998 event. It also surpassed the February peak in 2016. In 2024 March and April took the Global anomaly to a new peak of 0.94C.  The cool down started with May dropping to 0.9C, and in June a further decline to 0.8C.  October went down to 0.7C,  November and December dropped to 0.6C. January down to 0.46C.

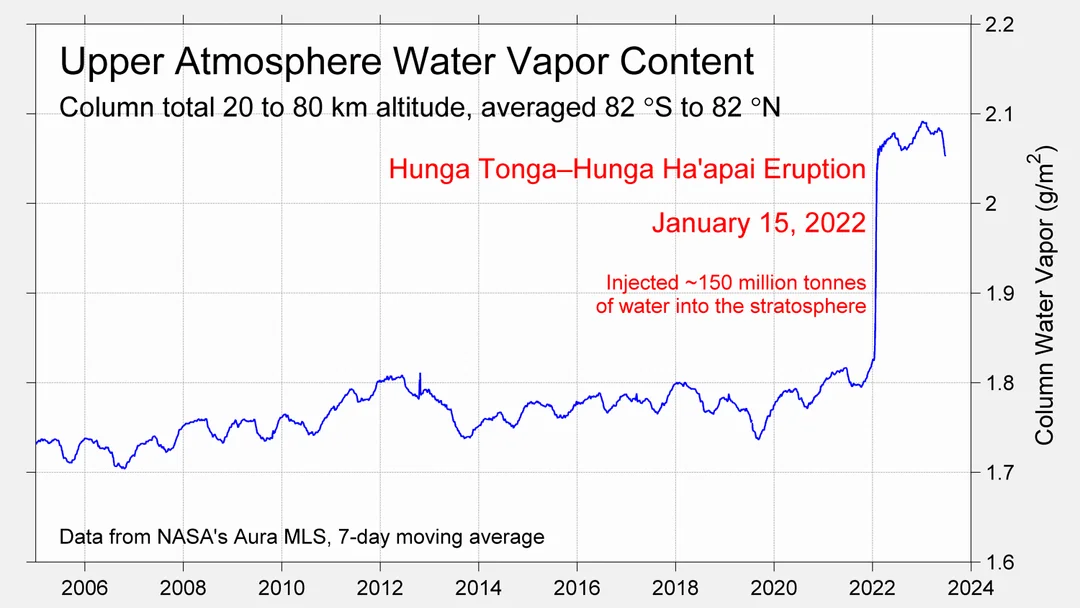
The graph reminds of another chart showing the abrupt ejection of humid air from Hunga Tonga eruption.
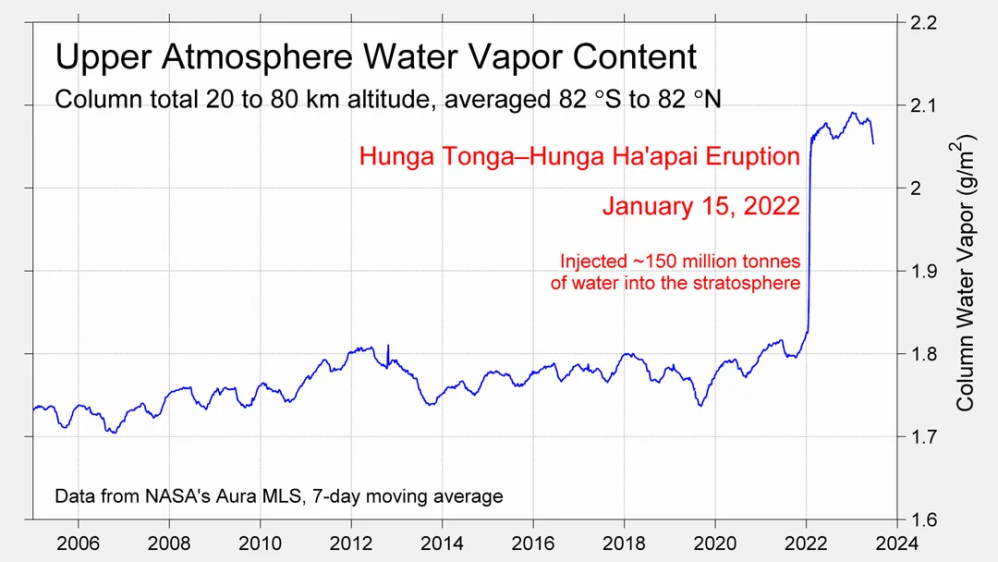
TLTs include mixing above the oceans and probably some influence from nearby more volatile land temps.  Clearly NH and Global land temps have been dropping in a seesaw pattern, nearly 1C lower than the 2016 peak.  Since the ocean has 1000 times the heat capacity as the atmosphere, that cooling is a significant driving force.  TLT measures started the recent cooling later than SSTs from HadSST4, but are now showing the same pattern. Despite the three El Ninos, their warming had not persisted prior to 2023, and without them it would probably have cooled since 1995.  Of course, the future has not yet been written.

 

via Science Matters

https://ift.tt/375I9PJ

February 18, 2025 at 12:04PM

Providing Trump facts he needs on wind and solar

CFACT scholars are providing Administration officials with the hard facts and policy heft they need to turn our energy economy around.

via CFACT

https://ift.tt/a8xqUtZ

February 18, 2025 at 11:48AM