As Elon excavates the Motherlode of global funding, the pieces start to fit together.
Kanekoa the Great wonders why USAID gave $68 million dollars to the World Economic Forum — a group of networking billionaires who meet in January each year to ski in Davos. They turn up in private jets to discuss how they can stop the average man flying. You vill own nothing!
Jo Nova wonders why no media outlet on Earth seemingly figured this out for themselves. Perhaps it was the millions in funding the government paid some media outlets, presumably, to say nothing at all the right moments?
USAID: taking money from poor Americans to give to rich Marxists to plot in Davos, Switzerland—about how to take more money from poor Americans
It’s almost like we already had One World Government all along, we just didn’t know it.
As Mike Benz said we’ve lived our whole life in “the Truman show”. We think we have free press. We think US foreign aid buys tents for refugees and food for starving children. […]
That first article shows 160 graphs of hottest heatwave temperatures over the years when records have been kept, for Adelaide, Alice Springs, Brisbane, Cape Leeuwin, Darwin, Hobart, Longreach, Melbourne, Sydney and Perth. This second article deals with some patterns of interest.
I wrote the articles because many Establishment sources make claims like this one from the Climate Council of Australia, 2014:
“Climate change is already increasing the intensity and frequency of heatwaves in Australia. Heatwaves are becoming hotter, lasting longer and occurring more often.”
Using practically all years of data recorded, I examined each of 4 heatwave durations of 1, 3, 5 and 10 days. The raw data are from the Climate Data Online CDO source by the Bureau of Meteorology.
The first half of the heatwave numbers is compared to the last half. The first half numbers are subtracted from the second half numbers. If there is warming, the difference is positive. If there is cooling, the difference is negative.
This example summarises the method by a graph.
The first half average equals the second half average, so in this simple case no 5-day heatwave warming is shown for Adelaide.
These results summarise all 40 cases.
ADELAIDE
DIFF LAST MINUS FIRST
FIRST HALF 1-DAY
41.42
SECOND HALF 1-DAY
41.68
0.26
FIRST HALF 3-DAY
39.14
SECOND HALF 3-DAY
39.19
0.06
FIRST HALF 5-DAY
37.43
SECOND HALF 5-DAY
37.37
-0.07
FIRST HALF 10-DAY
34.57
SECOND HALF 10-DAY
34.54
-0.03
ALICE SPRINGS
DIFF LAST MINUS FIRST
FIRST HALF 1-DAY
43.08
SECOND HALF 1-DAY
42.94
-0.15
FIRST HALF 3-DAY
41.16
SECOND HALF 3-DAY
41.37
0.21
FIRST HALF 5-DAY
40.22
SECOND HALF 5-DAY
40.54
0.32
FIRST HALF 10-DAY
39.90
SECOND HALF 10-DAY
40.27
0.37
BRISBANE
DIFF LAST MINUS FIRST
FIRST HALF 1-DAY
37.45
SECOND HALF 1-DAY
36.04
-1.41
FIRST HALF 3-DAY
34.08
SECOND HALF 3-DAY
32.77
-1.32
FIRST HALF 5-DAY
33.78
SECOND HALF 5-DAY
32.52
-1.26
FIRST HALF 10-DAY
32.42
SECOND HALF 10-DAY
31.43
-1.00
C_LEEUWIN
DIFF LAST MINUS FIRST
FIRST HALF 1-DAY
33.88
SECOND HALF 1-DAY
34.91
1.03
FIRST HALF 3-DAY
28.92
SECOND HALF 3-DAY
30.07
1.15
FIRST HALF 5-DAY
27.06
SECOND HALF 5-DAY
27.92
0.86
FIRST HALF 10-DAY
25.32
SECOND HALF 10-DAY
25.99
0.67
DARWIN
DIFF LAST MINUS FIRST
FIRST HALF 1-DAY
36.95
SECOND HALF 1-DAY
36.67
-0.28
FIRST HALF 3-DAY
35.97
SECOND HALF 3-DAY
35.64
-0.33
FIRST HALF 5-DAY
36.94
SECOND HALF 5-DAY
36.67
-0.27
FIRST HALF 10-DAY
35.12
SECOND HALF 10-DAY
34.66
-0.46
HOBART
DIFF LAST MINUS FIRST
FIRST HALF 1-DAY
34.86
SECOND HALF 1-DAY
36.49
1.62
FIRST HALF 3-DAY
29.68
SECOND HALF 3-DAY
30.62
0.94
FIRST HALF 5-DAY
27.15
SECOND HALF 5-DAY
28.04
0.89
FIRST HALF 10-DAY
24.86
SECOND HALF 10-DAY
25.86
1.00
LONGREACH
DIFF LAST MINUS FIRST
FIRST HALF 1-DAY
44.12
SECOND HALF 1-DAY
43.94
-0.18
FIRST HALF 3-DAY
43.18
SECOND HALF 3-DAY
42.85
-0.33
FIRST HALF 5-DAY
42.44
SECOND HALF 5-DAY
42.17
-0.27
FIRST HALF 10-DAY
41.33
SECOND HALF 10-DAY
41.13
-0.20
MELBOURNE
DIFF LAST MINUS FIRST
FIRST HALF 1-DAY
40.55
SECOND HALF 1-DAY
40.46
-0.10
FIRST HALF 3-DAY
36.58
SECOND HALF 3-DAY
36.93
0.35
FIRST HALF 5-DAY
34.00
SECOND HALF 5-DAY
34.18
0.17
FIRST HALF 10-DAY
30.69
SECOND HALF 10-DAY
30.99
0.30
PERTH
DIFF LAST MINUS FIRST
FIRST HALF 1-DAY
40.58
SECOND HALF 1-DAY
42.40
1.82
FIRST HALF 3-DAY
37.90
SECOND HALF 3-DAY
40.17
2.27
FIRST HALF 5-DAY
36.38
SECOND HALF 5-DAY
38.65
2.28
FIRST HALF 10-DAY
34.01
SECOND HALF 10-DAY
36.41
2.40
SYDNEY
DIFF LAST MINUS FIRST
FIRST HALF 1-DAY
38.02
SECOND HALF 1-DAY
38.62
0.60
FIRST HALF 3-DAY
32.68
SECOND HALF 3-DAY
33.32
0.64
FIRST HALF 5-DAY
30.72
SECOND HALF 5-DAY
31.35
0.63
FIRST HALF 10-DAY
28.78
SECOND HALF 10-DAY
29.53
0.75
GRAND AV
0.35
POSITIVES
24.00
NEGATIVES
16.00
The naïve interpretation is that overall, if there is evidence of heatwaves getting hotter, it is small. 40% of cases show cooling, 60 % show warming. The overall warming is about 0.35 ͦC, which is of similar size to the uncertainty of the numbers.
In scientific experiments, it is often the case that a simple first look will either encourage or discourage further investigation. Here, there is little enthusiasm to look further. The pattern is not indicative of future health problems, for example.
Those familiar with time series numbers such as these will question the data quality. As I noted in my first article,
NOTE 1: Many of these stations underwent a site shift, many in the middle of the study period, typically from a Post Office to an Airport. This has affected the distribution over time of these hottest heatwaves. There is no reliable method to adjust this by a single step change because the magnitude of such a step is not now knowable.
A conclusion is that those who seek to show heatwaves getting hotter need to ask how to combat these simple contrary results without the use of subjective adjustments that typically lead to disagreement about methods, motives and manipulations.
Why not accept that there is next to no simple evidence of Australian heatwaves getting hotter and leave it at that?
LONGER?
I took the Top 40 heatwave numbers for all 10 cities, CDO not ACORN-SAT, to examine 1-Day, 3-Day, 5-Day and 10-Day heatwave patterns.
In theory, if the longer 10-Day heatwave types were increasing compared to 1-Day or 3-Day, then counts of various heatwave numbers should show this. I also examined the number of days in the first half of the station history versus the last half of the total years. Adelaide, the first station examined in this way, met the change point in 1956.
HEATWAVE
1ST PART
2ND PART
DAY-LENGTH
# of DAYS
# of DAYS
ADELAIDE
1
19
21
3
20
20
5
20
20
10
20
20
This example shows that first, the number of Top 40 heatwaves in the first part of the observations is about the same as in the second half. Second, the table shows similar counts for heatwaves of all durations, so the longer 10-Day types were not increasing compared to 1-Day etc, so the inference is that these Adelaide heatwaves were not becoming longer. (The Top 40 selection is used because if all years were examined, the split would always be equal and could not show anything of interest.)
Not all stations trend the same as Adelaide.
PERTH
HEATWAVE
1ST PART
2ND PART
DAY-LENGTH
# of DAYS
# of DAYS
1
8
32
3
5
35
5
6
34
10
5
35
Perth indicates that while the “hotter” heatwaves were more abundant in later years, the share of longer heatwaves remains much the same as shorter ones.
Here is the complete table of all ten stations. I have added the average temperature of each subset, which is a check on paperwork but does not add to understanding because the differences are so small.
HEATWAVE
1ST PART
2ND PART
Average T
Average T
DAY-LENGTH
# of WAVES
# of WAVES
First Part
Second Part
HALF WAY YEAR
ADELAIDE
1
19
21
43.37
43.73
1956
3
20
20
41.61
41.69
5
20
20
40.4
39.97
10
20
20
37.24
37.05
ALICE SPRINGS
1
26
14
44.99
44.61
1952
3
23
17
43.08
42.96
5
22
18
42.28
42.07
10
21
19
41.95
41.85
BRISBANE
1
24
16
39.79
39.4
1956
3
30
10
35.47
35.1
5
31
9
35.04
34.88
10
30
10
33.48
33.28
C LEEUWIN
1
17
23
37.3
37.43
1966
3
13
27
32.03
32.1
5
14
26
29.35
29.42
10
15
25
27.05
26.98
DARWIN
1
27
13
37.97
37.77
1955
3
27
13
36.86
36.57
5
26
14
37.98
37.72
10
31
9
35.83
35.55
HOBART
1
15
25
38.17
38.74
1971
3
20
20
32.78
33.66
5
14
26
29.72
29.44
10
17
23
27.87
27.39
LONGREACH
1
24
16
45.74
45.82
1961
3
26
14
44.77
44.54
5
24
16
44.1
43.83
10
21
19
42.81
42.64
MELBOURNE
1
22
19
43.4
43.51
1941
3
19
21
39.84
39.78
5
21
19
37.6
37.23
10
19
21
33.18
33.6
PERTH
1
8
32
43.08
43.57
1961
3
5
35
41.49
41.39
5
6
34
39.79
39.94
10
5
35
37.81
37.39
SYDNEY
1
16
24
41.21
41.53
1942
3
14
28
35.87
35.65
5
13
27
33.48
33.3
10
12
28
30.89
31.01
AVERAGE
19.425
20.65
The conclusion is that by this method of analysis, there is no indication that heatwaves are becoming longer.
NOTE: This analysis used essentially all of the raw time and temperature data available. Different conclusions are possible if some adjustments are used. For example, if only data from the last 40 years is used, there might be an indication of heatwaves becoming longer. (I have not tested this).
Alternatively, a different conclusion might be reached if adjusted ACORN-SAT temperatures were used. However, these approaches open the gate to cherry picking, selective argument and subjective changes that have to date been a major cause of disagreement between groups of investigators.
MORE FREQUENT?
The data base that I have constructed produces the year in which a putative heatwave happened and the highest average maximum temperature it reached over 1, 3, 5 and 10 consecutive days. It does not sort the number or intensity of more than one heatwave each year, intense enough to be counted among competitors from other years.
Software to detect more than one heatwave a year is complex and it is dependent on the definition of a heatwave. Different countries use different definitions of “heatwave”. Some definitions are precise enough to allow computing, others are vague and can be flexibly adjusted to suit an outcome. Also, questions arise, for example, should one infill a prospective significant 10-day heatwave that has a missing value in the centre? Infill with what temperature? And, when is a 10-Day heatwave better treated as two adjacent 5-Day heatwaves?
It is possible to crawl manually through the 50,000 or so days for each of these 10 stations to detect the stronger heatwaves apart from the primary one that is there because others in the same year are excluded by the “remove duplicates” function on Excel applied to all years examined in a sorting from highest heatwave temperature to lowest. I have examined the tedium required and rejected that option.
Maybe Artificial Intelligence can provide a workable solution. Over to you, readers.
However, I know of no literature that counts the number of heatwaves over time in a manner that concludes that they are becoming more frequent. Links welcomed from readers.
DISCUSSION:
To the extent that these 10 weather station localities can represent Australian climate features, there is little to no evidence in this analysis with its limitations, that heatwaves are becoming hotter or longer with more analysis required about “more frequent”.
There is little comparable scientific literature in conflict with this conclusion. Many cited studies commence after 1950; many invoke convoluted definitions of heatwave; and many seem affected by a wrong piece of logic.
The wrong logic. There is general scientific acceptance that global temperatures have increased by 1 to 1.5 ͦ C in the last 120 years or so. Many publications contain the assertion or assumption that this temperature increase has also underlined the heatwave maximum temperature pattern, expecting it to show a similar increase. It does not, in the data studied here. The conduct of heatwaves differs from the conduct of general temperature observations. In the case of these 10 Australian stations, there is essentially no change over time demonstrated in the maximum average heatwave temperatures reached.
Remember that sea surface temperatures seldom exceed 30 ͦC . There is a mechanism of convective instability that creates an upper limit. While no mechanism appears to have been advanced for an upper limit on heatwave temperatures over land, it should not be discounted from future research.
Further, there is a widespread theme in the literature that the heatwave is an event related to the location at which it happens. The heatwave patterns of coastal Adelaide and Melbourne are strongly influenced by Hadley cells that cause hot winds from central Australia to move to the South and South-East towards the coastal cities, sometimes elevating local average temperatures by up to 15 ͦ C. How hot it gets is dictated by how hot the centre of Australia is at the time, how close to optimum is the direction of travel of hot air from the centre to the coast, how intense is the weather system that created a fast, low heat loss transport from the hot centre to the coast.
SUMMARY.
Simple raw temperature data analysis does not support the widespread global or national claim that heatwaves are becoming hotter, longer and more frequent.
Because simple analysis does not support that claim, those who continue the claim must rely on non-simple analysis. All studies about Australia use the same data set as here, so arrival at different conclusions must depend on subjective assumptions and on them being acceptable.
Acceptable to whom?
END.
Discover more from Watts Up With That?
Subscribe to get the latest posts sent to your email.
During Trump 1.0 the appointed EPA Director summarized the false dichotomy long plaguing the agency: “If you are for the Environment, you must be against Development; and if you are for Development, you must be against the Environment.” In reality, a balance must be struck, and a new administration intends to find it. There has been much gnashing of teeth in the legacy media over this month’s dismissal of scientists from EPA advisory boards, without mentioning the same housecleaning happened in 2021 when Biden regime took over. Now we have an official announcementabout the new EPA direction and priorities. Text in italics with my bolds and added images.
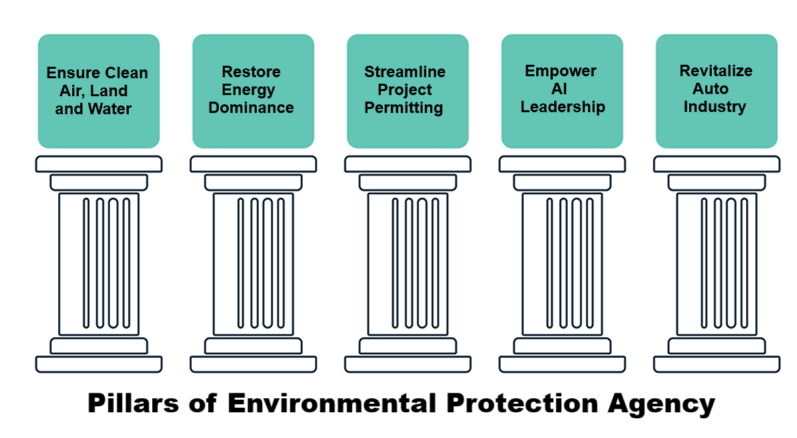
WASHINGTON – On February 4, 2025, U.S. Environmental Protection Agency (EPA) Administrator Lee Zeldin announced the agency’s Powering the Great American Comeback Initiative, to achieve the agency’s mission while energizing the greatness of the American economy. This plan outlines the agency’s priorities under the leadership of President Trump and Administrator Zeldin. The newly announced Powering the Great American Comeback initiative consists of five pillars that will guide the EPA’s work over the first 100 days and beyond:
Pillar 1: Clean Air, Land, and Water for Every American
“Every American should have access to clean air, land, and water. I will ensure the EPA is fulfilling its mission to protect human health and the environment. In his first term, President Trump advanced conservation, reduced toxic emissions in the air, and cleaned up hazardous sites, while fostering economic growth for families across the country. We remain committed to these priorities in this administration, as well as ensuring emergency response efforts are helping Americans get back on their feet in the quickest and safest way possible. We will do so while remaining good stewards of tax dollars and ensuring that every penny spent is going towards advancing this mission,” said Administrator Zeldin.
Pillar 2: Restore American Energy Dominance
“Pursuing energy independence and energy dominance will cut energy costs for everyday Americans who are simply trying to heat their homes and put gas in their cars. This will also allow our nation to stop relying on energy sources from adversaries, while lowering costs for hardworking middle-income families, farmers, and small business owners. I look forward to working with the greatest minds driving American innovation, to ensure we are producing and developing the cleanest energy on the planet,” said Administrator Zeldin.
Pillar 3: Permitting Reform, Cooperative Federalism, and Cross-Agency Partnership
“Any business that wants to invest in America should be able to do so without having to face years-long, uncertain, and costly permitting processes that deter them from doing business in our country in the first place. It will be important for the EPA to work with our partners at the state and federal levels to ensure projects are being approved and companies can invest billions of dollars into our nation. Streamlining these processes, while partnering with businesses to follow the necessary steps to safeguard our environment, will incentivize investment into our economy and create American jobs,” said Administrator Zeldin.
Pillar 4: Make the United States the Artificial Intelligence Capital of the World
“As we rapidly advance into this new age of AI, it is important that the United States lead the world in this field. Those looking to invest in and develop AI should be able to do so in the U.S., while we work to ensure data centers and related facilities can be powered and operated in a clean manner with American-made energy. Under President Trump’s leadership, I have no doubt that we will become the AI capital of the world,” said Administrator Zeldin.
Pillar 5: Protecting and Bringing Back American Auto Jobs
“Our American auto industry is hurting because of the burdensome policies of the past. Under President Trump, we will bring back American auto jobs and invest in domestic manufacturing to revitalize a quintessential American industry. We will partner with leaders to streamline and develop smart regulations that will allow for American workers to lead the great comeback of the auto industry,” said Administrator Zeldin.