
By Paul Homewood
h/t John Cooknell
The Met Office continue to push their “heavy rainfall due to climate change” propaganda:


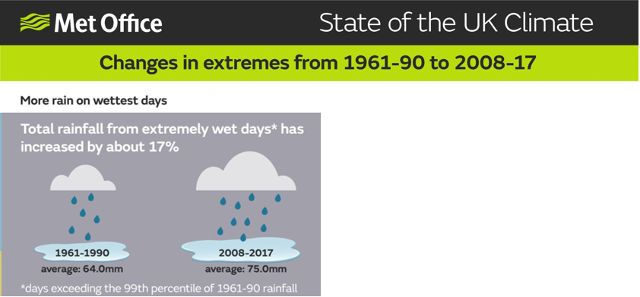
But every time they do so, they start their analysis in or around 1961. Note, in this example, they use 1961-90 as a base.
However, as I have reported previously, it is well established amongst experts in this field that this period, from the 1960s to 90s, was a “flood dry period” in the UK, a term which has come to be commonly used amongst scientists.
Prof Stuart Lane of Durham University is usually the source I refer to, and he was quoted by the University in 2008:
However, in looking at longer rainfall and river flow records, Prof. Lane shows that we have forgotten just how normal flooding in the UK is. He looked at seasonal rainfall and river flow patterns dating back to 1853 which suggest fluctuations between very wet and very dry periods, each lasting for a few years at a time, but also very long periods of a few decades that can be particularly wet or particularly dry.
In terms of river flooding, the period since the early 1960s and until the late 1990s appears to be relatively flood free, especially when compared with some periods in the late 19th century and early 20th Century. As a result of analysing rainfall and river flow patterns, Prof. Lane believes that the UK is entering a flood rich period that we haven’t seen for a number of decades.
He said: “We entered a generally flood-poor period in the 1960s, earlier in some parts of the country, later in others. This does not mean there was no flooding, just that there was much less than before the 1960s and what we are seeing now. This has lowered our own awareness of flood risk in the UK. This has made it easier to go on building on floodplains. It has also helped us to believe that we can manage flooding without too much cost, simply because there was not that much flooding to manage.”
He added: “We have also not been good at recognising just how flood-prone we can be. More than three-quarters of our flood records start in the flood-poor period that begins in the 1960s. This matters because we set our flood protection in terms of return periods – the average number of years between floods of a given size. We have probably under-estimated the frequency of flooding, which is now happening, as it did before the 1960s, much more often that we are used to.
https://www.dur.ac.uk/geography/news/allgeognews/?itemno=6479
But he is not the only one aware of this issue.
In 2013, Wilby & Quinn found that not only were there clearly identifiable flood rich periods, but that the major weather systems responsible floods showed no sustained trends:

Summary
Conventional techniques for quantifying and then managing flood risks are invalid under ‘non-stationary’ climate conditions. Trend detection and attribution are problematic given that the outcome depends on the start and end date of the record, choice of index and test statistic, assumed behaviour of the system, and many non-climatic confounding factors. Analyses are further hampered by short and non-homogeneous flow records. In this paper, we use an objective weather classification scheme to reconstruct the atmospheric drivers of fluvial flood occurrence and magnitude in England, Scotland and Wales since the 1870s. We demonstrate the index using long (>50 year) annual maximum (AMAX) and peak over threshold (POT) flood records for 114 stations. Synoptic indices show modest skill at hindcasting multi-decadal variations in flood frequency at national, regional and catchment scales, but not for flood magnitudes. Flood rich episodes are identified in the periods 1908–1934, 1977–1988 and from 1998 onwards. We find that five weather types account for 68% of flood occurrence, and just three types were linked to the most widespread winter floods. These flood-generating systems generally show no sustained changes in frequency, persistence, relative contribution, or rain-bearing properties since the 1930s. However, there are emergent patterns in the day-to-day persistence (declining) and mean precipitation yield (rising) of anticyclonic weather types that merit further investigation. Based on our evaluation, we recommend use of objective weather indices derived from observed atmospheric pressure patterns when interpreting fluvial flood risk linked to climate drivers.
https://www.sciencedirect.com/science/article/pii/S0022169413001613?via%3Dihub
In 2017, Macdonald and Sangster went one step further, with their analysis of flood chronologies since 1750.
The apparent increase in flooding witnessed over the last decade appears in consideration to the long-term flood record not to be unprecedented; whilst the period since 2000 has been considered as flood-rich, the period 1970–2000 is “flood poor”, which may partly explain why recent floods are often perceived as extreme events. The much publicised (popular media) apparent change in flood frequency since 2000 may reflect natural variability, as there appears to be no shift in long-term flood frequency
They also produced this chart, illustrating flood dry period during most of the 1960 to 1990 period, along with other notably flood rich periods:

Finally Jamal Munshi comes at it from a different angle, with an analysis of monthly rainfall since 1976. He too finds clusters of flood years, but finds them to be simply random events:

All of this raises serious questions about the Met Office. If they are aware of these cyclical fluctuations, and particularly the flood dry period in between 1961 and 1990, why are they misleading the public about the cause of heavy rainfall and floods in recent years?
And if they are not aware of flood histories, surely this points to gross incompetence?
Either way, it casts them in a very poor light.
via NOT A LOT OF PEOPLE KNOW THAT
November 20, 2019 at 11:39AM

Reblogged this on Climate- Science.press.
LikeLike