
Guest (fill in the blank) by David Middleton
Shouting into the apocalypse: The decade in climate change
Opinion by John D. SutterDecember 29, 2019
John D. Sutter is a CNN contributor and a National Geographic Explorer. He is director of the forthcoming BASELINE series, which is visiting four locations on the front lines of the climate crisis every five years until 2050. Visit the project’s website and sign up for the BASELINE newsletter. The opinions expressed in this commentary are his own. View more opinion at CNN.
(CNN) What’s that worn-out phrase? Shouting into the wind? Well, after a decade of rising pollution, failed politics and worsening disasters, it seems the many, many of us who care about the climate crisis increasingly are shouting into the hurricane, if not the apocalypse.On the cusp of 2020, the state of the planet is far more dire than in 2010. Preserving a safe and healthy ecological system is no longer a realistic possibility. Now, we’re looking at less bad options, ceding the fact that the virtual end of coral reefs, the drowning of some island nations, the worsening of already-devastating storms and the displacement of millions — they seem close to inevitable. The climate crisis is already costly, deadly and deeply unjust, putting the most vulnerable people in the world, often who’ve done the least to cause this, at terrible risk.
The worst part?
[… This is as far as I read …]
The “worst part” is that CNN would regard a pinhead with a BA in journalism & international studies as a climate change analyst… No, wait… The “worst part” is that Real Clear ENERGY carried this meatheaded CNN climate crap as if it had jack schist to do with energy.
EMMY nominated documentary director, producer, writer and journalist. Currently: National Geographic Explorer and CNN climate analyst. I’m developing a documentary series called “Baseline,” which tells the story of the climate crisis beyond a human lifetime. Former senior investigative reporter for CNN. Livingston, Peabody and Murrow aw… see more
Why would anyone with at least two functioning neurons between their ears want to “see more”? Although, curiosity made me read just a little bit more of the CNN climate crap…
We’ve known about this for a very long time. The climate emergency may seem like the issue of the moment, a new thing, a 2020 Democrats thing or a Greta Thunberg thing, but check out this 1958 educational film that mentions “tourists in glass-bottomed boats would be viewing the drowned towers of Miami;” or coverage of the first Earth Day in 1970, 50 years ago this coming April, when millions hit the streets; or NASA scientist James Hansen’s 1988 testimony before the US Senate stating the era of global warming had begun.It bears repeating that scientists have looked at the evidence, and more than 97% of them agree that humans are warming the planet, primarily by burning fossil fuels such as coal, oil and gas. The warnings from scientists are only getting more dire as we peel decades off the calendar. …
The gist of this CNN climate crap seems to be that railing against climate change is like urinating into the wind: “A really futile and stupid gesture” … Might as well just play this scene from Animal House over, and over again…
“Scientists have looked at the evidence, and more than 97% of them agree that humans are warming the planet”
More like 67%…

The same survey found that 50% of scientists can’t say that the warming of the planet is necessarily bad…

It also found that most scientists agreed that there wan’t much point in trying to prevent the weather from changing.

Stenhouse et al., 2017 tells us that the scientists agree that there is no consensus on the subject of climate change.
This article analyzes open-ended survey responses to understand how members of the American Meteorological Society (AMS) perceive conflict within the AMS over global warming. Of all survey respondents, 53% agreed that there was conflict within the AMS; of these individuals who perceived conflict, 62% saw it as having at least some productive aspects, and 53% saw at least some unproductive aspects. Among members who saw a productive side to the conflict, most agreed as to why it was productive: debate and diverse perspectives enhance science. However, among members who saw an unproductive side, there was considerable disagreement as to why. Members who are convinced of largely human-caused climate change expressed that debate over global warming sends an unclear message to the public. Conversely, members who are unconvinced of human-caused climate change often felt that their peers were closed-minded and suppressing unpopular views. These two groups converged, however, on one point: politics was seen as an overwhelmingly negative influence on the debate. This suggests that scientific organizations faced with similar conflict should understand that there may be a contradiction between legitimizing all members’ views and sending a clear message to the public about the weight of the evidence. The findings also reinforce the conclusion that attempts by scientific societies to directly address differences in political views may be met with strong resistance by many scientists.
Stenhouse et al., 2017
More than 97% of scientists would agree that carbon dioxide is a greenhouse gas. However, there are widely diverging scientific opinions as to how much it has, or will, warm the planet and no consensus at all regarding what, if anything, we should attempt to do about it.
What if “humans are warming the planet”?
This was the climate crisis du jour as recently as the late 1970’s:
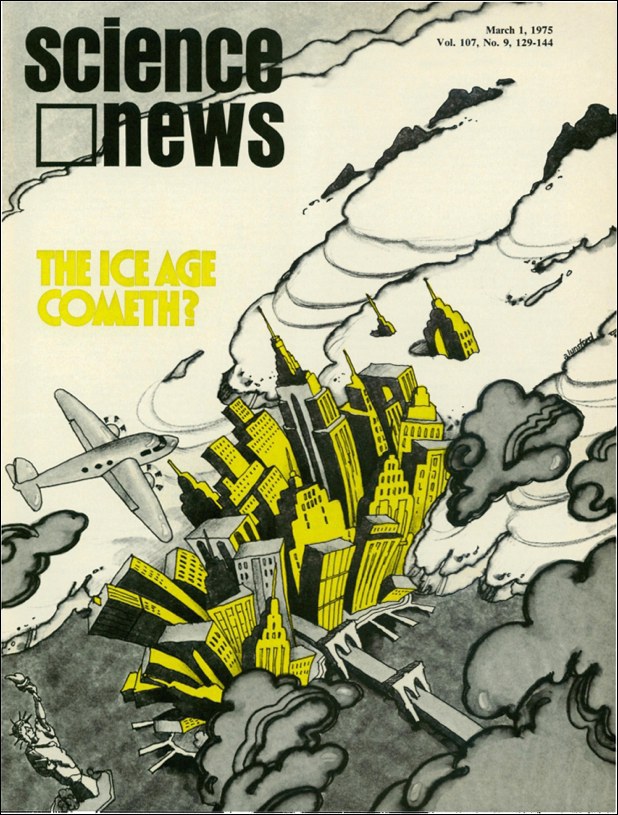
Assuming, arguendo, that the climate models are accurate, if humans hadn’t been warming the planet, it would be colder now than it was when Science News asked if “the ice age cometh?”

At this point, I decided to read on…
A more striking way to think about this is to look even further back in time. More than half of all industrial greenhouse gas pollution since the Industrial Revolution has been created in the past 30-some years. And, again, we’ve known about the crisis, along with its causes and solutions, for longer than that.
We just covered this bit of nonsense… The “past 30-some years” of “industrial greenhouse gas pollution” has barely lifted us above “the ice age cometh.” So, let’s go back to the beginning of the Industrial Revolution (IR). The IR began during a climatic phase known as The Little Ice Age (LIA). This was most likely the coldest climatic period of the Holocene Epoch. In Central Greenland it was roughly the same temperature as it was during the Bølling-Allerød glacial interstadial.

I wonder if the CNN climate analyst is aware of the fact that the “industrial greenhouse gas pollution” began at a time when Earth was colder and more ice-covered than at any point since the end of the Pleistocene Epoch.
Little Ice Age
JUNE 5, 2015 / K. JAN OOSTHOEK[…]
During the height of the Little Ice Age , it was in general about one degree Celsius colder than at present. The Baltic Sea froze over, as did most of the rivers in Europe. Winters were bitterly cold and prolonged, reducing the growing season by several weeks. These conditions led to widespread crop failure, famine, and in some regions population decline.
The prices of grain increased and wine became difficult to produce in many areas and commercial vineyards vanished in England. Fishing in northern Europe was also badly affected as cod migrated south to find warmer water. Storminess and flooding increased and in mountainous regions the treeline and snowline dropped. In addition glaciers advanced in the Alps and Northern Europe, overrunning towns and farms in the process.
Iceland was one of the hardest hit areas. Sea ice, which today is far to the north, came down around Iceland. In some years, it was difficult to bring a ship ashore anywhere along the coast. Grain became impossible to grow and even hay crops failed. Volcanic eruptions made life even harder. Iceland lost half of its population during the Little Ice Age.
Tax records in Scandinavia show many farms were destroyed by advancing ice of glaciers and by melt water streams. Travellers in Scotland reported permanent snow cover over the Cairngorm Mountains in Scotland at an altitude of about 1200 metres. In the Alps, the glaciers advanced and threatened to bulldozed towns. Ice-dammed lakes burst periodically, destroying hundreds of buildings and killing many people. As late as 1930 the French Government commissioned a report to investigate the threat of the glaciers. They could not have foreseen that human induced global warming was to deal more effective with this problem than any committee ever could. \
[…]
“Many farms were destroyed by advancing ice of glaciers and by melt water streams”… “Ice-dammed lakes burst periodically, destroying hundreds of buildings and killing many people”… Sounds like an actual climate crisis to me.
History of Glaciers in Glacier National Park
The history of glaciation within current Glacier National Park boundaries spans centuries of glacial growth and recession, carving the features we see today. Glaciers were present within current Glacier National Park boundaries as early as 7,000 years ago but may have survived an early Holocene warm period (Carrara, 1989), making them much older. These modest glaciers varied in size, tracking climatic changes, but did not grow to their Holocene maximum size until the end of the Little Ice Age (LIA) around A.D. 1850. While they may not have formed in their entirety during the LIA, their maximum perimeters can be documented through mapping of lateral and terminal moraines. (Key, 2002) The extent and mass of these glaciers, as well as glaciers around the globe, has clearly decreased during the 20th century in response to warmer temperatures.Climate reconstructions representative of the Glacier National Park region extend back multiple centuries and show numerous long-duration drought and wet periods that influenced the mass balance of glaciers (Pederson et al. 2004). Of particular note was an 80-year period (~1770-1840) of cool, wet summers and above-average winter snowfall that led to a rapid growth of glaciers just prior to the end of the LIA. Thus, in the context of the entire Holocene, the size of glaciers at the end of the LIA was an anomaly of sorts. In fact, the large extent of ice coverage removed most of the evidence of earlier glacier positions by overriding terminal and lateral moraines.
Tree-ring based climate records and historic photographs indicate the initiation of frontal recession and ice mass thinning between A.D. 1860 and 1880. The alignment of decadal-scale climate anomalies over the early 20th century produced a period of glacial recession somewhat analogous to conditions experienced over the past few decades. The coupling of hot, dry summers with substantial decreases in winter snowpack (~30% of normal) produced dramatic recession rates as high as 100 m/yr from A.D. 1917-1941 (Pederson et al. 2004). These multidecadal episodes have substantially impacted the mass balance of glaciers since A.D. 1900.
The glaciers of Glacier National Park reached their maximum Holocene extent about 150 years ago.

Glaciers are always advancing or retreating. Advancing is bad, always bad.
Most alpine and valley glaciers formed after the Holocene Climatic Optimum and generally advanced until the early to mid 1800’s. This period is known as Neoglaciation. Since the end of Neoglaciation most alpine and valley glaciers have been retreating. Neoglaciation ended long-before CO2 levels had risen much above 280 ppm.
The following graph overlays atmospheric CO2 and northern hemisphere temperatures on Oerlemans’ stacked glacier length plot.

45% of the ice loss occurred before 1900, when atmospheric CO2 was still below 300 ppm. By 1950, 75% of the ice loss had occurred. Only 25% of the ice loss has occurred since humans allegedly became the primary drivers of climate change. At the time of “The Ice Age Cometh” (1975), 90% of the ice loss had already occurred.
Arctic sea ice also reached its maximum Holocene extent during the LIA.


One would think that a CNN climate crap analyst might have been cognizant of the context of his climate apocalypse… Of course, had he actually been aware of the science, his CNN climate crap opinion piece would have been much shorter.
Amazingly, the CNN climate crap analyst’s opinion piece actually became stupider as it went along.
“We basically dillied and dallied and squandered the last 40 years, and you can’t just keep kicking the can down the road,” Anthony Leiserowitz, director of the Yale Program on Climate Change Communication, and a senior research scientist, told me.
[…]
“The longer we wait the more impossible it becomes.”
“The longer we wait the more impossible it becomes.”

How could something become “more impossible”? And if it’s already impossible… why do they continue to nag us about it?
“The world is in a far more perilous place at the end of 2019 compared to 2010 as climate impacts are being seen and felt all over the world,” Bill Hare, director of Climate Analytics, a research group, said in an email. “We have used up nearly half the carbon budget we had remaining in 2010. Fossil fuel emissions are 10% higher, and still increasing. Sea level rise is accelerating, and global temperature is increasing at 0.2 degrees Celsius per decade.”
“Fossil fuel emissions are 10% higher, and still increasing.”
Then go annoy Red China and leave us the hell alone…

“Sea level rise is accelerating”…
Riiight….

The alleged acceleration is a joke…
If this acceleration was maintained through the 21st century, sea level in 2100 would be 310 ± 30 mm higher than in 1990, overlapping with the central range of projections in the Intergovernmental Panel on Climate Change Third Assessment Report (IPCC TAR) [Church et al., 2001].
310 mm of sea level rise from 1990-2100 is less than 3 mm/yr… Not much of an acceleration relative to what sea level was already doing.

“And global temperature is increasing at 0.2 degrees Celsius per decade.”
More like 0.13 to 0.17 °C… And so what?

Finally, the CNN climate crap analyst got something right
But the end of the fossil fuel era is not yet in sight.
No schist Sherlock!


Then the CNN climate crap analyst veered off the road into Lalaland…
There’s evidence that only certain chunks of society are getting the message.
Only 52% of American adults say they are “very” or “extremely” sure global warming is happening, according to a report from the Yale Program on Climate Change Communication and the George Mason University Center for Climate Change Communication, which is based on a 1,303 person survey conducted in November 2019. Yale’s been asking that question for a while now. Go back a decade, to 2009, and the rate is about the same: 51%.
In other words: Despite the increased sense of urgency, public opinion is flat.
On the political left, however, people view the issue quite differently than they did a decade ago, according to Leiserowitz, the director of the Yale program. Liberal Democrats view global warming as their No. 3 voting issue, with environmental protection as No. 2, he said. Compare that to conservative Republicans, who rank global warming dead last on a 29-issue list.
If the CNN climate crap analyst was actually aware of the science, the political dichotomy wouldn’t have been a surprise. Those who favor collectivism (AKA Marxism) also tend to view the weather as a climate crisis. While hose who favor individual liberty and prosperity, tend to view the weather as something to dress for.
He then finishes in the most hilarious fashion…
There’s hope, though
OK, so about that hope.The bright spot — and it truly is a bright one — is… Greta Thunberg, the…
Greta Thunberg, the disgruntled, misinformed and probably abused teenager…

Happy New Year! Welcome to the last year of the second decade of the twenty-first century!
Is anyone else annoyed by all the new decade nonsense? There was no Year Zero, except in the classic Ray Milland movie. All millennia, centuries and decades Anno Domini begin with one, not zero.
References
Alley, R.B. 2000. “The Younger Dryas cold interval as viewed from central Greenland”. Quaternary Science Reviews 19:213-226.
Alley, R.B.. 2004. “GISP2 Ice Core Temperature and Accumulation Data”.
IGBP PAGES/World Data Center for Paleoclimatology Data Contribution Series #2004-013. NOAA/NGDC Paleoclimatology Program, Boulder CO, USA.
Church, J. A., and White, N. J. ( 2006). “A 20th century acceleration in global sea‐level rise”. Geophys. Res. Lett., 33, L01602, doi:10.1029/2005GL024826.
Church, J.A., White, N.J., 2011. “Sea-level rise from the late 19th to the early 21st Century”. Surv. Geophys. https://ift.tt/1C1L8EK.
Jevrejeva, S. , J.C. Moore, A. Grinsted, A.P. Matthews, G. Spada. 2014. “Trends and acceleration in global and regional sea levels since 1807”. Global and Planetary Change. %vol 113, 10.1016/j.gloplacha.2013.12.004 https://ift.tt/2Xf756b
Maibach, E., Perkins, D., Francis, Z., Myers, T., Englbom, A., et al. (2016). A 2016 National Survey of American Meteorological Society Member Views on Climate Change: Initial Findings. George Mason University, Fairfax, VA: Center for Climate Change Communication.
MacFarling-Meure, C., D. Etheridge, C. Trudinger, P. Steele, R. Langenfelds, T. van Ommen, A. Smith, and J. Elkins (2006). “Law Dome CO2, CH4 and N2O ice core records extended to 2000 years BP“. Geophys. Res. Lett., 33, L14810, doi:10.1029/2006GL026152.
Moberg, A., D.M. Sonechkin, K. Holmgren, N.M. Datsenko and W. Karlén. 2005. “Highly variable Northern Hemisphere temperatures reconstructed from low- and high-resolution proxy data”. Nature, Vol. 433, No. 7026, pp. 613-617, 10 February 2005.
Oerlemans, J. “Extracting a climate signal from 169 glacier records”. Science (80-. ). 2005, 308, 675–677, doi:10.1126/science.1107046.
Stein, R. , Fahl, K. , Schade, I. , Manerung, A. , Wassmuth, S. , Niessen, F. and Nam, S. (2017), Holocene variability in sea ice cover, primary production, and Pacific‐Water inflow and climate change in the Chukchi and East Siberian Seas (Arctic Ocean). J. Quaternary Sci., 32: 362-379. doi:10.1002/jqs.2929 stein2017
Stenhouse, N., A. Harper, X. Cai, S. Cobb, A. Nicotera, and E. Maibach, 2017: Conflict about Climate Change at the American Meteorological Society: Meteorologists’ Views on a Scientific and Organizational Controversy. Bull. Amer. Meteor. Soc., 98, 219–223, https://doi.org/10.1175/BAMS-D-15-00265.1
via Watts Up With That?
January 1, 2020 at 08:56PM
