
ike tortoises, nuclear power plants can have long, prosperous lives, whereas short-lived wind and solar facilities are “hare” today, gone tomorrow.
via CFACT
August 5, 2024 at 11:06PM
ike tortoises, nuclear power plants can have long, prosperous lives, whereas short-lived wind and solar facilities are “hare” today, gone tomorrow.
via CFACT
August 5, 2024 at 11:06PM
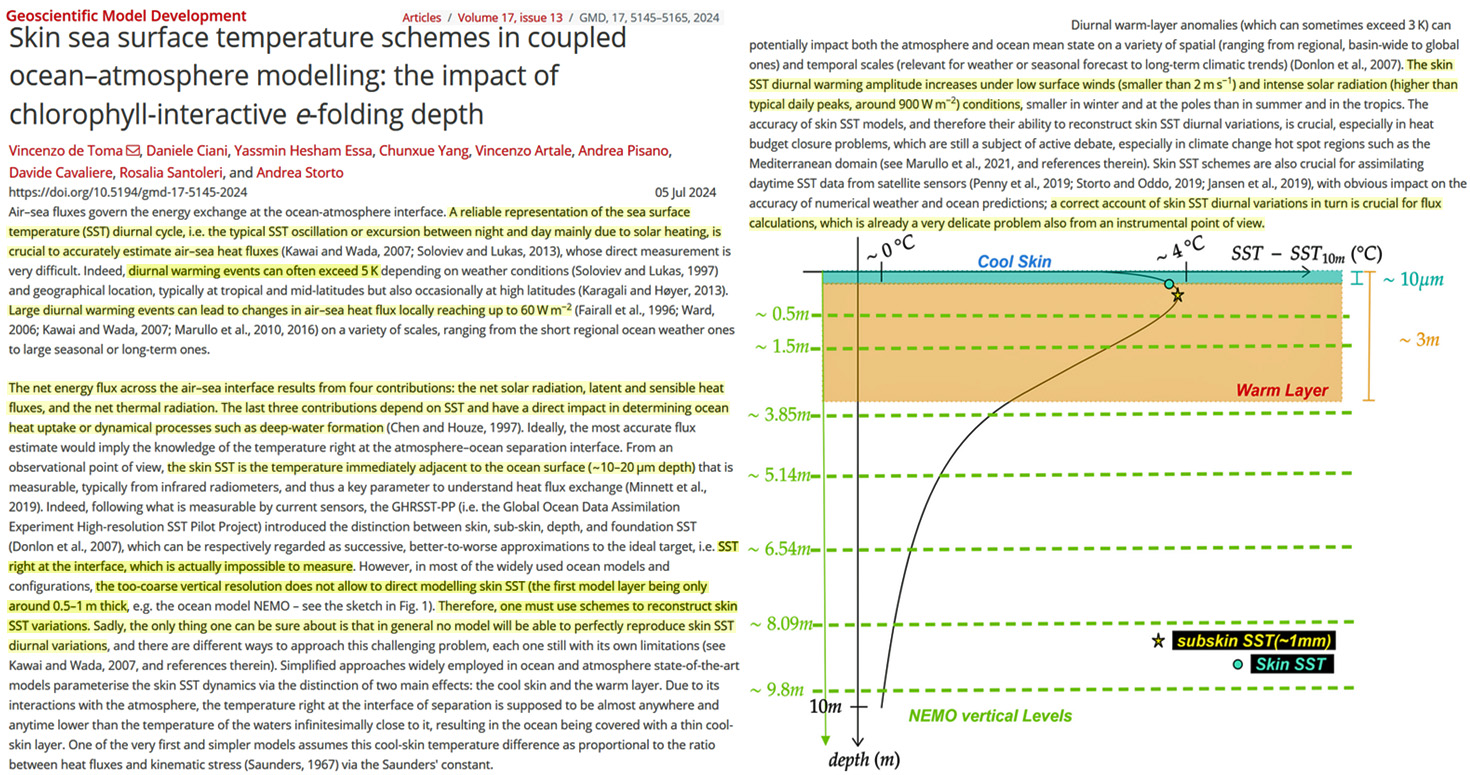
A new study reveals the limit of the greenhouse gas-induced longwave radiative impact extends only to the ~10 μm (0.01 mm) skin layer – the ocean-air interface – and no deeper.
Determining the sea surface temperature (SST) variation at this skin depth is critical to any attempt to quantify or calculate the impact of greenhouse gases like CO2 on ocean temperatures. Yet scientists admit such temperature variations are “impossible” to measure at this depth.
Instead, temperature variations in the skin layer must be “schemed” (which is little different than saying guessed) using models that only begin at the 500 to 1,000 mm (0.5 to 1.0 m) layer depths. This means, of course, that CO2’s effects on ocean temperatures are also impossible to measure.
“SST right at the interface, which is actually impossible to measure”
“…the too-course vertical resolution does not allow to direct modeling skin SST (the first model layer being only around 0.5 – 1.0 m thick”…). Therefore, one must use schemes to reconstruct skin SST variations.”
The authors of the paper actually do not even mention greenhouse gas-induced changes as factors affecting – much less driving – variations in ocean heat flux at the interface. The only causal factors mentioned in determining energy changes in the ocean-air system critical to “global warming” are variations in solar radiation and wind speed.
“The net energy flux across the air-sea interface results from four contributions: the net solar radiation, latent and sensible heat fluxes, and the net thermal radiation. The last three contributions depend on SST and have a direct impact in determining ocean heat uptake…”
“The skin SST diurnal warming amplitude increases under low surface winds (smaller than 2 m s−1 ) and intense solar radiation (higher than typical daily peaks, around 900 W/m²) conditions…”
Apologists for anthropogenic global warming (AGW) have advanced the hypothesis that greenhouse gas-induced changes in downwelling longwave radiation (DLWR) can affect changes in the thermal gradient at the skin layer depths, thus reducing or enhancing cooling.
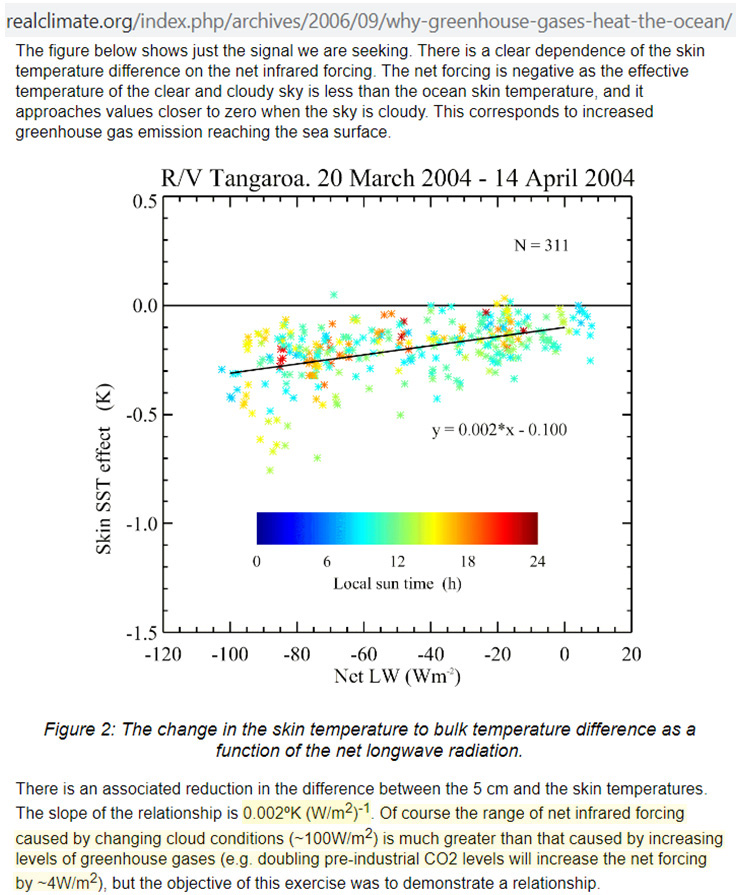
However, in a blog article he composed for RealClimate back in 2006, Dr. Peter Minnett reported the results of a 2004 experiment using cloud-induced DLWR changes as a proxy for CO2-induced DLWR changes. Clouds needed to be used as a proxy because CO2’s longwave effects are too small to detect, as they are acknowledged to be 50 times smaller than cloud longwave effects.
The results of the experiment revealed the thermal gradient change was merely 0.002°C (two one-thousandths of a degree) for a ~100 W/m² DLWR change in cloudiness. Because cloud forcing is 50 times larger than CO2 forcing (~2 W/m² since 1750), CO2’s impact, dividing the 0.002°C cloud value by 50, is thus 0.00004°C. This is four one-hundred-thousandths of a degree.
Obviously this specified quantification marks how ridiculous it is to believe that CO2 can be a causal mechanism – much less a driving mechanism – for global ocean temperature changes.
via NoTricksZone
August 5, 2024 at 08:12PM

Overview
The summer is more than half over up in the Arctic region and overall temperatures this season are repeating a pattern that began many years ago in that they are running at nearly normal levels which happens to be quite close to the freezing mark. The cold season in the Arctic has featured above-normal temperatures in the Arctic region in a pattern that has also been very consistent in recent years. It is the temperatures in the summer months of June, July, and August, however, which are the most important when it comes to Arctic sea ice extent as this is the melting season up in that part of the world. As long as temperatures remain nearly normal during the summer (melting) season, the chance for any additional significant drop off in sea ice will be limited. Indeed, given this consistent summertime temperature trend in recent years, Arctic sea ice has shown resiliency both in terms extent and in volume. One possible explanation of this persistent temperature pattern across the Arctic region with nearly normal summertime conditions and warmer-than-normal in the other nine months of the year (i.e., the cold season) is increased levels of water vapor in the atmosphere.


Arctic temperatures and the impact on sea ice
Temperatures have followed a persistent trend in the Arctic region during the past several years, in fact, going all the way back to the beginning of the 21st Century. Specifically, temperatures have been running at nearly normal levels during the all-important summer (melting) season of June, July, and August and then usually at well above-normal levels during the remaining nine months of the year.

Nearly normal temperatures in the summer months of June, July and August are typically at levels near or just above the freezing mark and as long as they remain there during the melting (summer) seasons, chances for any significant drop-off in Arctic sea ice will be limited. Well above-normal temperatures in the other nine months of the year have minimal impact on the melting of Arctic sea ice as they are typically well below the freezing mark. Indeed, with this dependable temperature trend in recent years, Arctic sea ice has been rather resilient both in terms of extent and volume.

Arctic sea ice extent has been running at below-normal levels since the middle 1990’s at which time there was an important shift in the Atlantic Multidecadal Oscillation (AMO) to one featuring warmer-than-normal sea surface temperatures in the North Atlantic Ocean. The Arctic sea ice extent headed steadily downward after that shift and reached its lowest point in 2012 at levels not seen before during the satellite era which goes back to the late 1970’s. Since then, Arctic sea ice extent has held rather steady with a general sideways trend during the past decade or so.
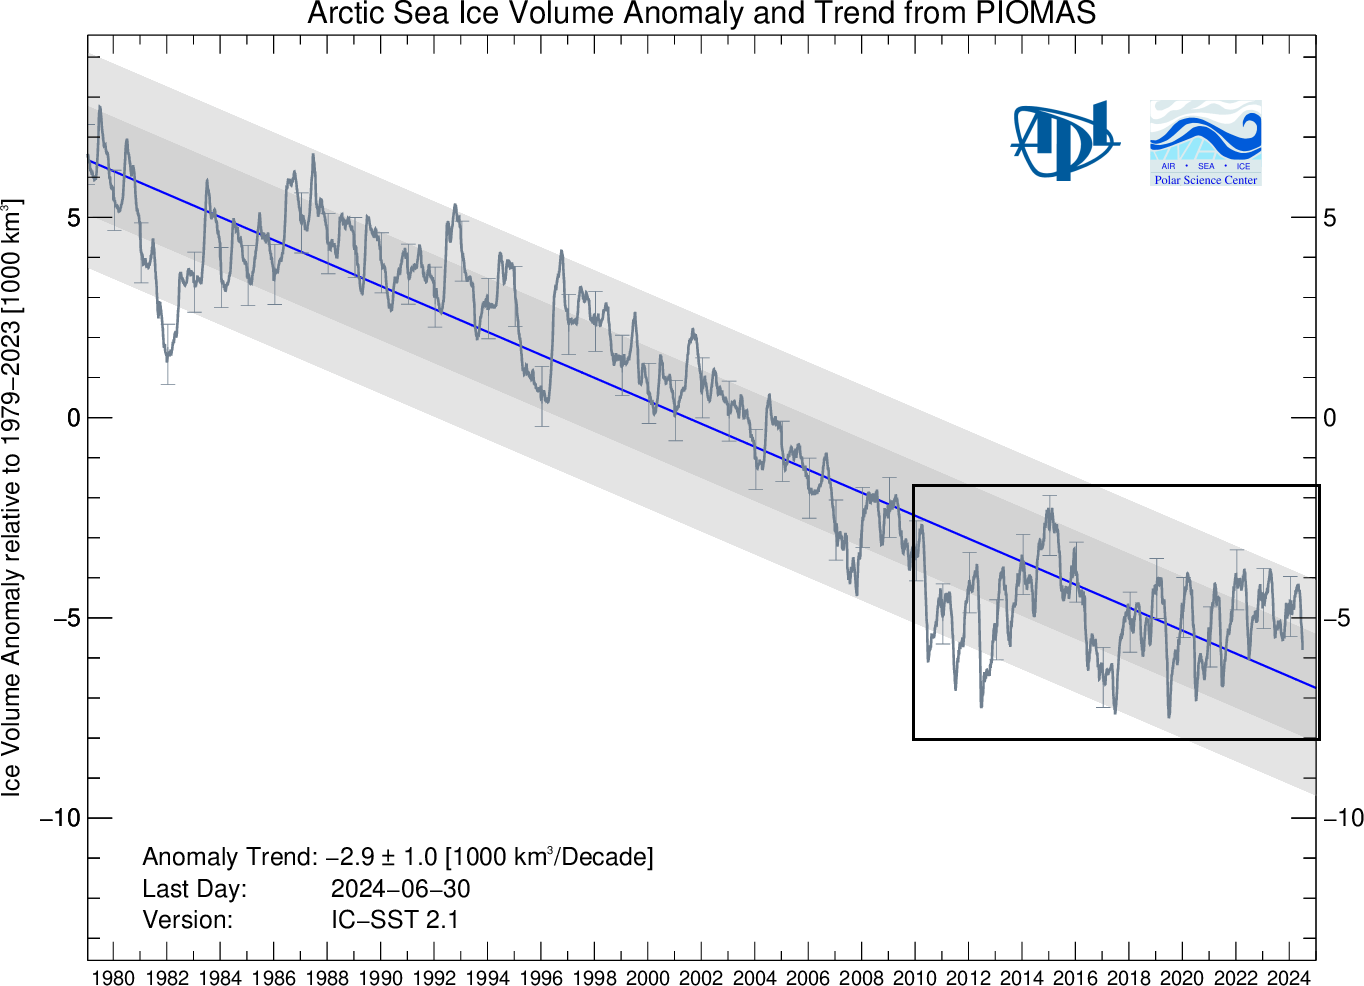
In addition to sea ice extent, an important climate indicator to monitor is sea ice volume as it depends on both ice thickness and extent. Arctic sea ice volume is difficult to monitor on a continuous basis as observations from satellites, submarines and field measurements are all limited in space and time. As a result, one of the best ways to estimate sea ice volume is through the usage of numerical models which utilizes all available observations. One such computer model comes from the University of Washington and is called the Pan-Arctic Ice Ocean Modeling and Assimilation System (PIOMAS, Zhang and Rothrock, 2003). This model-derived Arctic sea ice volume shows a steady downward trend from the middle 1990s to the low point that was reached in 2012. Since then, Arctic sea ice volume has been showing resiliency with a general sideways trend during the past several years.

Possible role of water vapor
One possible explanation for the behavior of temperatures in the Arctic region during the past couple of decades has to do with increased amounts of water vapor in the atmosphere. Overall, water vapor content has been higher-than-normal in the Arctic region during the past couple of decades largely as the result of warmer-than-normal sea surface temperatures in both the North Atlantic (positive AMO) and the Pacific Ocean (multiple El Nino events).
Given the warmer-than-normal water temperatures, there has been increased evaporation and this, in turn, generates more overall water vapor in the atmosphere. An increase in water vapor will have a much bigger impact on temperatures in very cold and dry atmospheres and less of an impact in a warmer and more humid environment. In other words, an increase in overall water vapor could very well result in warmer-than-normal temperatures during the cold seasons in the Arctic region when it is typically very cold and dry, and likely have little, if any, impact during the warmer, more humid summer (melting) season.
Meteorologist Paul Dorian
Arcfield
arcfieldweather.com
via Watts Up With That?
August 5, 2024 at 08:01PM
After many months of being home bound by debilitating pain, we were back on the trail today facing the existential threat of 400PPM CO2.
Just having fun
This entry was posted in Uncategorized. Bookmark the permalink.
via Real Climate Science
August 5, 2024 at 07:31PM
