News come from renewables trailblazing Australia including signs there and around the world that wind and solar power are losing their momentum. From the Australian by way of John Ray is the article The sun is setting the renewables ‘superpower’ fantasy of the Australian Left. Excerpts in italics with my bolds and added images.
Renewable energy superpower status is supposedly in Australia’s grasp now the government has given Mike Cannon-Brookes the green light to export solar power to Singapore.
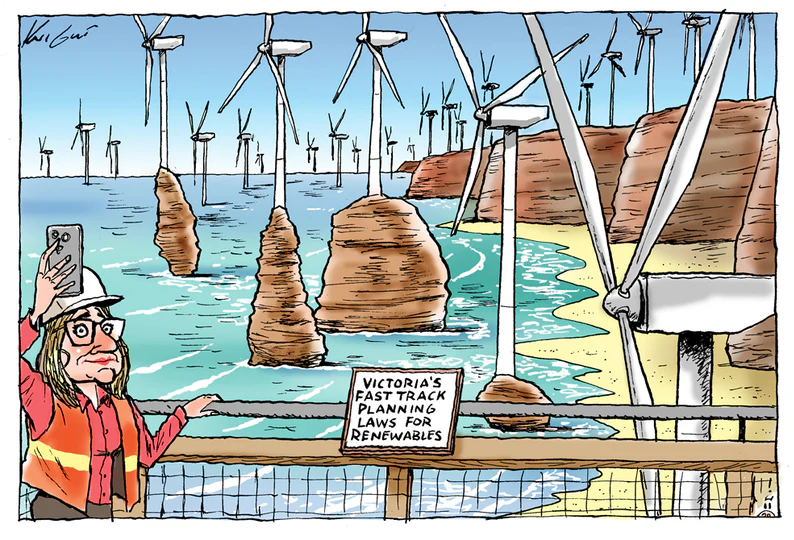
Sky News Business Editor Ross Greenwood says Australia’s largest solar farm to date has been given the “green light” by the Environment Minister Tanya Plibersek. Plibersek announced environmental approval for the tech billionaire’s eccentric proposal last week, taking a swipe at Peter Dutton’s “expensive nuclear fantasy that may never happen”.
By contrast, the Environment Minister would have us believe Cannon-Brookes’s plan to siliconise the NT Outback is a done deal. All that’s left to do is:
raise $35bn in capital, install 120 square kilometres of solar panels, build a modest 788km transmission line to Darwin, and lay a 4200km high-voltage cable on the seabed, and we’re good to go.
The Sun Cable AAPowerLink project feels like it was stolen from a Heath Robinson cartoon: a convoluted, unnecessarily elaborate, and impractical contraption designed to accomplish a mundane task. It may mark the beginning of the end of the renewable romance, the point at which the transition to wind, solar and hydropower collapses under the weight of its own absurdity.
There is increasing evidence the US has reached the point of peak renewables, as the pool of private investors shrinks and winning community approval becomes harder. Research by the Lawrence Berkley National Laboratory showed roughly one-third of utility-scale wind and solar applications submitted over the past five years were cancelled, while about half of wind and solar projects experienced significant delays.
The US Department of Energy says the national electricity networkneeds to grow by 57 per cent by 2035, the equivalent of approximately 21,000 km a year. Last year’s total was around 200 km, downfrom just over 1000 in 2022.
Meanwhile, the challenges of grid synchronisation and storage remain unresolved, and the technical problems for offshore wind turbines, in particular, are mounting. Last week, turbine manufacturer GE Vernova announced an investigation into a blade failure in the 3.6GW Dogger Bank project in the North Sea off the coast of the UK. It is the third blade failure this year.
In July, a newly installed blade crumbled at the Vineyard Wind offshore plant, creating debris that washed up on Nantucket Island, Massachusetts. At 107 metres long and weighing 55 tonnes, they are the most enormous blades deployed commercially. The failure of three in quick succession suggests the quest to increase output by installing ever-larger blades has reached its natural limits.
Yet the imperative of expanding generating capacity is hardening.
The principal driving force is not electric vehicles but the rapid growth of artificial intelligence. AI requires at least 10 times the power of conventional computing programs.
In the US, data centres account for about 2.5 per cent of power and demand could rise to 7.5 per cent by 2030, according to Boston Consulting Group. In Ireland, data processing and storage use 12 per cent of electricity produced, forcing the authorities to limit the number of connections to the grid.
Silicon Valley has long abandoned the notion it can be powered by silicon photovoltaic panels while burying stray emissions in the Amazon forests.
In April, the tech giant Amazon paid the best part of $1bn ($US650m) for a sizeable block of land next to Pennsylvania’s Susquehanna nuclear power station. It will be the site for a data centre powered by up to 480MW of carbon-free electricity delivered reliably around the clocky.
Shares in US nuclear power companies such as Consolidated Energy, Talem and Vistra have soared by between 80 per cent and 180 per cent in the past year. So-called green energy stocks, on the other hand, are static or falling, while coal is making an unexpected comeback.
In May, the Financial Times reported that the retirement dates for coal-fired power stations are being pushed back as operators become concerned about grid security. Allianz Energy has delayed the conversion of its Wisconsin plant from coal to gas for three years to 2028. Ohio-based FirstEnergy announced in February that it was scrapping its 2030 target to phase out coal, citing “resource adequacy concerns”.
The effect of AI on electricity demand was largely unanticipated at the beginning of the decade. AI chips will undoubtedly become more efficient, but there is no telling how much further the demand for AI will grow since the technology is in its infancy. Nor can we begin to guess what other power-hungry forms of technology might be developed by 2050.
What we do know, however, is that if Australia’s demand for electricity exceeds 313 TWH a year in a 2050, we’re in trouble. That’s the target the Australian Energy Market Operator has set in its updated blueprint for the great electricity transition.
As Chris Bowen points out, that’s going to take a lot solar panels and wind turbines. The Energy Minister says we need 22,000 new solar panels a day and a new 7MW wind turbine every 18 hours just to meet our 2030 target of a mere 202 TWH. For the record, the speed of the rollout in the first two years of Labor government is less than a tenth of that.
One of the hallmarks of the anointed is an unwavering conviction
in the integrity of their analysis and
the effectiveness of their proposed solutions.
They feel no need to hedge their bets by factoring in contingency arrangements should their predictions turn out to be wrong. Nothing in AEMO’s Integrated System Plan indicates its experts have given any thought to scaling up electricity production in line with actual demand, which may well be considerably higher than they’ve anticipated.
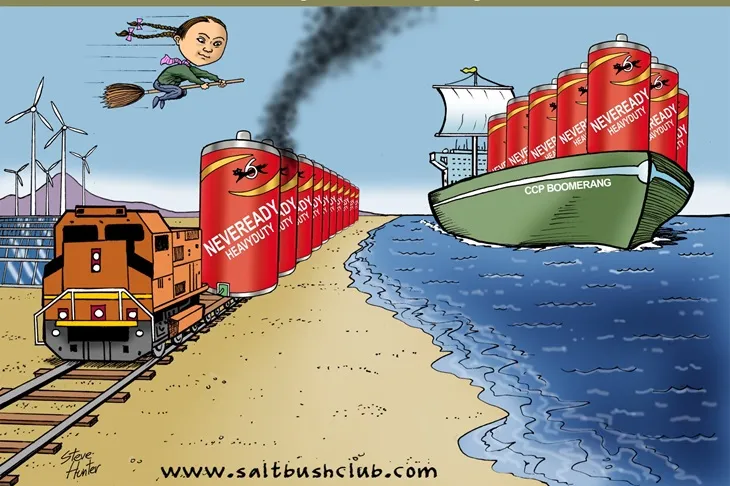
If they had, they would have to acknowledge that there are limits to the renewable energy frontier determined by energy density, the demand for land and the requirement for firming. The silicification of northern Australia cannot continue forever, nor can we expect to rely on China for most of the hardware and pretend there are no geopolitical consequences.
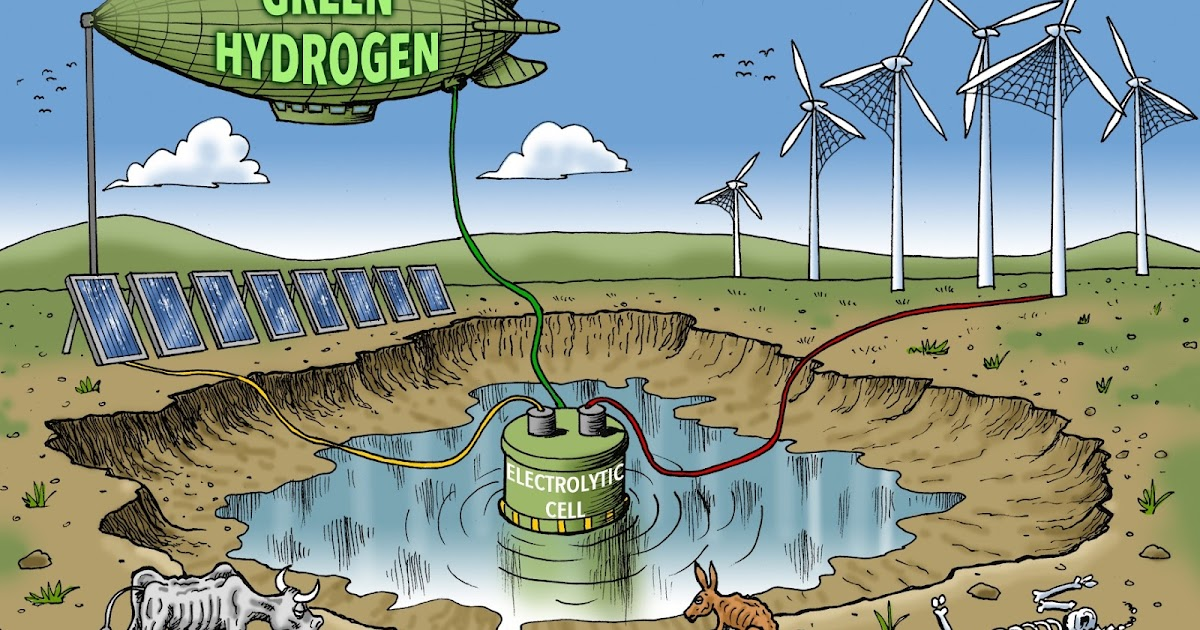
As for our nuclear-phobic Prime Minister’s dream of turning Australia into the Saudi Arabia of green hydrogen, while simultaneously sitting at the cutting edge of quantum computing, forget it. In 2006, as the shadow minister for the environment, Anthony Albanese gave a speech at the Swansea RSL on avoiding dangerous climate change.
“Why on Earth would we want to take the big health and economic risk of nuclear energy when we have a ready-made power source hovering peacefully in the sky every day?” he asked.
If Albanese doesn’t know the answer to that question 18 years later, he probably never will.
Human Progress excerpted a paywalled article from Bloomberg discussing the fact that major crops are expected to continue to set records in the 2024/2025 crop year. This good news is not unexpected for anyone who understands agronomy and botany or who regularly reads Climate Realism. It reflects the long-term trend for most crops during the period of modest warming and increased atmospheric carbon dioxide (CO2) concentrations. Sadly, Bloomberg’s story ignores the proven and significant role rising CO2 levels are playing in improved crop yields and production.
Human Progress writes:
Compared with a decade ago, the world will harvest in 2024-25 about 10% more wheat, about 15% more corn, nearly 30% more soybeans, and about 10% more rice. Except for corn, all the other three key food commodities will enjoy a record high production.
[T]he US Department of Agriculture said it anticipates American farmers will reap record yields for two key food commodities: on average, 183.1 bushels per acre of corn, and 53.2 bushels per acre of soybeans…
Two decades ago, US corn farmers were harvesting about 150 bushels per acre; in the mid-1980s, the number was closer to 110 bushels.
This good news further confirms what Climate Realism has long pointed out. Modestly warmer weather and higher CO2 levels are good for plants in general, leading to a net greening of the earth and boosting yields and production of crops. In fact, the most recent data from the U.N. Food and Agriculture Organization (FAO) show that globally the yield and production of cereal crops (the crop segment that makes up the majority of the calorie intake each day, often referred to as staple foods, rice, wheat, rye, oats, barley, millet, and maize, for example), have increased dramatically over the recent period slight warming. Between 1990 and 2022, the most recent year for which the FAO has data:
Cereal yields have increased nearly 52 percent, with the most recent record for yield set in 2022; and
Cereal production grew by approximately 57 percent. (see the chart, below)
Unfortunately, Bloomberg downplays or ignores entirely the role warming and rising CO2 have played in record crop yields and production, attributing the record setting crop production to expanded irrigation and better technologies like improved combines and tractors. Although improved technologies and wider access to them has undoubtedly contributed to the increase in crop production, research thoroughly demonstrates that so to have CO2 increases. Indeed, higher CO2 levels may have been the most significant factor driving crop increases in recent decades.
As has been discussed in more than 200 articles on Climate Realism, what is true of global cereal production, is true for most crops, like fruits, legumes, tubers, and vegetables, in most countries around the world. Yields have set records repeatedly during the recent period of climate change, food security has increased, and hunger and malnutrition have fallen.
Agronomy and Botany explain why crop production and yields have increased amidst global warming, and the same sciences explain why the world should likely expect crop production gains to continue. Modest warming has brought slightly higher rainfall totals, and a modestly longer growing season with fewer crop-killing late-season frosts. In addition, crops are benefitting from higher carbon dioxide levels in the atmosphere, which any greenhouse operator will tell you is plant fertilizer, contributing to plants growing larger, faster, and using water more efficiently.
Thousands of real-world field and greenhouse experiments summarized at CO2 Science document the beneficial effect on higher CO2 concentrations on plant growth and crop production. Even NASA has acknowledged this point, writing:
Studies have shown that higher concentrations of atmospheric carbon dioxide affect crops in two important ways: they boost crop yields by increasing the rate of photosynthesis, which spurs growth, and they reduce the amount of water crops lose through transpiration. Plants transpire through their leaves, which contain tiny pores called stomata that open and collect carbon dioxide molecules for photosynthesis. During that process they release water vapor. As carbon dioxide concentrations increase, the pores don’t open as wide, resulting in lower levels of transpiration by plants and thus increased water-use efficiency.
[S]atellite-based studies have yielded compelling evidence of stronger general growth effects than were anticipated in the 1990s. Zhu et al (2016) published a comprehensive study on greening and human activity from 1982 to 2009. The ratio of land areas that became greener, as opposed to browner, was approximately 9 to 1. The increase in atmospheric CO2 was just under 15% over the interval but was found to be responsible for approximately 70% of the observed greening, followed by the deposition of airborne nitrogen compounds (9%) from the combustion of coal and deflation of nitrate-containing agricultural fertilizers, lengthening growing seasons (8%), and land cover changes (4%), mainly reforestation of regions such as southeastern North America.
It is refreshing to see a major media outlet, like Bloomberg, publish some good news about crop production amid the near constant drum beat of false “climate change induced crop failure” stories put out by the mainstream media. One can only speculate why its writers ignored the firmly established roles that modest warming and more CO2 have played over the decades and continue to play in the increase in food production.
H. Sterling Burnett, Ph.D., is the Director of the Arthur B. Robinson Center on Climate and Environmental Policy and the managing editor of Environment & Climate News. In addition to directing The Heartland Institute’s Arthur B. Robinson Center on Climate and Environmental Policy, Burett puts Environment & Climate News together, is the editor of Heartland’s Climate Change Weekly email, and the host of the Environment & Climate News Podcast.
Over on Ned Nikolov’s thread discussing his and Karl Zeller’s new paper, Robert Cutler posted an interesting graph he’s plotted, showing solar inertial motion and it’s possible connection with a terrestrial climate oscillation known as the Eddy cycle. Robert says:
I believe the Eddy cycle to be 938 years long. This is based on spectral analysis of the sun’s acceleration around its barycenter. The phase of the plotted sine wave is based on the complex Fourier coefficient at the spectral peak. This is the planetary forcing, not the sun’s response, or the earth’s response to changes in solar activity, so while the sine wave has a peak around 1968, peak temperatures are likely to occur a number of decades later. I’ve also annotated a few other cycles of interest.
There is discussion to be had concerning Robert’s comments about phasing and lags, but this post will focus on the periodicities enumerated in the frequency plot in the bottom panel.
Observations
These peaks in the acceleration of the Sun around the solar system barycentre occur at 938yr (Robert’s proposed Eddy cycle period), 165yr (Neptune’s orbital period), 84yr (Uranus orbital period), 61yr (Jupiter-Saturn Axial rotation period) and at two sidebands around 65yr and 57yr (due to the interaction of the 61yr and 938yr periodicities).
It’s also worth noting the periodicities of minima in the acceleration. Two of these occur between the 938yr and 165yr peaks, at ~400yr and ~200yr. Another two occur between the 165yr and 84yr peaks, at ~135yr and ~97yr. Finally, two more minima occur close to the sideband maxima of 65yr and 57yr.
Discussion
The changing rate of acceleration of the Sun around the barycentre is controlled by the motion of the four gas giant planets. It’s not too surprising then, that we see peaks in acceleration relating to their orbital periods. It’s an indication of the well integrated timings of the motions of the planets. An indication that the gas giant’s orbits and syzygies have also shaped the orbits of the smaller planets is found in another observation relating to Earth. Every 83 and 166 years, The Earth, Jupiter and the Sun align on the same day of the Earth year. This holds true even as the Earth’s seasons slip through the precession of the equinox during a 25,771yr cycle. One implication of this is that orbit-spin coupling is in operation between Gas giant orbital motion and Earth spin-axis precession.
The 200yr and 400yr minima could be connected to the de Vries cycle and it’s pair (10.5 and 21 J-S). These would be in 9:2 and 9:4 ratios with 938 year period. The 97 yr could be half the 193yr solar magnetic cycle, which is also the beat period of 61.1 and 166 years.
There is much more to be said and hypothesised here, but let’s throw it all open for discussion and see where that leads us.

 raise $35bn in capital,
 The US Department of Energy says the national electricity network needs to grow by 57 per cent by 2035, the equivalent of approximately 21,000 km a year. Last year’s total was around 200 km, downfrom just over 1000 in 2022.