Month: August 2024

Death by Numbers: Wind Industry Can’t Avoid Mounting Whale Carcass Count

The offshore wind industry is taking a pounding for its pointless slaughter of whales, dolphins and more. And rightly so. While the US Federal government has provided wind power outfits with a license to kill, the general public are not so forgiving. And they’re growing hostility represent a whale-sized political problem for offshore wind.

Once upon a time, environmentalists were known for hugging trees and saving whales. These days, modern eco-fascists couldn’t care less about either.

Thankfully, the unhinged zealots that back wind and solar as the only true method of ‘saving the planet’ – like the sociopath seen in the video above – represent a shrinking and tiny (albeit vocal) minority.

Slowly but surely, they are being replaced by people with a true and genuine concern about the world they live in; a world in which charismatic mega-fauna might be left unmolested to go about their business on the high seas.

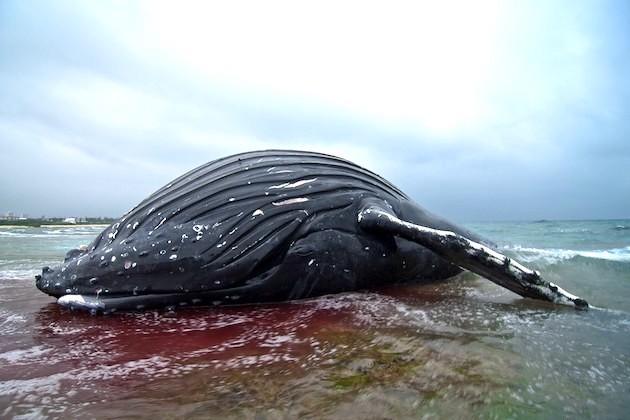
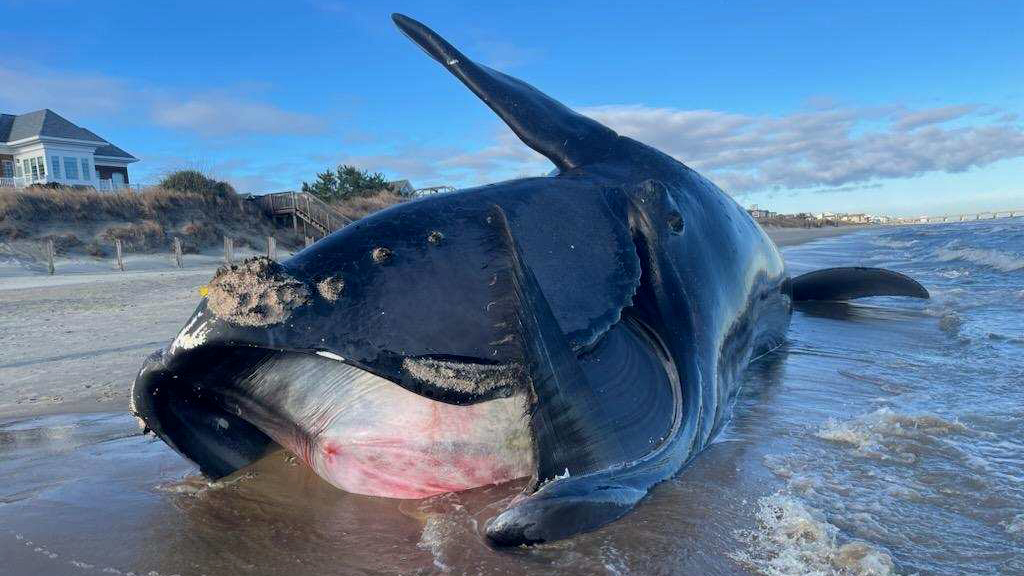
In the articles below, David Wojick draws focus on the mounting whale carcass count that the offshore wind industry can no longer avoid, and which their government enablers can no longer excuse.

Offshore wind whale deaths indicated by statistical analysis
CFACT
David Wojick
22 July 2024

Systematic statistical analysis indicates that offshore wind development has likely been killing lots of whales since it began around 2016. This long-standing conjecture that wind kills whales may be confirmed.

Call it forensic statistical epidemiology. The epidemic is the huge number of Northwest Atlantic whale deaths that were first officially observed by NOAA in 2016-17, and that continued to this day. It is forensic because killing whales can be highly illegal.

This math feat was performed by Apostolos Gerasoulis, a Rutgers professor emeritus of computer science. This is a computer math problem, not a biological one, so he is exceptionally qualified. See https://www.cs.rutgers.edu/people/professors/details/gerasoulis-apostolos

Professor Gerasoulis has confirmed with profound statistical evidence the widespread conjecture that offshore wind sonar surveys have been killing whales. There is now no reasonable doubt that the extensive sonar harassment authorized by NOAA since 2016 has caused the massive increase in whale deaths that NOAA first flagged in 2016-17.

Here is a lengthy article that provides some of that compelling evidence:

https://climatechangedispatch.com/professor-makes-stunning-discovery-absolutely-100-percent-offshore-wind-kills-whales/

Given that I and others have been yelling at NOAA about this for two years, it is not a stunning discovery to us, just tragic proof that we were right. For example:

https://www.cfact.org/2022/09/27/how-to-kill-whales-with-offshore-wind/

And https://www.cfact.org/2023/01/23/evidence-says-offshore-wind-development-is-killing-lots-of-whales/

I have repeatedly pointed out that the overall Humpback Whale death rate doubled when sonar blasting began. Gerasoulis finds that in the region where the surveying was most active, the death rate jumped to an astonishing five times greater.

It took a computer guru to do this pioneering work because it is a complex computation problem. He geographically logged all of the deaths and all of the sonar blasting routes over time, then looked at the correlations, which are profound. It is statistically impossible that these correlations between sonar blasting and dead whales are just a coincidence.

Note that the sonar blasting does not kill the whales outright. It is predicted by NOAA to change the whale’s behavior, so all it has to do is change it in deadly ways, such as causing a ship strike. It is actually expected by NOAA that some whales will be deafened.

Here is a telling analogy. A firecracker thrown at a dog causes it to run into the street and be struck by a car. The car killed the dog, but the firecracker caused the death. In science, this is called the first cause (firecracker) versus the final cause (car strike) of the dog’s death. Sonar blasting is like an endless string of firecrackers going off, lasting for hours or even days.

The press has consistently ignored the warnings, never reporting the potentially adverse effects of “harassment”, as it is officially called. That widespread acoustic harassment is actually predicted and authorized by NOAA is never even mentioned. Even worse, NOAA never mentions it in their online material on the whale death crisis despite it being pointed out to them repeatedly.

Unfortunately, the incredibly loud pile driving that is now starting at the offshore wind construction sites is even worse than the sonar blasting. The NOAA harassment authorization numbers are much higher, ten times higher in some cases. We, therefore, expect the deaths to increase unless decisive action is taken.

Now that the numbers indicate that authorized harassment is likely the cause of widespread whale death, something must be done to stop the carnage. If NOAA continues to authorize potentially deadly harassment without first studying the data, and if wind developers continue unabated, each whale death is a reckless violation of the Marine Mammal Protection Act. Gerasoulis‘s statistical model may even tell us when this happens.

Given this compelling new evidence, if NOAA still refuses to act, then either the President or Congress should do so. Acoustic harassment is ongoing, and whales may be dying from it. This reckless killing of whales must stop.
CFACT

Feds must rethink authorizing harassment of whales by offshore wind
CFACT
David Wojick
14 August 2024

We now know offshore wind sonar surveys are a likely cause of whale deaths. For details, see my prior article.

Simply put, a significant fraction of authorized harassments likely causes whales to be killed.

The question is how should the Federal approval process for offshore wind surveys be restructured to incorporate this new whale-death knowledge? One obvious possibility is to simply ban the practice. That works for me, but may be too extreme to pull off.

If a certain number of whale deaths is deemed allowable, here is the outline of a death allocation procedure. Included are the other protected marine species for which sonar-induced deaths might be established, as well as harassment from other offshore wind activities. This is basically a death budget for the offshore wind program.

There are three offshore zones for which the following six steps should be done — Atlantic, Pacific and Gulf of Mexico.

  1. The federal Bureau of Ocean Energy Management (BOEM) identifies the existing leases and leases in process or likely to become so. For each lease, they estimate the potential generating capacity of each as well as the likely technologies and life cycles thereof.
  2. The National Marine Fisheries Service (NMFS) determines the harassment potential over time for each lease, for each exposed endangered and protected species. All relevant forms of harassment are considered, including noise, wake effects, and physical presence.
  3. NMFS determines the mortality impact of the combined harassment for all leases on each species. The new statistical procedure pioneered by Professor Gerasoulis likely plays a major role here.
  4. NMFS determines the allowable amount of harassment that will have no adverse effect on the population of each species.
  5. NMFS and BOEM jointly develop an administrative procedure for allocating the allowable harassment authorization to the leases. If Step 4 cannot be done, I suggest the allowable amount for all leases combined be limited to ten percent or less of the exposed population for each species. We need a default limit on allowable deaths.
  6. NMFS allocates harassment authorizations in accordance with the established procedure. These allocations may be adjusted over time as knowledge and technology changes.

No development that creates harassment can occur without authorization. Note that the numerous planned and in development offshore wind projects are at very different stages of federal development:

  • Operational
  • Under construction
  • Approved for construction
  • In the process of approval
  • Leased but not yet applied for approval
  • Not yet leased

Projects in different stages might get different allocation treatment, especially the advanced projects that already have big authorizations that now have to be restricted.

Of course lots of death research is now needed. This includes for other critters besides whales, especially dolphins, whose harassment numbers are huge. It also includes the other stages of development besides sonar surveys. For example, construction harassment allocation numbers run ten times or more greater than survey numbers. Then, there is operations harassment, which NMFS has yet to recognize.

The Marine Mammal Protection Act (MMPA) needs to be rethought as well. It clearly was never designed to handle the hundreds of thousands of harassment authorizations that are being doled out to the offshore wind developers. This is painfully true now that we know numerous whales are being killed because of harassment.

The big question is whether unavoidable yet deadly offshore wind harassment is even legal under the MMPA and the Endangered Species Act.
CFACT

via STOP THESE THINGS

https://ift.tt/g27a6QO

August 28, 2024 at 02:31AM

US CLIMATE REFERENCE NETWORK – PRISTINE DATA

Here is an interesting data set. It comes from 114 first class weather stations which are in locations that are as far as possible from any contamination from stray sources of heat, such as tarmac. concrete, buildings, traffic, aircraft, etc. What a great idea! Such a pity that our own Met Office has not tried to do the same. Surprisingly, for those who believe temperatures are rapidly increasing, the data has, so far, not shown any rising trend. As the data has only been going for 19 years, it is not long enough to show a meaningful trend, but if it continues for 30 years or more it will start to be more significant. 

Unfortunately, NOAA never reports this data in their monthly or yearly “state of the climate report.” And, mainstream media either is entirely unaware of the existence of this data set or has chosen not to report on this U.S. temperature record. 

 U.S Surface Temperature – Watts Up With That?

via climate science

https://ift.tt/gcZT2lK

August 28, 2024 at 01:47AM

Energy ‘Transition’: It’s a Federal Bribe (versus consumer demand)

“If Americans want to keep their gasoline-powered cars and their large refrigerators … be able to afford travel across their states and country … avoid European—and California—style energy poverty, their only hope is to convince politicians to end subsidies for renewables and all other forms of energy.”

It is common for advocates of renewable energy to complain about the subsidies given to fossil fuels. “We have heard testimony,” stated U.S. Senator Sheldon Whitehouse, “about the threat climate change poses to entire sectors of our economy.”

So, what are we, the federal government, doing to protect against these threats?  Actually, we are subsidizing the danger.  As we’ll hear today, the United States subsidizes the fossil fuel industry with taxpayer dollars.

Joining Sen. Whitehouse in this vein are groups like the International Monetary Fund, The Future is Electric, and the Natural Resources Defense Council.

Exaggerations

The amount of fossil fuel subsidies is very exaggerated. Whitehouse claims the U.S. subsidies in 2022 alone were $20 billion. The IMF estimated the amount earlier at $660 billion (for 2020). As the multi-year totals show in Figure 1, these claims are not accurate.

Source: Bennett, et al; U.S. Joint Committee on Taxation 2019 & 2023; U.S. EIA; Congressional Budget Office

Perhaps these claims are efforts to distract from massive renewable energy subsidies that are driving the “energy transition” from fossil fuels to renewables. As seen above, renewables received $74 billion from the U.S. government in 2010–19. They are expected to increase to $244 billion from 2020 to 2029.

The subsidies are the only reason that wind and solar generation exist on the U.S. grid at commercial scale. And are the primary reason that the U.S. grid is experiencing increasingly unsustainable levels of unreliability. The subsidies also represent a takeover of the U.S. electric grid by the federal government, following in the footsteps of the takeovers of Wall Street, health care, and education.

If Americans want to keep their gasoline-powered cars and their large refrigerators, if they want to be able to afford travel across their states and country, if they want to avoid European—and California—style energy poverty, their only hope is to convince politicians to end subsidies for renewables and all other forms of energy.

Rapid Growth of Renewable Subsidies

Energy subsidies from the U.S. government come in three forms: tax expenditures, direct expenditures, and research and development expenditures. Though the proportions vary based on the energy type, the vast majority of federal energy subsidies are in the form of tax expenditures, or tax credits.

The U.S. Energy Information Administration calculated each form of subsidy for each fuel source for the years 2016 to 2022. Figure 2 shows that for the seven-year period covered in the EIA report, renewable subsidies were more than three times greater than subsidies for fossil fuels: $83.8 billion to $25.8 billion. This relationship of the subsidies in the EIA report is reflected in our research.

        Source: U.S. Energy Information Administration

As seen in Figure 1, Bennett, et al. found that from 2010 to 2019, renewable energy subsidies were more than double the subsidies for fossil fuels, $74.1 billion to $37.9 billion. Today that gap is widening. From 2020 through 2029, subsidies for renewables are projected to be $244.9 billion compared to $22.5 billion for fossil fuels. Federal subsidies for fossil fuels have decreased by 40%, while renewable subsidies are up by 230%.

         Source: Congressional Budget Office and the U.S. Joint Committee on Taxation

While renewable subsidies increased from 2010 through 2022, their growth exploded after the passage of the Inflation Reduction Act, signed by President Joe Biden on August 16, 2022. Figure 3 shows that before the IRA became law, wind and solar generation subsidies from 2023 to 2029 were projected to total $66 billion. After the IRA, they are projected to total $174.8 billion. But this likely underestimates the level of subsidies. The original CBO estimates we use for 2028-29 have proven in earlier years to vastly understate actual costs. These increases in renewable subsidies contrast with the estimated decline in subsidies for fossil fuels over the same period (Figure 1).

The Takeover of the U.S. Electric Grid

The push for increased renewable subsidies in the IRA marked perhaps the final stage in the U.S. government’s 30-year effort to take over the U.S. electric grid. The effect the subsidies have had on the decisions made by investors in energy markets highlight the government’s success. The success is predicated on the fact that renewable energy subsidies are not only larger than subsidies for thermal generation in absolute terms but even larger on a per unit of electricity generated (Figure 4).

                                     Source: Bennett, et al

This points to the significant effect that renewable subsidies have on the profits of renewable energy generators. IBISWorld estimates that U.S. wind generators will receive $49.7 billion in revenue this year, with another $19.5 billion flowing to solar generators. At a combined $69.2 billion, this means the estimated $21 billion in federal wind and solar subsidies for 2024 will increase the return on investment for generators by 30% above what they earn for selling electricity. Generators in Texas, the nation’s leading generator of electricity from renewables, have experienced a similar boost. In 2018 federal and state subsidies for renewables totaled $2.5 billion. That added an additional 28.8% to Texas’ renewable generators bottom line above their revenue from sales.

These taxpayer-funded, government-guaranteed returns are the reason that renewable generation is swamping the U.S. electric grid and pushing investment in reliable thermal generation to the side. Investment in renewables grew from $29.4 billion in 2010 to $55.4 billion in 2019 as investors chased subsidized profits. An increase in renewable generation has predictably followed. In 2014, renewable generation totaled 279,242 gigawatt hours, only 6.8% of all electricity generated. By last year, renewable generation had increased 135% to 653,663 gigawatt hours. This equaled 15.6% of total generation. Meanwhile, generation from non-renewable sources fell by 7.6%.

Texas is also experiencing a renewable takeover. ERCOT, which manages about 90% of the Texas grid, forecasts renewable generation will increase by 58,654 megawatts through 2029 (wind by 3,628 megawatts, solar by 36,868 megawatts, and batteries, which also receive billions in subsidies, by 18,158 megawatts). Thermal resources, however, will only increase by 1,074 megawatts. Renewables are projected to make up 98.2% of new generation on the Texas grid over the next five years.

Ohio is another state that is going through the energy transition. The Solar Energy Industries Association reports that commercial solar facilities in Ohio have 2,822 megawatts installed, an increase of 1,300 megawatts from last year. Ohio ranks 15th in the nation for installed solar generation, up from 32nd from 2023. And farther ahead than Texas or Ohio is the renewable takeover in California. Wind and solar now make up 45.6% of in-state generation, far ahead of thermal generation’s 33.6%. Most of the rest comes from hydroelectric generation.

The Cost of the Energy Transition

The shift to renewables has come at great cost to Americans. In California, for instance, wholesale electricity prices were the highest in the nation last year at $67 per megawatt hour. Residential prices in California are also the highest at 34.3 cents per kilowatt hour, more than double the national average of 16.4 cents. Texas is not far behind. Residential prices are up 27% since 2021, though at 14.7 cents still well behind California.

But wholesale prices are a different matter. Wholesale prices last year were just behind California’s at $65. If Texas keeps that up, residential price hikes will follow. In Ohio, the cost of installing solar has reached $3.7 billion, a heavy price for generation facilities that are operational for less than half the day. Residential prices in Ohio are up 40% over the last decade, to 16.6 cents. The high cost of renewables extends to all Americans. Renewable subsidies are expected to cost taxpayers $318 billion from 2010 through 2029 (see Figure 1). The average annual cost from 2023 to 2029 will be about $30 billion.

The increased cost of electricity is not confined to price and tax hikes. The reliability of the U.S. grid is also taking a beating. It is a well-known fact that the reliability value of renewable energy declines as its grid penetration increases. This should not be surprising given the fact that renewables can only generate electricity when the sun is shining or the wind is blowing. This “intermittent” nature of renewables imposes a great burden on grid reliability. Texas, with its Winter Storm Uri blackouts, is the current poster child for what renewables can do grid reliability, but California is no stranger to this. Reliability costs, however, go well beyond the economic costs of blackouts (estimated to be between $80 billion to $130 billion in Texas for Uri). Over the last 10 years, Texas politicians and regulators have forced consumers and taxpayers to pony up on average about $5.8 billion a year as they try to incentivize new natural gas-fired generation that can come online when renewables fail. And the reliability problems caused by a reliance on renewables are responsible for California’s sky high electricity prices.

Conclusion

When politicians take over markets, bad things happen. Costs increase, consumer choices are thwarted, and well-connected businesses get rich off taxpayers. We see all these things happening in the U.S. energy transition from fossil fuels to renewables. The only way to eliminate these and other harms is to let the market work and eliminate all energy subsidies—federal and state—in America.

—————————–

Bill Peacock is the policy director of the Energy Alliance. The Energy Alliance (www.theenergyalliance.com) is a project of the Texas Business Coalition to raise awareness of issues about the energy market that matter the most to consumers: Reliability, Affordability, and Efficiency.

The post Energy ‘Transition’: It’s a Federal Bribe (versus consumer demand) appeared first on Master Resource.

via Master Resource

https://ift.tt/tAjrOM3

August 28, 2024 at 01:02AM

Yet More Reasons Why Green Hydrogen Is Going Nowhere

From the MANHATTAN CONTRARIAN

Francis Menton

In the fantasy of the zero-emissions electricity future, there will either be regular devastating blackouts, or something must back up the intermittent wind and solar generation. In New York we call that imaginary something the “DEFR” (Dispatchable Emissions Free Resource). But what is it? Nuclear has been blocked for decades, especially in the blue jurisdictions that are most aggressively pursuing the wind/solar future. Batteries are technologically not up to the job, and also wildly too expensive. That leaves hydrogen. Anybody with another idea, kindly speak up.

I’ve had several posts discussing the question of whether hydrogen could do this job, for example this one on February 14, 2024, and this one on July 20. Those posts focused on the initial cost of making hydrogen by electrolysis from water. That cost turns out to be a multiple of the cost of producing natural gas by drilling into rock (for comparable energy content). From time to time I have alluded to other potential problems with having hydrogen replace natural gas in the electricity system — things like leaks, explosions, and the need for an entire new infrastructure of pipelines and trucks to carry the stuff and power plants to burn it. But until now I haven’t found a detailed study on just how bad these additional problems might be.

Now comes along an August 18 article in a peer-reviewed journal called Energy Science & Engineering, with the title “A review of challenges with using the natural gas system for hydrogen.” The article was linked on August 23 by Paul Homewood at the Not a Lot of People Know That site, and then further linked by Watts Up With That on August 24.

The lead author is a guy named Paul Martin. Unusually for an article in such a journal, no academic affiliation is given for Mr. Martin. Looking him up on LinkedIn, I find that he is not an academic, but rather identifies himself as a “chemical process development expert” who has spent “years in industry,” and is currently with Spitfire Research, Inc., which in turn states that it specializes in “consulting for a decarbonized future.” Mr. Martin then identifies several of his co-authors on the paper as a “team of people at the Environmental Defense Fund.” That information may well color your perception of what Martin, et al., have to say in their paper.

The gist of the paper is that the existing natural gas infrastructure of storage facilities, pipelines and power plants absolutely cannot be repurposed for use by hydrogen; and indeed, there does not exist any practical way to transport and combust hydrogen safely on a large scale. And the effort to even try would be wildly costly. I’ll just give examples of some pithy quotes from the paper:

  • Pipeline deterioration and cracking: “Recent, extensive testing of typical pipeline materials in Europe demonstrates both acceleration of fatigue cracking and reduction in fracture toughness when hydrogen is used, but the impacts vary widely depending on the material.36 Welds and their heat-affected zones, as well as manufacturing or fabrication defects in the pipe increase vulnerability by serving as crack initiation sites.37
  • “Blending” hydrogen into natural gas is not a solution: “Even with small percentage admixtures of molecular hydrogen in high pressure natural gas pipes made of high-yield strength carbon steels it is expected that considerable acceleration of fatigue cracking, by as much as 30-fold, will occur with fracture resistance of the piping material reduced by as much as 50%.34
  • Lower volumetric energy density of hydrogen means that pipelines and storage facilities would need to be tripled in size to transport the same energy content: “Switching the gas system to pure H2, with an energy density per unit volume roughly one-third that of a typical pipeline gas; therefore, would result in a reduction in “line pack” storage to one-third of the present value if storage pressure and volume are kept constant (Figure 5).49 If pipeline design pressures must be de-rated to accommodate the added risks associated with hydrogen to the pipeline materials of construction (as discussed in Section 3.2), a further reduction in the line pack would be expected.”
  • Existing consumer appliances that use natural gas are unsuitable for hydrogen: “H2 is also more explosive, ignitable, burns hotter, and the flame is faster with lower visibility than CH4; these characteristics yield higher safety risks. The significant differences in properties between typical natural gas mixtures and H2, therefore, necessitate changes in the design of burners and burner management systems to achieve comparative levels of safety, which must then be certified (Figure 6).17, 67”.
  • Even with new consumer infrastructure, hydrogen would be much more dangerous for consumers than natural gas: “A quantitative risk assessment (QRA) was carried out in advance of a planned trial of pure H2 in a residential gas distribution system in the UK.18 The report concluded that even if the homes were fitted with appliances designed and certified for use with H2, the risk of damage and injury due to fires and explosions would increase in frequency and severity.”
  • Conclusion: “Overall, while repurposing the natural gas system for use with hydrogen may, at first, seem appealing, the limited practicality, risks, and data gaps strongly suggest that like-for-like gas substitution provides limited benefits for increased risks, even if major technical and economic hurdles are overcome.”

After all that, you might think that these authors would have given up and decided that we’ll just have to stick with natural gas. But no, remember that these are anti-carbon crusaders allied with the Environmental Defense Fund. Here is the final paragraph of the Conclusion:

[C]ontinuing to rely on natural gas is also not a viable option for addressing the climate crisis. Considering its physical and chemical properties, hydrogen is not an effective decarbonization tool for use in homes and buildings. For any decarbonization strategy, it is critical to determine if a fuel is in fact needed, and to compare with potentially more effective options such as direct electrification using renewably generated electricity.

We’ll just have “direct electrification using renewably generated electricity.” I guess that means, put solar panels on your roof, and when the sun sets the air conditioning and heat go off and the lights go out. It’s the gkam solution without the undisclosed nighttime grid hookup.

Perhaps the most valuable part of the article is the EDF revealing that it stands ready to oppose the buildout of hydrogen infrastructure just as vigorously as it opposes any natural gas infrastructure. Even if zero-emissions electricity were important and hydrogen were a good solution to get there, EDF would be ready with a litigation barrage to block it.

via Watts Up With That?

https://ift.tt/5mPtzvd

August 28, 2024 at 12:04AM