
The $15,000 EV battery and its constant need for recharging would remain the biggest obstacles to public acceptance.
via CFACT
August 12, 2024 at 11:23PM
The $15,000 EV battery and its constant need for recharging would remain the biggest obstacles to public acceptance.
via CFACT
August 12, 2024 at 11:23PM
August 09, 2024
Two months into his Presidency, Joe Biden announced a $2 trillion infrastructure plan that included $174 billion in grants, subsidies, and other payouts to encourage Americans to switch to battery-electric vehicles (BEVs). Since that initial “investment,” billions and billions more have been poured into what is increasingly a failing effort to convince or cajole auto buyers to switch.
These huge expenditures, together with COVID and war monies, have ballooned the national debt to the point that 76% of income taxes are needed just to pay interest on that debt. Many fear that profligate spending has the nation’s economy on the verge of collapse.
The fault lies with the very concept that Government Knows Best. Nothing is proving that tautology wrong more than the plethora of alternatives to BEVs – including a wide variety of hydrogen-powered engines and a new self-rotating engine– that are emerging on the world scene. None of these have been “blessed” with massive subsidies, and none would require a heavily subsidized nationwide charging station network.
It may be surprising to some, but even The New York Times back in 2021 questioned the wisdom of Biden’s bold BEV plunge. Niraj Chokshi wrote both that the $174 billion “might not be enough to push most Americans toward EVs.”
Chokshi was doubtful that “federal largesse,” which merely shifts part of the cost of a BEV from the buyer to the public, would convince consumers of the benefits of electric vehicles. That Biden then resorted to near-term mandates for a technology lacking a track record “only reinforces Chokshi’s observation.
Chokshi’s report made it clear that the $15,000 EV battery and its constant need for recharging would remain the biggest obstacles to public acceptance of what was at the time deemed the “only” pathway toward a cleaner energy future. There was no talk of support for other low- or no-“carbon” engine technologies on Capitol Hill or in the media.
Yet it is obvious today that multiple companies were already at work to develop alternatives to a vehicle that has to be recharged nearly every day. That may be convenient enough for the wealthy whose garages and home electrical systems can accommodate two charging ports but is quite difficult and time consuming for just about everyone else.
A recent article noted that Stellantis is investing $6 billion to build a generation of motors capable of running on gasoline or Brazilian ethanol and combined with plug-in hybrid technology. Kohler Engines last year unveiled a KDH hydrogen internal combustion engine, and BMW, Toyota, Triton EV, Hyundai, and many other automakers are also building hydrogen-fueled internal combustion engines.
Despite the federal push for a “one size fits all solution” to the presumed problem of carbon dioxide emissions, these and other automakers went ahead with unsubsidized alternatives for reasons they may be keeping to themselves. Did they “know” the BEV would never take hold universally?
Just this week, a new report touted a liquid nitrogen engine based on 1990s research at the University of Washington that, even with a 100-gallon nitrogen tank, is cheaper and lighter than the BEV. The operation is akin to that of a steam-driven engine and generates zero pollutants. Refueling, at existing gasoline and diesel stations, takes only a few minutes.
The prototype liquid nitrogen engine is nowhere near highway ready, but like other alternatives to grid-draining plug-ins, was ignored as a potential solution in the federal budget. And, like all of the other alternative engines, it does not rely on a lithium market controlled by China.
The “wisdom” from Washington has long been to create an all-electric motor vehicle fleet wholly dependent on an electric grid that is today on the verge of collapse, as baseload power plants are being shuttered in favor of intermittent wind and solar generation. But research from Oak Ridge National Laboratory published in 2021 made it clear that multiple pathways to cleaner burning vehicles was a far superior approach.
ORNL scientist David Cullen stated that, “Hydrogen fuel cells are ideal for the trucking industry because the refueling time and driving range are comparable to gasoline-powered (well, diesel-powered) trucks and travel routes are predictable, which lowers the barrier for developing a fueling infrastructure.” [Read: Every truck stop in America could easily accommodate hydrogen-fueled trucks.]
ORNL noted that hydrogen fuel cells (or any other hydrogen engine) contain a higher amount of energy per unit mass than a lithium battery or diesel fuel. More energy with less weight is gold for the trucking industry, which consumes a quarter of all U.S. fuel consumption while traveling only 10% of total vehicle miles.
Hydrogen would likely be an equally better choice for other heavy-duty vehicles, including school buses, but the Biden Administration has provided huge subsidies for BEV school buses, often with less than satisfactory results (despite glowing endorsements from the Vice President).
The Montgomery County, Maryland, public school district is the nation’s largest purchaser of electric school buses, with 326 ordered, delivered, or operating as of December 2023 at a cost of $168 million. But the county’s Office of Inspector General reports that the district’s rush to BEV buses has “led to millions of dollars in wasteful spending,” in part causes by late deliveries and maintenance issues.
From February 2022 to March 2024, these BEV buses failed to complete routes 280 times, with repairs taking an average of 13 days. Last October, the school board felt the need to buy 90 diesel buses to make up for the BEV bus failures.
Nationwide, over 90% of the 21 million-plus bused students ride in diesel buses, with most of the rest relying on propane. Fewer than 1% of children today ride on BEV buses, and many of the 12,000 “committed” BEV buses are not yet operational. Despite billions in federal largesse, Hydrogen-powered buses could likely be much more quickly delivered, likely cost less to purchase, and might be much more reliable on a day-to-day basis.
Two-thirds of the “committed” BEV buses were funded by the EPA’s Clean School Bus Program, which in 2022 awarded more than $900 million for nearly 2,300 buses in 365 school districts. The EPA spent another $1 billion the next year to add another 2,700 BEV buses in 270 school districts, and a third round threw another $900 million for 3,177 BEV buses in 500 districts.
The Biden Administration’s parting shot includes another round of Clean School Bus Program funding together with the EPA’s new Clean Heavy Duty Vehicles Grant Program, which targets refuse haulers, dump trucks, bucket trucks, utility trucks, and other box trucks. School buses get the biggest subsidies from this $1 billion package. Biden did belatedly throw a few billion at hydrogen producers, but little if any went to bolster hydrogen engines.
Has the federal government even looked closely at cost and performance comparisons among the various low- and zero-emission engines that are already on the market or being field-tested? Have administration officials consulted with automakers worldwide to learn why they are developing non-BEV engines?
Or is there some other reason that the Biden Administration, for which Vice President Harris has been a major spokesperson for the battery-electric school bus, has placed all of its bets on a technology controlled so heavily by China?
Duggan Flanakin (duggan@duggansdugout.com) is a senior policy analyst at the Committee For A Constructive Tomorrow who writes on a wide variety of public policy issues.
This article was originally published by RealClearEnergy and made available via RealClearWire.
via Watts Up With That?
August 12, 2024 at 08:07PM
ONI Data has been obtained from CPC – NWS – NOAA available here
The current data indicates that the Second ENSO Neutral thresh hold has been established at the end of July 2024, thereby Enso Neutral conditions continues. The ONI has dropped to +0.2°C for MJJ2024 season. Nino3.4 SST for June 2024 is 0.18°C and for July 2024 is 0.10°C and so for ONI of JJA2024, the combined total of three months Nino3.4 SST for June, July & August 2024 should at least go down to -1.36°C, so as to get ONI for JJA2024 as -0.5°C by rounding to one decimal.
Since Nino3.4 SST for June is 0.18°C and July is 0.10°C, it would mean that the Nino3.4 SST for August should theoretically go down to -1.64°C, so that the three months total reaches -1.36°C to make JJA2024 ONI -0.5°C to achieve La Nina thresh hold. Observing the Weekly Nino3.4 data, it is highly unlikely that Nino3.4 SST for August 2024 can go down to -1.64°C. Hence, ENSO Neutral condition is expected to continue for JJA2024 season.
Concluding from the above analysis, Enso Neutral conditions will prevail for JJA2024 and at the end of August, since only four months will be left in the current year 2024 full-fledged La Nina cannot be established, even if La Nina thresh hold is achieved in any of the four months remaining.
First conclusion is that La Nina thresh hold will not be achieved during the Indian Southwest Monsoon and Second conclusion is that a Full Fledged La Nina will not materialize during 2024, using the NOAA criteria.
The second conclusion as discussed is that since a La Nina thresh hold for JJA 2024 is not going to be achieved, the earliest La Nina thresh hold if at all it can be achieved is JAS2024, which is when the Indian Summer Monsoon ends.
The ONI is based on SST departures from average in the Niño 3.4 region, and is a principal measure for monitoring, assessing, and predicting ENSO. Defined as the three-month running-mean SST departures in the Niño 3.4 region. Departures are based on a set of further improved homogeneous historical SST analyses (Extended Reconstructed SST – ERSST.v5).
NOAA Operational Definitions for El Niño and La Niña, El Niño: characterized by a positive ONI greater than or equal to +0.5ºC. La Niña: characterized by a negative ONI less than or equal to -0.5ºC. By historical standards, to be classified as a full-fledged El Niño or La Niña episode, these thresholds must be exceeded for a period of at least 5 consecutive overlapping 3-month seasons.
CPC considers El Niño or La Niña conditions to occur when the monthly Niño3.4 OISST departures meet or exceed +/- 0.5ºC along with consistent atmospheric features. These anomalies must also be forecast to persist for 3 consecutive months.
The Climate Prediction Center (CPC) is a United States Federal Agency that is one of the NECP, which are a part of the NOAA
The Table below shows the monthly SST of Nino3.4 Region and the Climate adjusted normal SST and SST anomaly from February 2023. Climate Base 1991-2020. ERSST.v5
Period    Nino3.4  ClimAdjust
YR     MON Temp.ºC  Temp.ºC ANOM ºC
2023   2   26.30    26.76    -0.46
2023   3   27.19    27.29    -0.11
2023   4   27.96    27.83     0.14
2023   5   28.40    27.94     0.46
2023   6   28.57    27.73     0.84
2023   7   28.31    27.29     1.02
2023   8   28.21    26.86     1.35
2023   9   28.32    26.72     1.60
2023  10   28.44    26.72     1.72
2023  11   28.72    26.70     2.02
2023  12   28.63    26.60     2.02
2024   1   28.37    26.55     1.82
2024   2   28.28    26.76     1.52
2024   3   28.42    27.29     1.12
2024   4   28.60    27.83     0.78
2024   5   28.17    27.94     0.24
2024   6   27.91    27.73     0.18
2024   7   27.39    27.29     0.10
Indications and analysis of various International Weather/Climate agencies monitoring Enso conditions is depicted hereunder:
Summary by: Climate Prediction Center / NCEP Dated 8th August 2024
ENSO Alert System Status: La Niña Watch
Synopsis: ENSO-neutral is expected to continue for the next several months, with La Niña favored to emerge during September-November (66% chance) and persist through the Northern Hemisphere winter 2024-25 (74% chance during November-January).
Note: Statements are updated once a month (2nd Thursday of each month) in association with the ENSO Diagnostics Discussion, which can be found by clicking here.
Recent (preliminary) Southern Oscillation Index values as per The Long Paddock – Queensland Government.
30 Days average SOI was -5.83 at the end of July 2024 and was -8.85 on 6th August 2024 as per The Long Paddock – Queensland Government and 90 Days average SOI was -3.06 on 6th August 2024.
As per BOM – Australia 6th August 2024
ENSO is neutral; a possibility of La Niña development during spring (Southern Hemisphere)
The ENSO Outlook is currently at La Niña Watch, meaning there are some signs that a La Niña may form in the Pacific Ocean later in 2024. A La Niña Watch does not guarantee that a La Niña will develop. The La Niña Watch is based on climate model forecasts and current atmospheric and oceanic conditions in the Pacific. Atmospheric and oceanic indicators are currently within ENSO-neutral thresh holds. While ENSO is likely to remain neutral until at least early spring. From October, 3 of 7 climate models suggest the
possibility of SSTs cooling to the La Niña threshold (below −0.8 °C). The remaining models suggest a continuation of ENSO-neutral conditions throughout the forecast period.
Note: All Seasons mentioned by BOM are with respect to Southern Hemisphere.
via Watts Up With That?
August 12, 2024 at 04:07PM
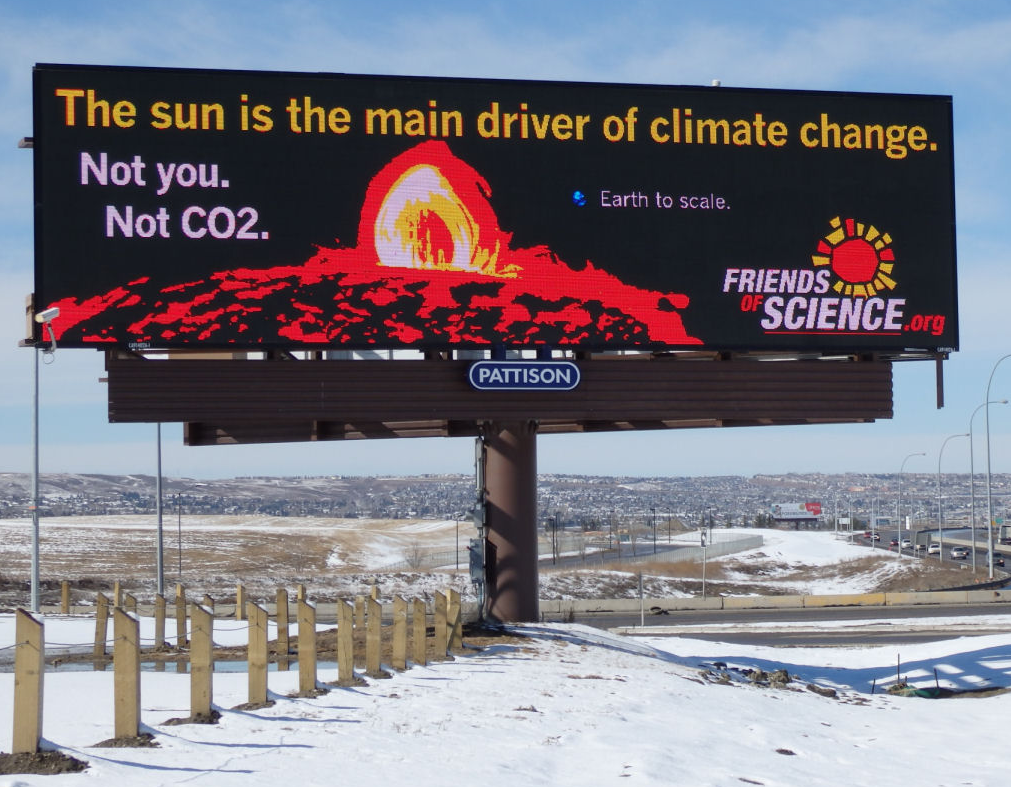
John Gideon Hartnett writes at Spectator Australia The sun is in control of our oceans. Text is from John Ray at his blog, excerpts in italics with my bolds and added images.
In recent years, there has been observed an increase in ocean temperature. Those who adhere to the Climate Change version of events say that the oceans are getting warmer because of trapped carbon dioxide (CO2) in the atmosphere causing a massive greenhouse effect leading to boiling oceans.

Well, anyone who has a brain knows that the oceans are not boiling, but let’s assume that is just hyperbole. When actual research – when actual measurements were taken – reality turns out to be the exact opposite.
New research shows that the temperature of our oceans are controlled by incident radiation from the Sun. Who would have guessed?
And as a consequence of the oceans warming, dissolved carbon dioxide gas is released due to reduced is solubility in ocean water. This means the warming of the oceans would lead (or cause) an increase in CO2 concentration in the atmosphere. One of the researchers in the study wrote on X.com:
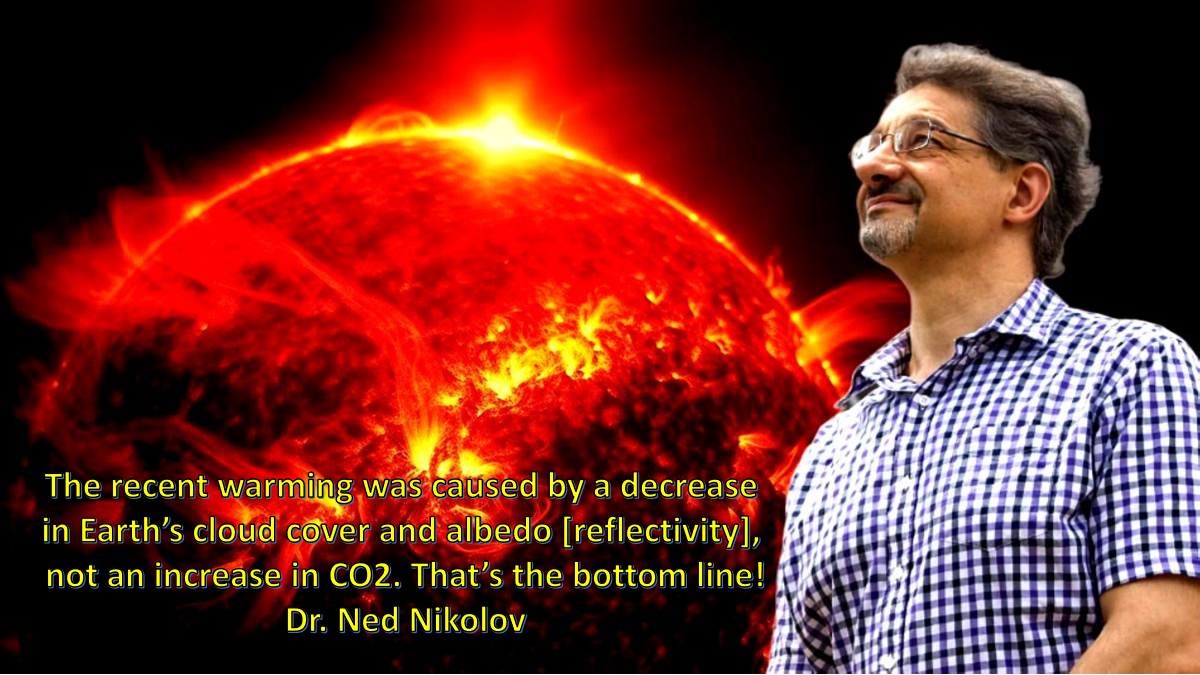
A decrease in cloud cover and albedo means more short wavelength (SW) solar radiation reaches the oceans. Albedo is the reflectivity of the Earth. Lower albedo means more sunlight reaching the land and oceans and more warming by the Sun.
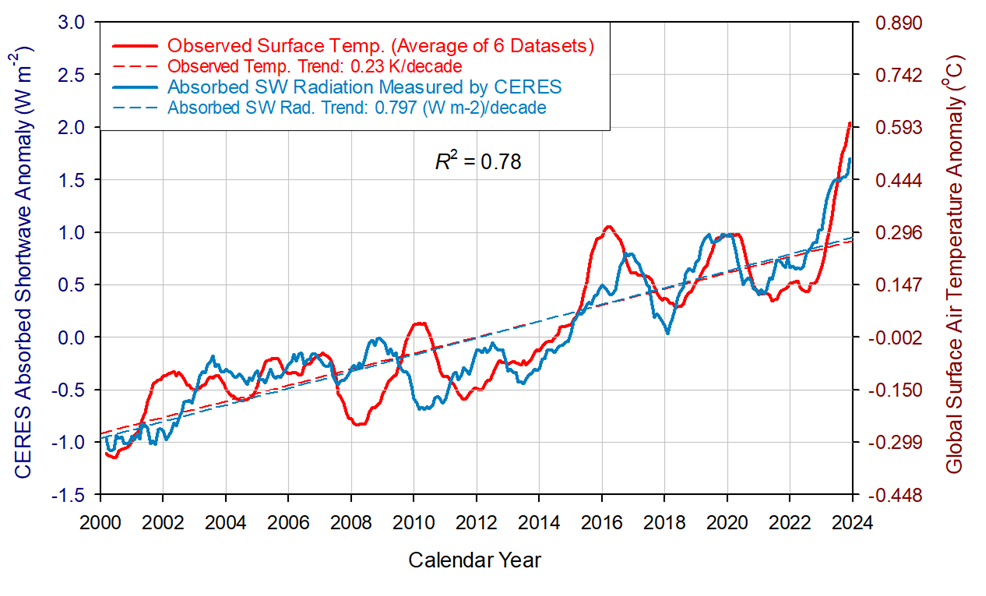
Figure 8. Comparison between observed global temperature anomalies and CERES-reported changes in the Earth’s absorbed solar flux. The two data series representing 13-month running means are highly correlated with the absorbed SW flux explaining 78% of the temperature variation (R2 = 0.78). The global temperature lags the absorbed solar radiation between 0 and 9 months, which indicates that climate change in the 21st Century was driven by solar forcing.
I mean to say that this is so obvious. The Sun heats Earth’s surface of which 71% is covered by the oceans! Basic physics!
The energy from the Sun powers all life on the planet and causes all Earth changes. Every second, the Earth receives the equivalent energy of 42 megatons of TNT in radiation from the Sun. That cannot be ignored.
Climate Change, the ideological movement which I prefer to call a cult, views all evidence through the lens of their religious belief that the Earth is warmed by human activity. That activity releases carbon dioxide gas, which has been observed to be increasing. Their belief is that CO2 traps heat in a giant greenhouse effect. That is the dogma anyway. And I must add, we all are the carbon they want to eliminate.
But how much of that observed increase in CO2 is actually from natural causes and not from human activity? At least 94 per cent is. This new evidence now suggests it could be even more than that.
If the oceans emit CO2 gas following changes in the water temperature, which this research shows is due to the amount (flux) of solar radiation reaching the surface, then more CO2 comes from natural causes.
It is basic physics that as you heat water the dissolved gases are released due to a decrease in gas solubility. This means as the solar flux increases CO2 gas is released from the warmer ocean water.
Thus an ocean temperature increase leads to an increase in CO2 in the atmosphere, and not the other way around.

Space weather impacts the ionosphere in this animation. Credits: NASA/GSFC/CIL/Krystofer Kim
via Science Matters
August 12, 2024 at 04:00PM
