Author: Iowa Climate Science Education

Net Zero Nirvana

“Renewables overtake fossil fuels to provide 30% of EU electricity – Report finds 13 member states generated more energy from wind and solar power than coal and gas for first time in 2024” gushed the Guardian earlier today. The article is in turn based on a report prepared by Ember, with the title “Wind and solar overtake EU fossil fuels in the first half of 2024”. It sounds great, doesn’t it? Net Zero Nirvana is almost within reach. Or perhaps it isn’t. One has to remember that Ember is a campaigning organisation and its work should always be read with that very important caveat in mind.

Thus it is that the claims in the report – while technically true – aren’t remotely as dramatic or impressive as they appear at first sight. Certainly, the UK’s new Secretary of State for Energy Security and Net Zero might be well-advised not to be advised by people such as these.

The report very excitedly hails the growth of wind and solar in EU electricity generation, at the same time as noting the decline of fossil fuel use to generate electricity, but it comes with a huge caveat:

However, sustaining the EU’s electricity transition at this pace will require dedicated policy focus to ease barriers to wind and solar integration. Adequate support on grid connections and other enablers of swift development will be needed to ensure that economic, security and climate benefits are delivered across Europe.

Two short sentences containing so many problems. “Dedicated policy focus” isn’t explained, nor is “barriers to wind and solar integration”. Equally “[a]dequate support on grid connections and other enablers” is a phrase let hanging in the air, but we can all guess what is meant – money, and lots of it. The barriers to integration are probably the problems associated with connecting to the grid from many disparate and remote locations, with the associated expensive (and unsightly) paraphernalia necessary to enable this – pylons, battery back-up, and so on. Getting to 30% of electricity production from renewables is the easy part. Going beyond it is where the difficulties begin. The low-hanging fruit has all been picked.

We also learn that electricity generated by hydro rebounded to a very impressive 21% of the total. Sadly, this is not something available to policy-makers in the UK, which doesn’t have the same natural advantages as those parts of the EU which are heavily reliant on this form of power generation. Another significant point worth noting is that the strong growth in hydro wasn’t due to increased capacity, rather it was down to better performance following a wet start to the year compared to the drought of the previous two years. Had hydro not recovered so strongly, I suspect that the decline in fossil fuel use might not have been so marked, indeed might not have occurred at all. To rely heavily on hydro when we are constantly being told that extreme weather – to include droughts as well as floods – doesn’t seem like the best means of achieving energy security. A couple of dry years, and those gas and coal power stations will need to ramp up again.

Similarly, nuclear generation increased by 3.1% in the period, as French nuclear generation coming back online following maintenance and outages exceeded the decline in nuclear generation in Germany. Again, that’s a proportion of generation that might otherwise have been supplied by fossil fuels, for want of an alternative.

The weather was an important element in these results in more ways than one. While rains replenished hydro generation after two years of drought, a mild winter also galloped to the rescue:

Demand likely would have risen further if not for a warmer-than-average winter in many Member States, which lowered electricity demand for heating. Without the impact of mild winter weather, demand would have increased by an estimated 2.1%…

Relying on mild winters might be a better bet – if the climate predictions are to be believed – than relying on wet weather, but there is no certainty when it comes to weather. Contingency plans should always be in place.

In addition to rain for hydro and mild temperatures to depress demand for winter heating, we also learn that it was helpfully windy, which facilitated greater electricity generation from wind turbines than might otherwise have been the case. Welcome though that was, it shouldn’t be forgotten that the second half of 2021 saw a Europe-wide wind drought, with wind speeds falling 15% below average over a prolonged period. The result in 2021 was that the proportion of electricity generated by wind turbines was significantly lower than expected. While the first half of 2024 saw beneficial wind conditions, this can’t be relied on and the very unreliability and variability of this source of electricity is problematic – and becomes increasingly problematic as the proportion of electricity generated by wind increases.

These factors are well illustrated by a couple of quotes from the report:

…higher wind speeds across the EU in the first half of 2024 helped boost output. If wind speeds in the first half of 2024 had been the same as in the previous year, wind output would have grown by 5.6% (+13 TWh) instead of the 9.5% (+21 TWh) observed.

The uptick in hydro power was primarily weather-dependent, after several years of significant variation linked to conditions. After years impacted by droughts, Europe experienced higher-than-average rainfall in the first half of 2024. As a result, hydro generation rebounded by 21% (+33 TWh) to reach the highest output since 2018. Some Member States saw particularly large upticks in hydro output: Italy increased by 56% (+8.5 TWh), France by 35% (+9.3 TWh), Spain by 54% (+6.9 TWh) and Portugal by 69% (+3.5 TWh). Overall, hydro generation was 15% higher in the EU than the average generation in January-June over the last 5 years.

Given that the admittedly impressive first six months of the year for renewable electricity generation in Europe was the result of favourable weather (wind and rain), which depressed demand (a mild winter) and returning nuclear generation, I am not convinced that this optimistic claim is entirely justified (especially as getting to 30% of the mix is the easy and least problematic part):

Wind and solar have demonstrated that they can grow quickly enough to meet demand increases and push fossil fuels out of the mix. EU policies aimed at accelerating the energy transition in the wake of the gas price crisis have resulted in record capacity additions for wind and solar, laying the groundwork for a sustained shift away from fossil fuels.

Returning to the point with which we began, we find that continuing to increase renewables growth in the EU is far from problem-free:

As power prices return to pre-crisis levels, Europe cannot rely on the market alone to drive the necessary acceleration of renewables deployment. Well-designed and implemented incentive schemes will remain important to sustaining momentum, as demonstrated by the impressive solar expansion continuing in Germany in 2024. Non-market barriers, such as grid capacity constraints, must also be overcome. This is evident in the Netherlands, where the network has struggled to keep pace with the country’s solar boom.

Also, it shouldn’t be forgotten that most solar panels are obtained from China and that EU solar panel manufacturers have been struggling despite the growth in demand for their products within the EU. Ironically, one of the reasons why manufacturers struggle in the EU (and in the UK, for that matter) is because electricity is so much more expensive than in countries such as China which rely much more heavily on fossil fuels.

In conclusion, I have to concede that renewables have enjoyed a good six months in the EU. The optimism expressed in the Ember report and in the Guardian article based on it may well not be justified. The situation is much more complicated than optimists like to believe. The UK government should base its energy policy on practicality, not on reports prepared by lobbyists.

via Climate Scepticism

https://ift.tt/3EfkL8e

July 30, 2024 at 02:27PM

The Return On Your Investment

Guest Post By Willis Eschenbach

Among my other sins, I have made money as an accountant for several businesses and non-profits plus two of my own businesses, as a tax preparer, and as the Chief Financial Officer for a company with $40 million in annual sales. So I often think in terms of things like Return On Investment (ROI) and Energy Return On Investment (EROI). From that excellent source:

Energy Return on Investment (EROI) is a ratio for describing a measure of energy produced in relation to the energy used to create it. For instance the ratio would illustrate how much energy is used to locate, extract, deliver, and refine crude oil relative to how much useable energy is created.

Today I realized I could create a similar ratio to analyze the climate, a ratio which I’ve called “WROI” for “Watts Return On Investment”. It is defined as the value at the surface of the earth of:

Downwelling thermal radiation from the atmosphere divided by upwelling thermal radiation from the surface

Conceptually, it works like this. Depending on its temperature, at each location the surface emits a certain amount of upwelling thermal radiation. That’s the investment, measured in watts per square meter of surface. (W/m2)

Some percentage of that upwelling thermal radiation is absorbed by the atmosphere, and some percentage of that returns to the surface as downwelling thermal radiation. That’s the return, again in W/m2.

And Watts Return On Investment (WROI) is the ratio of those two. It’s the downwelling thermal radiation as a percentage of the upwelling surface thermal radiation.

And why is this of interest?

Well, the CO2 roolz temperature theory says that as CO2 increases, the amount of downwelling thermal radiation should increase worldwide due to the increased absorption of upwelling surface thermal radiation.

And more to the point, I realized that depending on its size, that change might be visible in the WROI data.

Here’s the funny part. At the time this morning when I was contemplating this, I was taking a break from riding my bike on a trail a ways from home.

There’s a bench at that spot where I sit and toss my thoughts around. It was there that I came up with the idea of the WROI.

As you might imagine, I was excited to flesh out this concept and learn what the data actually showed, would the CO2 change be visible, where would the WROI be greatest and smallest … and of course, no computer in sight. Grrr.

Frustrating, but it meant that I had time to think about what the CO2 roolz temperature theory would predict. It would predict that the WROI should increase over time, due to the increase in the percentage of upwelling longwave radiation absorbed by the increasing atmospheric CO2.

I also thought that the WROI might be larger in the northern hemisphere since atmospheric CO2 concentrations are higher in the north.

And better yet, I could calculate how much the WROI should increase due to the increase in CO2.

Buoyed by all that, I got back on my bike and kept riding. Clearly, I’m back home now. So here’s the log of some of my initial wanderings in the WROI data.

I took a look at the change in the WROI over time in the CERES satellite dataset. Remember that the CO2 roolz temperature theory predicts an increase in WROI over that period.

To that graphic of the WROI time series, I added a line showing the size and timing of the increase in WROI that is predicted by the increase in atmospheric CO2. (Red line in Figure 1 below, calculation details in a footnote.) Here is the result.

Figure 1. Percentage of upwelling surface radiation that is radiated back to the surface.

Dang-a-lang, sez I … that is a most interesting graph.

It shows that whatever has caused the temperature increase over the last two decades … it’s clearly not due to an increase in the amount of surface upwelling thermal radiation that is absorbed by atmospheric CO2.

Anyhow, that was my morning. I’m going for a walk now. There’s more to discuss in the WROI data, but that’s for another day.

My very best to all, including climate skeptics, heretics like me, and mainline folks,

w.

Yeah, you’ve heard it before: When you comment please quote the exact words you are referring to. I can only defend my words, not what you think my words said.

TRIGGER WARNING: MATH AHEAD!

To calculate the predicted percentage change in the WROI due to CO2 takes a few steps.

First I converted the time series of the CO2 change in ppmv to W/m2 of predicted forcing.

Forcing Anomaly (W/m2) = log2( CO2 time series / (first of CO2 time series) )*3.7 W/m2 per doubling of CO2

Then I converted that CO2 forcing anomaly time series to percentage units by dividing it by the same thing I used to create the WROI, which was the CERES time series of the upwelling thermal radiation from the surface. That gives me the CO2 forcing anomaly in the same percentage units as the WROI.

Finally, I added that CO2 forcing anomaly percentage time series to the starting point of the CEEMD smooth of the WROI time series. That gave me the red line in Figure 1, the percentage increase predicted by the increase in atmospheric CO2.

via Watts Up With That?

https://ift.tt/zsdyQ3w

July 30, 2024 at 12:00PM

Earlier Forecast Of “A Summer From Hell” in Germany Just Isn’t Materializing. July Comes In Near Normal!

After a preliminary tabulation of data collected from its approx. 2000 stations across the country, the results of Germany’s, DWD national weather service in Offenbach show that earlier dramatic predictions of a “hellish summer” have yet to come true.  

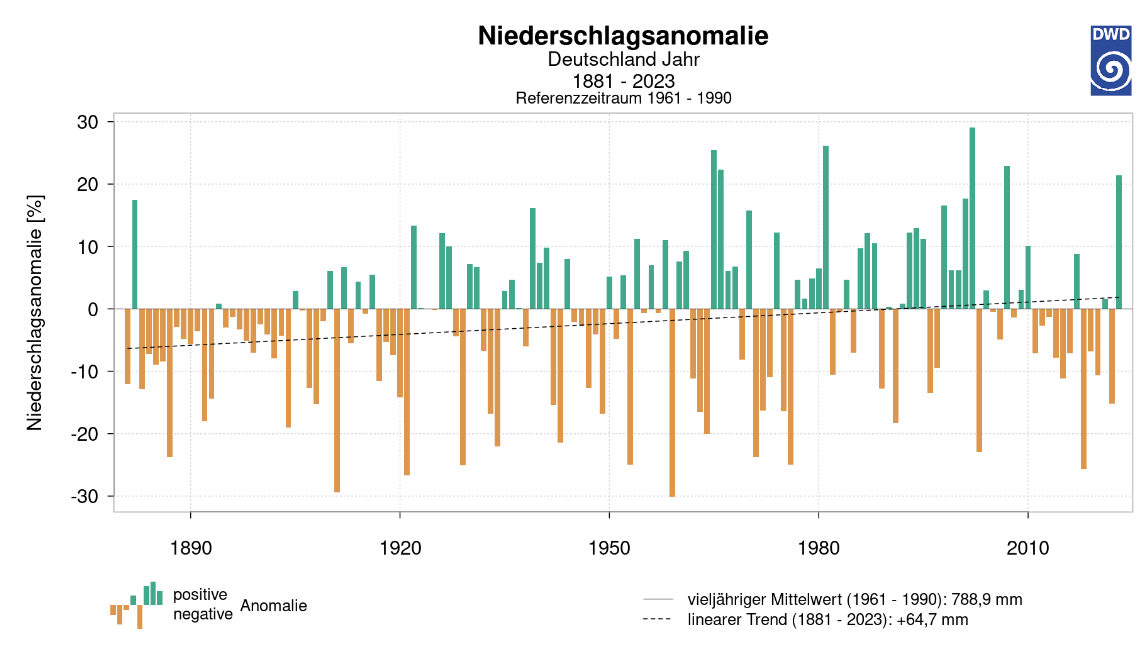
German annual rainfall anomaly. Germany’s been getting wetter – not drier. Image: DWD. 

False alarmist predictions

In March, 2024, “experts” like biologist Mark BeneckeIs warned that climate change “was coming to a head this summer” for Germany, predicting “unprecedented heat” in 2024.

June in Germany came in near normal, and now according to the DWD, July 2024 has also been “rather variable , with consistent summer weather simply refusing to materialize.”

The brief periods of warm weather quickly got interrupted by showers and thunderstorms.

Slightly warmer than normal

The mean temperature in July 2024 (preliminary) was 18.9°C, or 0.6°C warmer than the 1991 to 2020 reference period mean of 18.3 °C. The start of the month was rather cool and autumnlike.

The peak value was recorded at the Bad Muskau station (Saxony), where it reached 34.8°C on July 10.

On July 30th, temperatures plummeted again at night and the nationwide low of 3.8 °C, recorded in Deutschneudorf-Brüderwiese (Saxony).

Few warm nights

Tropical nights (when lows do not drop below 20.0 °C) were the exception rather than the rule and only occurred in small numbers on the Upper Rhine, in Lower Bavaria, Saxony and the greater Berlin area. Earlier reports warned that German cities like Hamburg would see a sharp increase in warm tropical nights that would make sleep more difficult. So far there hasn’t been one such night in Hamburg this summer.

Average rainfall

“Experts” also warned that Germany would see more drought in the summer as climate warming progresses. But this summer so far has been wetter than normal. According to the DWD, July saw 88 liters of rain per square meter. Compared to the climate reference period from 1991 to 2020 (87 l/m²), July 2024 was practically dead-on average.

More sunshine

In terms of sunshine in July, the country saw a mean of of 237 hours in July, which was only slightly above average compared to the 1991-2020 climate reference period (226 hours). That probably helped to make the month a bit warmer than average.

Donate – choose an amount

via NoTricksZone

https://ift.tt/q27wd4H

July 30, 2024 at 11:57AM

Why weaning Britain off gas threatens to give Miliband a £74bn headache

By Paul Homewood

 image

Achieving net zero by 2050 relies on a shift that risks being as complicated as it is costly

When Macquarie took full ownership of Britain’s main gas network in a £700m deal last week, it raised eyebrows for several reasons.

The Australian investment bank is best known in the UK for its controversial stewardship of Thames Water, extracting huge dividends from the troubled water supplier.

But Macquarie’s decision to back National Gas was also notable as a hefty bet on the future of gas pipelines when it’s not certain they have one.

Under the shift to net zero by 2050, the Government and others are encouraging households to ditch their gas boilers in favour of electrified alternatives such as heat pumps. This is because heating currently generates almost two fifths of the UK’s total carbon emissions.

For these plans to succeed, tens of millions of households in Britain will need to disconnect from the gas network. This has raised the risk that privatised systems such as the one owned by Macquarie and fellow investors will become effectively worthless “stranded assets”, according to energy regulator Ofgem.

The question of who will pay and how is coming fast down the track towards Ed Miliband, the Energy Secretary, who has said getting Britain off gas is his top priority.

“You can’t use a gas boiler in a net zero scenario, unless it’s burning something else”, says Richard Lowes, a heating researcher and senior associate of the Regulatory Assistance Project.

But hydrogen, which has been touted as a clean alternative fuel for heating and cooking, appears to be an increasingly unrealistic option for domestic heating, due to the high costs of producing, transporting and storing it,” he says.

“That means people have to switch to something else,” Lowes says. “So they’re going to be getting rid of their gas connection.”

Britain’s gas network was built up over more than a century and spans 187,000 miles of pipelines and pumps, delivering gas to about 23m homes.

It was privatised in the late 1980s by the Thatcher government, with the motorway-style transmission network currently owned by National Gas and regional distribution networks owned by SGN, Northern Power Networks, Cadent Gas and Wales & West Utilities.

All of these companies are controlled by foreign investors, who have been guaranteed steady returns by the UK Government in exchange for keeping the system in good working order.

Cadent is owned by a consortium including Macquarie, the Qatar Investment Authority and German finance giant Allianz, while Northern Power Networks and Wales & West are both owned by CK Hutchison, the empire of Hong Kong billionaire Li Ka-shing.

SGN meanwhile is owned by Toronto-based Brookfield Infrastructure Partners, the Ontario Teachers’ Pension Plan and New York-based Global Infrastructure Partners.

Under the regulated asset value (RAV) – also used to manage water infrastructure – the networks are collectively worth about £27bn. This total will depreciate naturally over time but must also be partly returned to investors, mostly through consumer bills.

But this month, Ofgem sounded the alarm about a significant dilemma.

The Government’s own plan intends 300,000 households per year to ditch their gas boilers for heat pumps by 2028. There is a risk that too few people will be connected to the gas network by the 2040s to ensure investors get all their money back.

Ofgem warned that the sums due per household, in the form of levies on their bills, would eventually sky-rocket from £200 per year to an impossible £2,000 – an increase that would likely drive even more people to disconnect.

In corporate jargon, this means the gas networks risk becoming “stranded assets”.

“If everyone switches away from gas – and that’s the big if – then clearly there’s a risk that there’s lots of money left in the gas grids that is basically stranded,” says Lowes.

“How much will that be? We don’t know yet. But it’s at least a few billion pounds.”

And there are other factors that complicate matters even further.

For example, gas networks are currently in the middle of a major programme to replace metal gas network pipes with plastic ones.

This will make the network safer and less prone to leaks.

But it will also increase the value of the country’s gas networks, keeping their value constant well into the 2030s and making the sum that needs to be returned to investors higher.

At the same time, new homes are still being connected to the gas grid every day – with a ban only due to come into force next year.

And there is still no official plan (or budget) for shutting down the gas grid and making it safe, a process known as “decommissioning” within the industry.

Some pipes will only need to be drained of gas, “capped” and then left underground. But other ones, particularly large pipes running underneath cities, will likely need to be either dug up or reinforced to prevent them from corroding over time and causing partial road collapses.

It would also be far from straightforward logistically.

There is no switch-over plan for local areas to adopt alternatives to gas and Miliband has guaranteed that no one will be forced to rip out their boiler, meaning the pace of disconnections will be patchy.

If just one home in a street of 20 stuck with gas while others adopted heat pumps, the local gas network would still have a legal duty to continue supplying them and maintaining the pipes.

This means the first areas to be disconnected are likely to be city centres, where councils are increasingly looking at moving large buildings, such as tower blocks, hospitals, schools and hotels, on to shared heating networks powered by large heat pumps.

Even then, the unprecedented nature of the work means no firm approach to decommissioning has been decided.

“The gas network hasn’t had to manage any decommissioning, ever,” says Angela Needle, director of strategy at Cadent Gas, which operates the gas network in the North West, the Midlands, eastern England and north London.

“So it’s a new thing that we would have to work out how to do efficiently, with the least impact and least cost – there’s a whole heap of things that we need to consider.”

It’s because of this uncertainty that Needle and others have so far urged the Government to keep its options open.

National Gas and other gas companies have argued that instead of scrapping the gas network, it could be repurposed to carry hydrogen instead.

Under most plans to reach net zero, at least some hydrogen is required for industrial businesses or heavy transport uses.

This means a “backbone” pipeline, at the very least, is likely to be required to move hydrogen supplies around the country. How extensive that is however will largely depend on whether hydrogen produced by electrolysis takes off and can be made commercially viable.

Some, including Needle, believe hydrogen should also remain an option for heating some homes that cannot be served by a heat pump or other means.

“I think the idea that we’re just going to decommission as the first assumption is a costly assumption,” she says.

“I would expect that Ofgem will look at the gas network as an asset and think about the ways that it can be utilised to support net zero, because it’s something that delivers energy really well.

She added: “In fact, it’s probably the only bit of the UK infrastructure that actually works right today. It is extensive and valuable.”

A high-level study by the National Infrastructure Commission (NIC) last year appeared to support this argument at first glance – but there was a big catch.

It found that decommissioning would cost up to £74bn, compared to £46bn for repurposing the network to carry hydrogen.

However, the NIC warned that producing enough green hydrogen to heat everyone’s homes would also require £385bn more electrical infrastructure to power the necessary levels of electrolysis – dwarfing any potential savings.

Needle and Cadent dispute this analysis, arguing it was based on “flawed assumptions” such as every home being suitable for a heat pump.

“I think you’re going to have quite a lot of homes, in addition to industry, that need alternatives [to heat pumps],” she adds.

“And so why wouldn’t you really kick the tyres of that to make sure that you’re not then burdening people with the cost of decommissioning?”

Accelerated depreciation

The Government has promised a decision on whether hydrogen will be used for mass heating by 2026, making it one of the most important calls that Miliband is likely to make as Energy Secretary.

In the meantime, Ofgem’s answer to the cost dilemma is to introduce “accelerated depreciation”. If the gas networks – such as Macquarie and others the bank – are like a house, Lowes compares this to making extra payments towards a mortgage.

“What accelerated depreciation does is it just pays off the mortgage early or quicker than it otherwise would have been paid off,” he says.

Translated, this means slightly higher bills for consumers earlier on, in an effort to prevent more apocalyptic bill increases later on.

Macquarie meanwhile has placed its bet, underlining the “critical role” it believes the gas network “will continue to play as the UK delivers its ambitious energy security and decarbonisation goals”.

Ultimately Lowes says it will fall to Miliband and the Government to make the really big decisions that shape this issue.

“It needs political leadership, that’s for sure,” adds the researcher.

“The trouble is, I’ve not seen any just yet.”

https://www.telegraph.co.uk/business/2024/07/30/ed-miliband-scrap-britain-gas-network-experts-cost-billions/

A stark reminder that Net Zero will cost us all much more than we can afford. Whichever way we decide to go, it will cost tens of billions we have not got.

If we shut down the gas grid, it must be made safe. The estimate of £75 billion can probably be doubled.

And if we use it for hydrogen, it will cost almost as much to adapt.

Worst of all, as gas users decline the grid costs have to be borne by an ever decreasing number of customers.

Some argue that we should mix hydrogen into the gas supply, but this wholly misses the point. We are supposed to be phasing out gas, not just reducing consumption. And given hydrogen is so much more expensive, there is no logic in adding it to the supply anyway.

This is a microcosm of the entire Net Zero fiasco, which involves spending unbelievable amounts of money in pursuit of an unachievable end.

via NOT A LOT OF PEOPLE KNOW THAT

https://ift.tt/zBTKRk5

July 30, 2024 at 10:53AM