Author: Iowa Climate Science Education

Power Density Physics Trump Energy Politics

A plethora of insane energy policy proposals are touted by clueless politicians, including the apparent Democrat candidate for US President.  So all debators need reminding of some basics of immutable energy physics.  This post is in service of restoring understanding of fundamentals that cannot be waved away.

The Key to Energy IQ

This brief video provides a key concept in order to think rationally about calls to change society’s energy platform.  Below is a transcript from the closed captions along with some of the video images and others added.
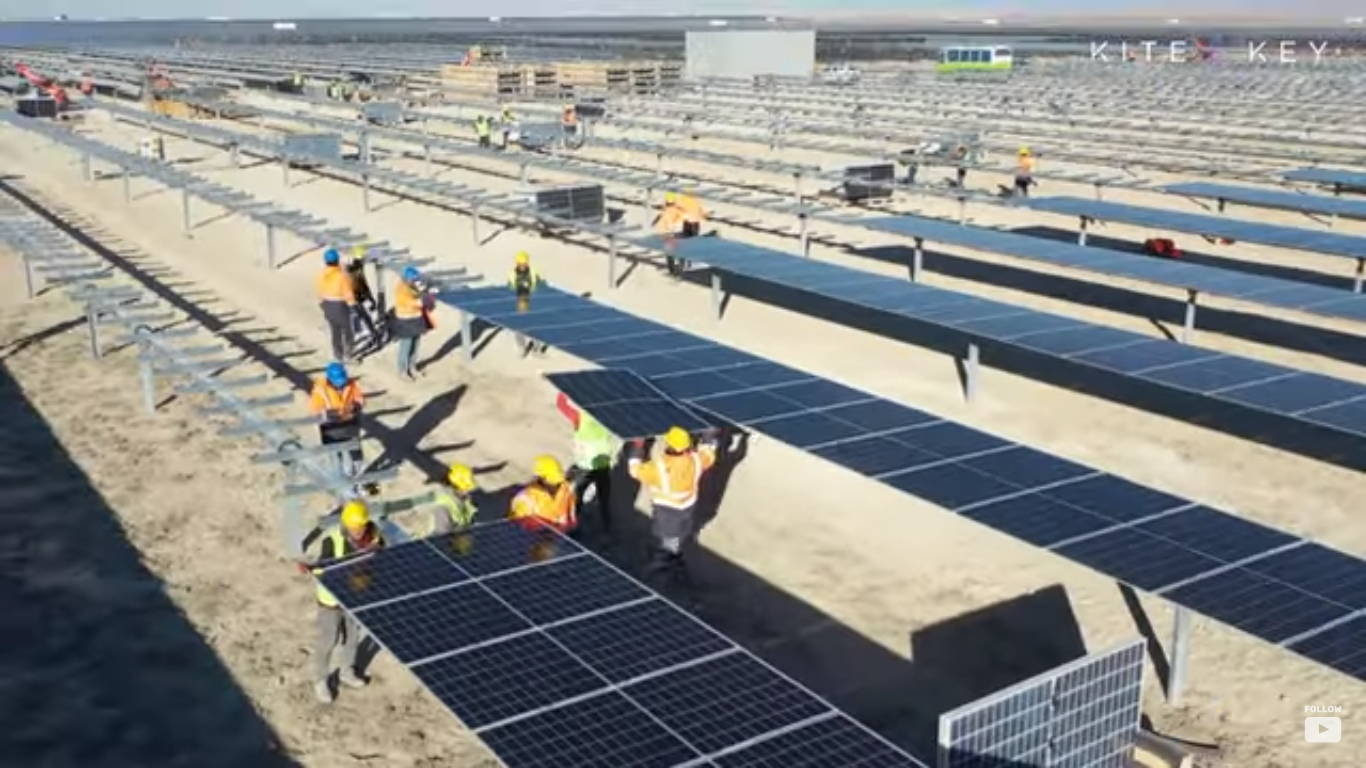
We know what the future of American energy will look like. Solar panels, drawing limitless energy from the sun. Wind turbines harnessing the bounty of nature to power our homes and businesses.  A nation effortlessly meeting all of its energy needs with minimal impact on the environment. We have the motivation, we have the technology. There’s only one problem: the physics.
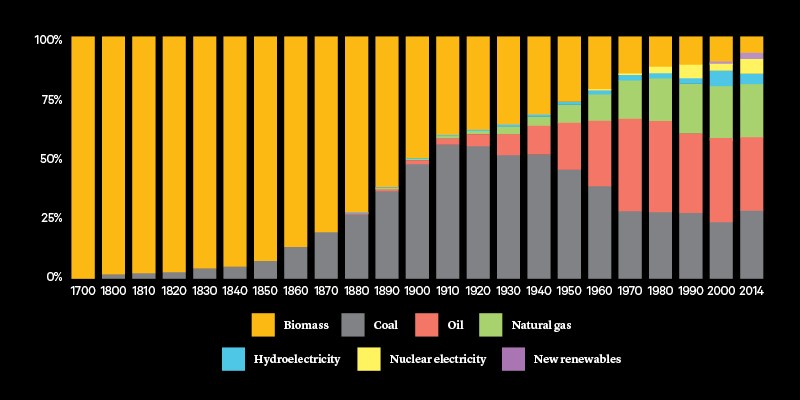
The history of America is, in many ways, the history of energy. The steam power that revolutionized travel and the shipping of goods. The coal that fueled the railroads and the industrial revolution. The petroleum that helped birth the age of the automobile. And now, if we only have the will, a new era of renewable energy.

Except … it’s a little more complicated than that. It’s not really a matter of will, at least not primarily. There are powerful scientific and economic constraints on where we get our power from. An energy source has to be reliable; you have to know that the lights will go on when you flip the switch. An energy source needs to be affordable–because when energy is expensive…everything else gets more expensive too. And, if you want something to be society’s dominant energy source, it needs to be scalable, able to provide enough power for a whole nation.

Those are all incredibly important considerations, which is one of the reasons it’s so weird that one of the most important concepts we have for judging them … is a thing that most people have never heard of. Ladies and gentlemen, welcome to the exciting world of…power density.

Look, no one said scientists were gonna be great at branding. Put simply, power density is just how much stuff it takes to get your energy; how much land or other physical resources. And we measure it by how many watts you can get per square meter, or liter, or kilogram – which, if you’re like us…probably means nothing to you.

So let’s put this in tangible terms. Just about the worst energy source America has by the standards of power density are biofuels, things like corn-based ethanol. Biofuels only provide less than 3% of America’s energy needs–and yet, because of the amount of corn that has to be grown to produce it … they require more land than every other energy source in the country combined. Lots of resources going in, not much energy coming out–which means they’re never going to be able to be a serious fuel source.
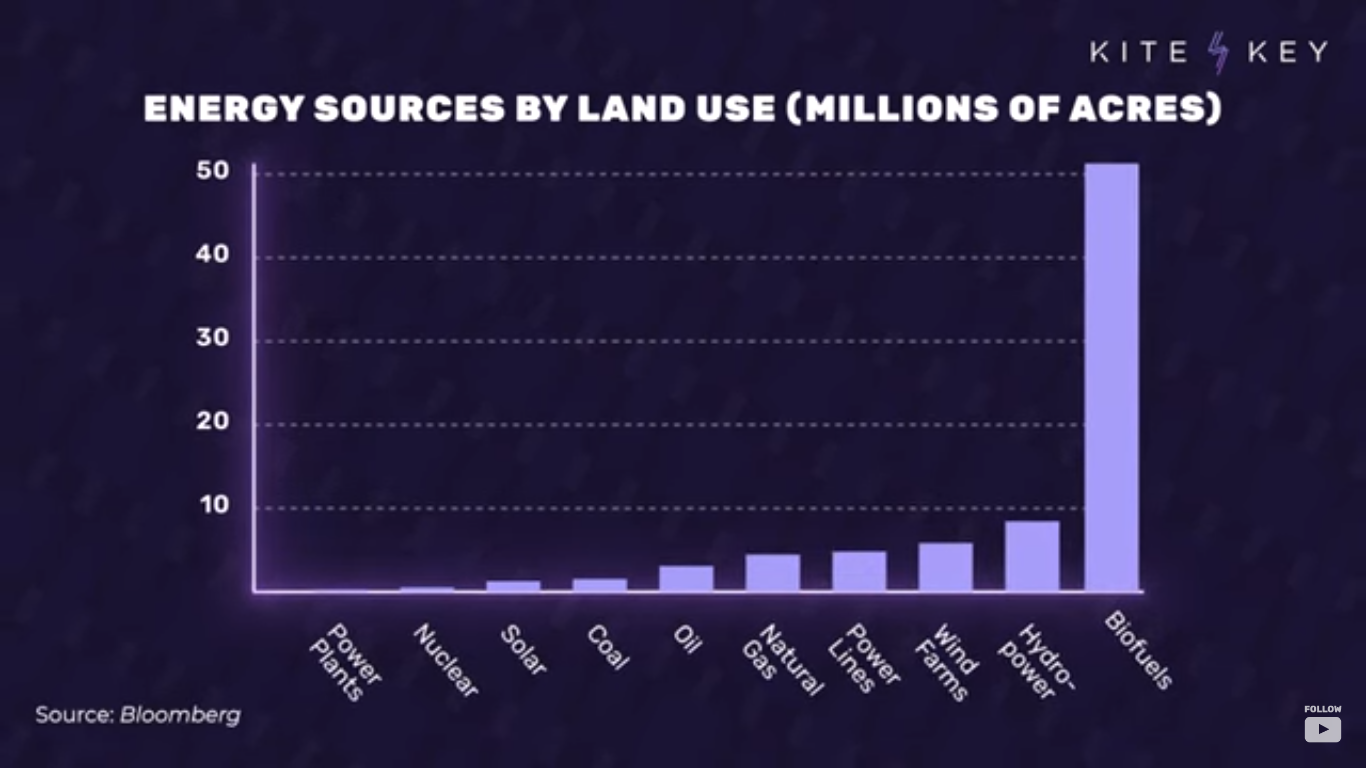
Now, that’s an extreme example, but once you start to see the world in these terms, you start to realize why our choice of energy sources isn’t arbitrary. Coal, for example, is still America’s second largest source of electricity, despite the fact that it’s the dirtiest and most carbon-intensive way to produce it. Why do we still use so much of it? Well, because it’s significantly more affordable…in part because it’s way less resource-intensive.
An energy source like offshore wind, for example, is so dependent on materials like copper and zinc that it would require six times as many mineral resources to produce the same amount of power as coal. And by the way, getting all those minerals out of the ground…itself requires lots and lots of energy.

Now, the good news is that America has actually been cutting way down on its use of coal in recent years, thanks largely to technological breakthroughs that brought us cheap natural gas as a replacement. And because natural gas emits way less carbon than coal, that reduced our carbon emissions from electricity generation by more than 30%.

In fact, the government reports that switching over to natural gas did more than twice as much to cut carbon emissions as renewables did in recent years. Why did natural gas progress so much faster than renewables? It wasn’t an accident.

Energy is a little like money: You’ve gotta spend it to make it. To get usable natural gas, for example, you’ve first gotta drill a well, process and transport the gas, build a power plant, and generate the electricity. But the question is how much energy are you getting back for your investment? With natural gas, you get about 30 times as much power out of the system as you put into creating it.  By contrast, with something like solar power, you only get about 3 1/2 times as much power back.
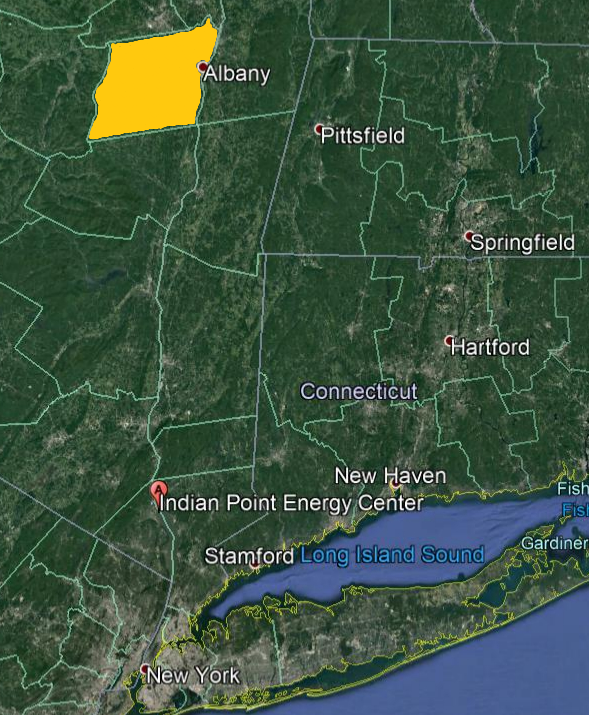
Replacing the now closed Indian Point nuclear power plant would require covering all of Albany County NY with wind mills.

Hard to fuel an entire country that way. And everywhere you look, you see similarly eye-popping numbers. To replace the energy produced by just one oil well in the Permian Basin of Texas–and there are thousands of those–you’d need to build 10 windmills, each about 330 feet high. To meet just 10% of the country’s electricity needs, you’d have to build a wind farm the size of the state of New Hampshire. To get the same amount of power produced by one typical nuclear reactor, you’d need over three million solar panels, none of which means, by the way, that we shouldn’t be using renewables as a part of our energy future.

But it does mean that the dream of using only renewables is going to remain a dream,
at least given the constraints of current technology. We simply don’t know how
to do it while still providing the amount of energy that everyday life requires.

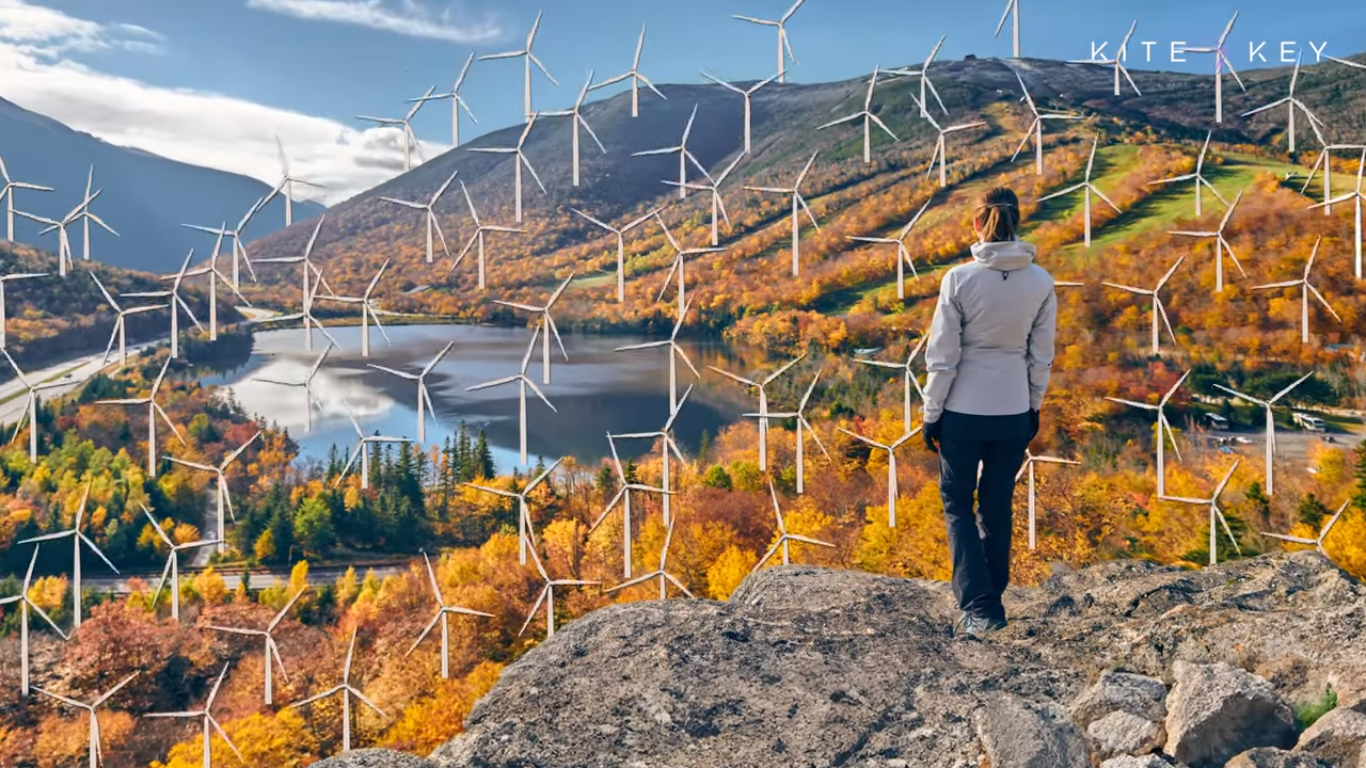
No energy source is ever going to painlessly solve all our problems. It’s always a compromise – which is why it’s so important for us to focus on the best outcomes that are achievable, because otherwise, New Hampshire’s gonna look like this.
Addendum from Michael J. Kelly

Energy return on investment (EROI)

The debate over decarbonization has focussed on technical feasibility and economics. There is one emerging measure that comes closely back to the engineering and the thermodynamics of energy production. The energy return on (energy) investment is a measure of the useful energy produced by a particular power plant divided by the energy needed to build, operate, maintain, and decommission the plant. This is a concept that owes its origin to animal ecology: a cheetah must get more energy from consuming his prey than expended on catching it, otherwise it will die. If the animal is to breed and nurture the next generation then the ratio of energy obtained from energy expended has to be higher, depending on the details of energy expenditure on these other activities. Weißbach et al. have analysed the EROI for a number of forms of energy production and their principal conclusion is that nuclear, hydro-, and gas- and coal-fired power stations have an EROI that is much greater than wind, solar photovoltaic (PV), concentrated solar power in a desert or cultivated biomass: see Fig. 2.

In human terms, with an EROI of 1, we can mine fuel and look at it—we have no energy left over. To get a society that can feed itself and provide a basic educational system we need an EROI of our base-load fuel to be in excess of 5, and for a society with international travel and high culture we need EROI greater than 10. The new renewable energies do not reach this last level when the extra energy costs of overcoming intermittency are added in. In energy terms the current generation of renewable energy technologies alone will not enable a civilized modern society to continue!

On Energy Transitions

Postscript

via Science Matters

https://ift.tt/lqe6jVb

July 30, 2024 at 07:53AM

Petermann Fact Check

Greenland’s Petermann Glacier has grown nearly ten miles over the last 12 years, and the press and NASA boldly declare the exact opposite.

NASA Worldview

NASA Worldview

About Tony Heller

Just having fun

This entry was posted in Uncategorized. Bookmark the permalink.

via Real Climate Science

https://ift.tt/hi3FD2T

July 30, 2024 at 07:45AM

Met Office State of the UK Climate Report

From NOT A LOT OF PEOPLE KNOW THAT

By Paul Homewood

The Met Office are back with their “extreme weather” fraud:

Climate change is causing a dramatic increase in the frequency of temperature extremes and number of temperature records the UK experiences.

New analysis of observations shows that extremes of temperature in the UK are most affected by human induced climate change. This means the UK is seeing, on average, more frequent periods of hot weather, bringing challenges for infrastructure, health and wellbeing. The observations also suggest an increase in rainfall extremes.

The new analysis features in this year’s annual publication of the ‘State of the UK Climate’ report. Published in the Royal Meteorological Society’s ‘International Journal of Climatology’, the report is a comprehensive review of the UK climate and significant weather events through 2023. This report is based on observations from the UK’s network of weather stations, using data extending back to the 19th Century to provide long term context.

Using an example of 28°C, the frequency of days reaching this threshold has increased nearly everywhere across the UK. Where in the 1961-1990 averaging period only London and Hampshire recorded six or more days over 28°C, by the latest decade (2014-2023) this has spread across much of England and Wales, with frequencies in the south east increasing to over 12 days each year in many counties.

Although rainfall has a much higher natural variability than temperature, it is still possible to identify an increasing frequency of the wettest days over time too. By taking the top 5% of wettest days during the 1961-1990 averaging period it is possible to see how frequent these very wet days have been in the most recent decade (2014-2023).

The most recent decade has had around 20% more days of exceptional rainfall compared to the 1961-1990 averaging period. While there is no significant signal for this change being more pronounced in a specific area of the UK, overall, this analysis clearly shows an increase in the number of very wet days in the UK’s climate in recent years compared to what was observed just a few decades ago.

Lead author and Met Office climate scientist, Mike Kendon, said: “Our new analysis of these observations really shines a light on the fastest changing aspects of our weather as a consequence of climate change. Long term averages can be difficult for people to relate to, but what we are showing here is the notable change in frequencies of extreme weather that can have a real impact on people’s lives.

“2023 was another year of interesting and at times significant weather. . But underlying this natural variability is a continuing and increasing influence of climate change which is influencing the weather we experience.”

Professor Liz Bentley, Chief Executive of the Royal Meteorological Society, said: “This report is the authoritative annual summary of the UK climate published as a special supplement in our International Journal of Climatology. It not only helps to highlight the latest knowledge on our changing climate but also enables us to understand the trends, risks and impacts to help inform how we will need to adapt, now and in the future.

“The new analysis of days that are classified as ‘hot’ or having ‘exceptional rainfall’ highlights the increased frequency in high impact extremes we are already experiencing in the UK, and the attribution studies help to understand how human activities, such as burning fossil fuels, are making these extreme events much more likely to happen as our climate continues to change.”

https://www.metoffice.gov.uk/about-us/news-and-media/media-centre/weather-and-climate-news/2024/temperature-extremes-and-records-most-affected-by-uks-changing-climate

.

It’s the same tired old theme every year – more extreme weather, the climate is changing, and it’s all due (of course) to fossil fuels!

Apparently pleasantly warm weather is now more common than in the 1960s, but equally extremely cold days are less frequent. So how can they say we are having a  dramatic increase in the frequency of temperature extremes? As I have repeatedly argued, London is warmer than Manchester, but does that mean that London’s weather is more extreme?

And if you asked most people if they would like a slightly warmer climate, they would jump at the chance! Hence the Met Office’s need to bang the “extreme weather” drum, so as to scare the public into believing that every bit of bad weather is due to global warming.

The report itself is 121 pages long, and full of largely irrelevant waffle. Clearly the intention is to obfuscate and stop the public from finding out the real story.

But today I want to focus on rainfall, including this Met Office claim:

Although rainfall has a much higher natural variability than temperature, it is still possible to identify an increasing frequency of the wettest days over time too. By taking the top 5% of wettest days during the 1961-1990 averaging period it is possible to see how frequent these very wet days have been in the most recent decade (2014-2023).

The most recent decade has had around 20% more days of exceptional rainfall compared to the 1961-1990 averaging period. While there is no significant signal for this change being more pronounced in a specific area of the UK, overall, this analysis clearly shows an increase in the number of very wet days in the UK’s climate in recent years compared to what was observed just a few decades ago.

Comparing one ten-year period with a 30-year one is a strict no-no, as any statistician would tell you. And the Met Office is stacked with statisticians, so why did they choose to do so? And why choose the 1961-90 for that matter, rather than the 1991-2020 period which is the only one relevant now?

The answer to the second question is that 1961-90 was a much drier interlude, particularly the 1970s. Since then average annual rainfall has risen, but only back to levels seen in periods such as the 1870s and 1920s. It has nothing to do with “changing climate”; indeed the UK still has just the same climate as it has always done. But this does not mean that weather cannot vary tremendously from year to year, so inevitably some years will be wetter then normal, and others drier. Nowhere has the Met Office provided evidence that rainfall trends in the last two centuries are anything other than natural variation.

https://www.metoffice.gov.uk/hadobs/hadukp/data/download.html

Leading flood experts are fully aware of these historical variations. Professor Stuart Lane of Durham University, for instance, describes the 1960s to 80s as being a “flood-poor” period.

And the Met Office’s own graphs give their game away. For both 95th and 99th Percentiles, they show an increase up to the 1990s, but since then the trend is flat.

So much for the “climate is changing” meme!

But why do these graphs only begin in 1960? What are they trying to hide?

The Met Office says that this increasing rainfall intensity is nationwide, and their maps clearly show this is the case for Oxfordshire. So what does the data for Radcliffe Observatory tell us?

The ECA&D charts below only go to 2020, but both confirm that the 1961-90 period was drier than much of the preceding period.

Up to date data confirms that the 2014-2023 average, as used by the Met Office, is at a similar levels to much of the pre-1960 years, where 95th Percentile is concerned.

As for 99th Percentile, it is at record lows. In neither dataset is there any evident long term trend.

https://climexp.knmi.nl/start.cgi

In short, the Met Office has been caught out attempting to con the public into thinking that rainfall is becoming more extreme, when it is not.

via Watts Up With That?

https://ift.tt/YolmAfi

July 30, 2024 at 04:05AM

CFACT to Youngkin: Nantucket turbine blade failure a warning to Virginia

Read CFACT’s full letter to Governor Youngkin on wind turbines.

via CFACT

https://ift.tt/zCPnu76

July 30, 2024 at 03:03AM